Key Points
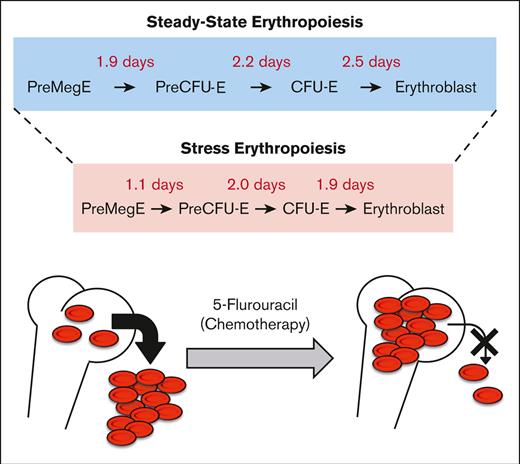
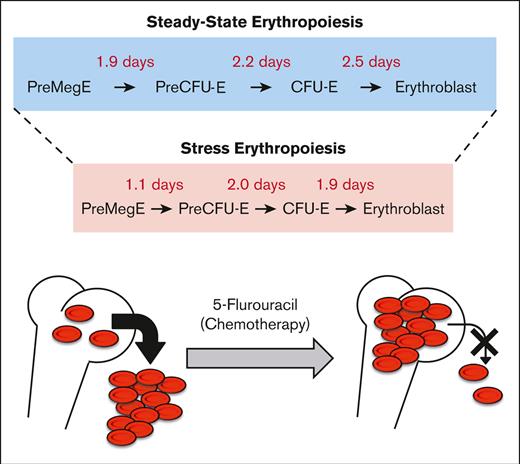
Early erythroid progenitors differentiate into erythroblasts within 6 to 7 days of steady-state erythropoiesis.
5-Flurouracil accelerates erythroid differentiation and blocks reticulocyte exit from the bone marrow.
Abstract
Our current understanding of the kinetics and dynamics of erythroid differentiation is based almost entirely on the ex vivo expansion of cultured hematopoietic progenitor cells. In this study, we used an erythroid-specific, inducible transgenic mouse line to investigate for the first time, the in vivo erythroid differentiation kinetics under steady-state conditions. We demonstrated that bipotent premegakaroycyte/erythroid (PreMegE) progenitor cells differentiate into erythroid–committed proerythroblast/basophilic erythroblasts (ProBasoE) after 6.6 days under steady-state conditions. During this process, each differentiation phase (from PreMegE to precolony forming unit-erythroid [PreCFU-E], PreCFU-E to CFU-E, and CFU-E to ProBasoE) took ∼2 days in vivo. Upon challenge with 5-flurouracil (5-FU), which leads to the induction of stress erythropoiesis, erythroid maturation time was reduced from 6.6 to 4.7 days. Furthermore, anemia induced in 5-FU-treated mice was shown to be due not only to depleted bone marrow erythroid progenitor stores but also to a block in reticulocyte exit from the bone marrow into the circulation, which differed from the mechanism induced by acute blood loss.
Introduction
Hematopoietic stem cells (HSC) produce multipotent progenitors that give rise to bipotent (premegakaroycyte/erythroid [PreMegE]) progenitors that retain both erythroid and megakaryocytic differentiation potential.1 This lineage-restricted PreMegE generates a precolony forming unit-erythroid (PreCFU-E), which contains the first erythroid-restricted progenitors, functionally defined as burst forming units-erythroid (BFU-E). The latter then differentiates into progenitors called CFU-E.1 CFU-E is divided 3 to 5 times over a period of 2 to 3 days to further differentiate into red blood cells.2 Our current understanding of erythroid differentiation properties relies primarily on in vitro and ex vivo cultures.2-5 Therefore, the in vivo rate of differentiation from 1 erythroid stage to another has not yet been adequately examined.
Recently, HSC-specific CreERT2 mouse lines were generated to trace the hematopoietic lineage differentiation kinetics in vivo.6,7 These mice were crossed with a reporter line in which a low dose of tamoxifen was administered to label a small fraction of hematopoietic stem and progenitor cells, after which the appearance of reporter-gene–positive cells within multiple hematopoietic lineages was monitored. However, owing to limitations in the precision with which specific multilineage differentiation stages can be defined, the duration of differentiation from stage to stage can only be partially assessed.6,7
To overcome these limitations, we investigated the erythroid differentiation kinetics in vivo using a new inducible erythroid-specific CreERT2 mouse line.8 We found that progression from the PreMegE to the ProBasoE stages required 6.6 days in vivo, which was shortened to 4.7 days after 5-FU (fluorouracil)–induced stress erythropoiesis. We further discovered that 5-FU treatment led to anemia in mice, at least partially, by blocking the exit of reticulocytes from the bone marrow (BM) into circulation.
Materials and methods
Mice
G1BCreERT2 transgenic8 and EpoR-GFPCre9 knockin mice were crossed with the R26 TdTomato reporter mice.10 To induce Cre recombinase activity in G1B mice, 8 to 12 weeks old mice were injected intraperitoneally with tamoxifen (Tx; 2 mg per injection on alternate days for a total of 4 injections). Five days after the final Tx injection (Figure 1A; supplemental Figures 1 and 2) or 1 to 21 days after the final Tx injection (Figure 1B-C; supplemental Figure 3), mouse BM and spleen were collected for analysis. Mice were injected intraperitoneally with 5-FU (150 mg/kg) once 11 days before the final Tx injection (Figure 1; supplemental Figure 4). All the animal procedures were approved by the Institutional Animal Care and Use Committee, University of Michigan (PRO00009778). The primers used for genotyping have been described in previous studies.8-10
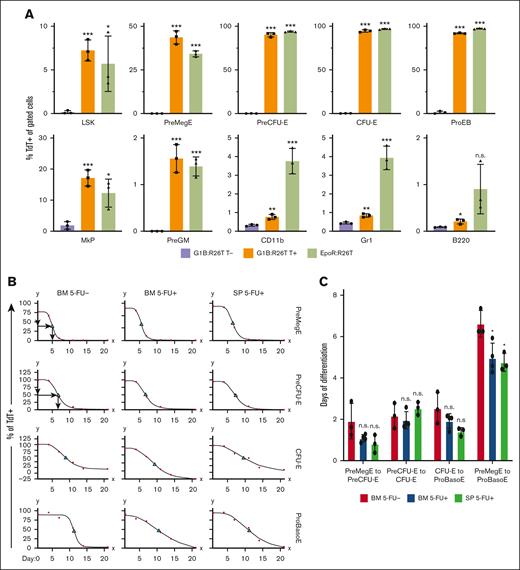
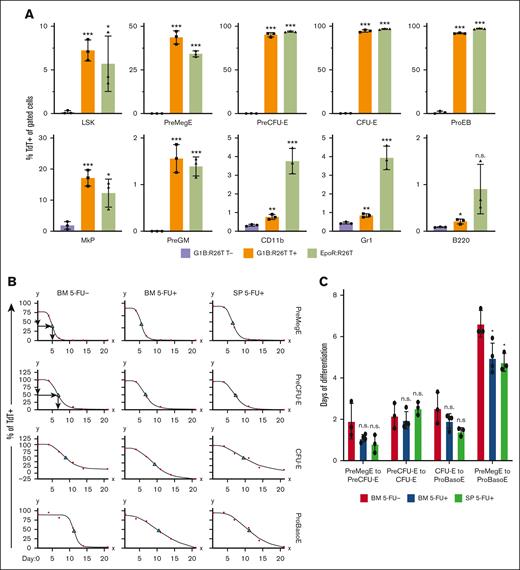
Differentiation kinetics of BM and spleen erythroid cells under steady-state and stress conditions. (A) Comparison of hematopoietic lineage Cre specificity between G1B- and EpoR-Cre mice. The percentage of TdT+ cells among erythroid precursors and progenitors, as well as among lymphoid (B220) and myeloid (CD11b and Gr1) cells, was calculated in G1B:R26T mice 5 days after the last Tx injection (T+) (orange bars) and in EpoR:R26T mice (green bars). Untreated (T-) G1B:R26T mice (purple bars) were included as controls. Data are shown as mean ± standard deviation from 3 mice. (B) Erythroid differentiation kinetics for PreMegE, PreCFU-E, CFU-E, and ProBasoE cells under steady state (5-FU-; left column) or 5-FU-induced stress erythropoiesis (5-FU+; middle and right columns). The percentages of TdT+ cells in G1B:R26T BM (left and middle columns) or spleen (SP; right column) were quantified by flow cytometry at various time points (1, 4, 7, 14, and 21 days after the final Tx injection). Red circles represent data points and green triangles denote TC50. For each time point, 3 to 4 mice were analyzed. (C) Erythroid differentiation time (days) from PreMegE to PreCUF-E, PreCFU-E to CFU-E, CFU-E to ProBasoE, and PreMegE to ProBasoE. Red bars represent the time of erythroid differentiation (days) of the BM cells under steady-state conditions. Blue bars represent the erythroid differentiation time of BM cells under 5-FU-induced stress conditions. Green bars represent the erythroid differentiation time of splenic cells in the setting of 5-FU-induced stress. Data are shown as mean ± standard deviation from 3 or 4 experiments. ∗P < .05; ∗∗P < .01; ∗∗∗P < .001; unpaired Student t test. LSK, lineage- scal1+ kit+ cells; n.s., not significant; PreGM, pre-colony-forming unit-granulocyte-macrophage.
Differentiation kinetics of BM and spleen erythroid cells under steady-state and stress conditions. (A) Comparison of hematopoietic lineage Cre specificity between G1B- and EpoR-Cre mice. The percentage of TdT+ cells among erythroid precursors and progenitors, as well as among lymphoid (B220) and myeloid (CD11b and Gr1) cells, was calculated in G1B:R26T mice 5 days after the last Tx injection (T+) (orange bars) and in EpoR:R26T mice (green bars). Untreated (T-) G1B:R26T mice (purple bars) were included as controls. Data are shown as mean ± standard deviation from 3 mice. (B) Erythroid differentiation kinetics for PreMegE, PreCFU-E, CFU-E, and ProBasoE cells under steady state (5-FU-; left column) or 5-FU-induced stress erythropoiesis (5-FU+; middle and right columns). The percentages of TdT+ cells in G1B:R26T BM (left and middle columns) or spleen (SP; right column) were quantified by flow cytometry at various time points (1, 4, 7, 14, and 21 days after the final Tx injection). Red circles represent data points and green triangles denote TC50. For each time point, 3 to 4 mice were analyzed. (C) Erythroid differentiation time (days) from PreMegE to PreCUF-E, PreCFU-E to CFU-E, CFU-E to ProBasoE, and PreMegE to ProBasoE. Red bars represent the time of erythroid differentiation (days) of the BM cells under steady-state conditions. Blue bars represent the erythroid differentiation time of BM cells under 5-FU-induced stress conditions. Green bars represent the erythroid differentiation time of splenic cells in the setting of 5-FU-induced stress. Data are shown as mean ± standard deviation from 3 or 4 experiments. ∗P < .05; ∗∗P < .01; ∗∗∗P < .001; unpaired Student t test. LSK, lineage- scal1+ kit+ cells; n.s., not significant; PreGM, pre-colony-forming unit-granulocyte-macrophage.
Flow cytometry
Total BM cell isolation, antibody staining, and flow cytometry were performed as described previously.8 Peripheral blood was collected from the mice by facial vein bleeding into EDTA-treated tubes8 and the reticulocyte count was determined by thiazole orange staining followed by flow cytometry. The absolute number of reticulocytes in the peripheral blood was calculated for each mouse based on an estimated blood volume of 77 to 80 mL/kg (The Jackson Laboratory). The antibodies used for the flow cytometry are listed in supplemental Table 1. A standard curve of TdTomato clearance for erythroid kinetic analysis was established using an online tool from MyAssays Ltd.
Statistics
Data are presented as mean ± standard deviation. Statistical analysis was performed using an unpaired Student t test.
Results and discussion
Activity and erythroid specificity of EpoR-Cre compared with G1B mice
In this study, we investigated erythroid differentiation kinetics in vivo in a conditional erythroid-specific CreERT2 mouse8 (abbreviated G1B) bearing a Gata1 Bacteria Artificial Chromosome containing all cis-elements known to drive normal Gata1 gene expression in erythroid cells11-13 and compared the G1B line to another well-characterized erythroid-restricted Cre-driver, EpoR-GFPCre.9 By crossing either line with Cre reporter R26-TdTomato (R26T) mice,10 we generated G1B:R26T and EpoR:R26T offspring. We administered Tx intraperitoneally, to activate Cre recombinase in G1B:R26T mice. BM or peripheral blood (PB) was isolated at the times indicated in the figure legends for flow cytometric or histological analysis to distinguish the various stages of erythropoiesis1 (supplemental Figure 1) or to distinguish between mature blood cells. TdTomato-positive (TdT+) cells, the readout for productive Cre recombinase activity, were monitored by flow cytometry. Untreated G1B:R26T mice (minus Tx addition) were examined as negative controls.
During erythroid differentiation,1 ∼5% to 7% of LSK (lineage- sca1+ kit+ cells, hematopoietic stem and progenitors) cells, ∼40% of PreMegE cells, ∼90% of PreCFU-E, ∼90% of CFU-E, and ∼90% of proerythroblast (ProEB) cells were labeled with TdT in both G1B:R26T and EpoR:R26T mice. Among megakaryocyte progenitors (MkPs), 10% to 20% exhibited Cre activity in both lines of mice. Of the PreGM (pre-colony-forming unit-granulocyte-macrophage)1 cells, ∼1.5% were TdT+ in either Cre line, possibly because of contamination by erythroid cells during flow gating (supplemental Figure 1A). Notably, consistent with the data presented in another recent study,14 ∼4% of Gr1+ or CD11b+ myeloid cells were TdT+ in EpoR:R26T mice, whereas there were notably fewer (∼0.8%) in G1B:R26T mice (Figure 1A; supplemental Figure 2). Within the B220+ (B lineage) cells, a very small percentage was TdT+. Taken together, we conclude that G1B and EpoR-GFPCre mice exhibit very similar Cre-mediated excision efficiency in the erythroid compartment. However, Cre activity appeared to be detectable in a small subpopulation of myeloid cells in EpoR:R26T mice.
Because EpoR-GFPCre mice also express low levels of GFP in erythroid cells,9 we investigated the possibility that the TdT+ signal detected in EpoR:R26T mice was caused by fluorescent signal leakage from GFP expression. We compared TdT expression in all previously examined cell populations in the wild-type controls, EpoR-GFPCre, and EpoR-GFPCre:R26T mice. The data showed that the TdT signal remained unchanged in all cell populations in EpoR-GFPCre mice, except in the MkP compartment (supplemental Figure 3), indicating that there was no GFP flow signal leakage into the TdT channel in EpoR-GFPCre:R26T mice.
In vivo differentiation kinetics during steady-state erythropoiesis
We used G1B:R26T mice to investigate the kinetics of erythroid differentiation. After Tx administration, PreMegE and erythroid-committed cells became TdT+. After Tx administration (supplemental Figure 4A), the TdT+ cells became diluted by increasing the number of nascent TdT–negative erythroid cells derived from the BM pool of TdT–negative hematopoietic progenitors. By plotting the disappearance of TdT+ cells over time, we calculated the duration to clear 50% of the maximum TdT+ cells in each population (designated TC50).
For example, in 1 cohort, 75% of PreMegE cells were labeled on day 1 after Tx administration. The percentage of TdT+ PreMegE cells decreased to 65% by day 4, to 5% by day 7 and to 0% by day 11 (data depicted by red dots in Figure 1B). Because the maximum percentage of TdT+ PreMegE was 75% on day1, based on the PreMegE clearance, we estimated that 37.5% (75% × 0.5) of PreMegE would be TdT+ on day 5; therefore, the TC50 for PreMegE was (5 – 1 =) 4 days (top left panel, Figure 1B). Similarly, the TC50 for PreCFU-E was estimated to be 5.7 days (second panel, left column, Figure 1B). Based on the TC50 for PreMegE and PreCFU-E, the data indicate that it takes an average of (5.7 – 4 =) 1.7 days for PreMegE to differentiate into PreCFU-E in this cohort.
Because the differentiation time from CFU-E to ProEB and basophilic erythroblasts (BasoE) was indistinguishable (supplemental Figure 5), we combined both precursors into a single population, which we subsequently referred to as ProBasoE. We repeated this experiment in 3 separate cohorts and found that it took ∼2 days for erythroid cells to sequentially traverse each differentiation stage: from PreMegE to PreCFU-E, from PreCFU-E to CFU-E, and from CFU-E to ProBasoE (Figure 1B-C).
Accelerated erythroid differentiation after anemic stress
Next, we investigated the kinetics of erythropoiesis under stress conditions, in both the BM and the predominant site of extramedullary hematopoiesis, the spleen (SP). Administration of 5-FU reportedly leads to anemia and the induction of stress erythropoiesis.15 G1B:R26T mice were administered a single peritoneal injection of 5-FU (150 mg/kg) on day −11, followed by 4 Tx injections (supplemental Figure 4B), at which time the kinetics of erythropoiesis were analyzed. The optimal time for 5-FU injection was determined based on the recovery of c-Kit+ and/or CD71+ cells in BM (supplemental Figure 6).
We found that the total differentiation time from PreMegE to ProBasoE was, on average, 1.7 days shorter in 5-FU–mediated stress erythropoiesis compared with steady-state erythropoiesis, a finding that is consistent in both the BM and SP (Figure 1B-C). The reduced differentiation time was driven primarily by the shortened duration of differentiation from PreMegE to PreCFU-E and from CFU-E to ProBasoE (Figure 1C). Therefore, we were able to take advantage of conditional creERT2 in G1B mice to address and compare for the first time the differentiation kinetics of both steady state and stress erythropoiesis in vivo.
5-FU treatment impairs reticulocyte exit from the BM
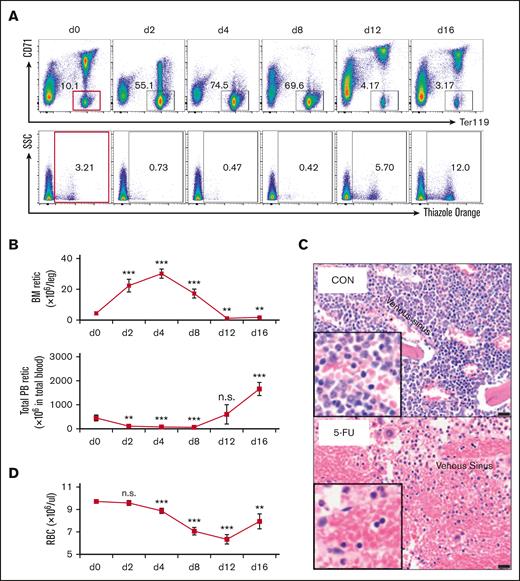
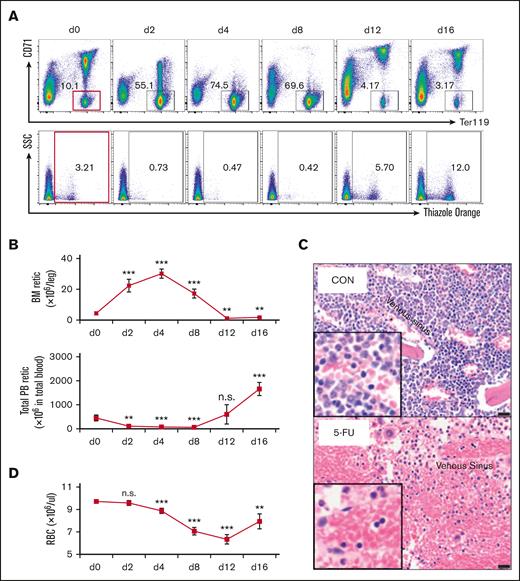
After 5-FU treatment, the PB reticulocyte count decreased precipitously, whereas the absolute number of reticulocytes in the BM increased significantly (Figure 2A-B). To explore this observation in greater detail, we quantified the absolute reticulocyte number in the PB and BM of wild-type mice between 2 and 16 days after a single injection of 5-FU at 150 mg/kg (Figure 2A-B). The PB reticulocyte number decreased by 76% 2 days after 5-FU administration and remained low until day 8 (Figure 2B). In contrast, the opposite was true for the BM, where the absolute number of reticulocytes increased significantly between days 2 and 8 after 5-FU treatment (Figure 2B). These data indicate that there may be a significant defect in reticulocyte exit from the BM into the circulation after 5-FU administration. Consistent with this hypothesis, BM histology also indicated that a greater number of enucleated cells (reticulocytes and erythrocytes) accumulated in the bone marrow 4 days after 5-FU treatment (Figure 2C).
5-FU treatment leads to defective reticulocyte exit from the BM into circulation. (A) Wild-type mice received 1 5-FU injection on day 0 (150 mg/kg) and mice were analyzed at various times during recovery (at 2, 4, 8, 12, and 16 days). BM cells were stained with anti-CD71 and anti-Ter119 antibodies (upper panels) and PB were stained with thiazole orange (lower panels) and analyzed by flow cytometry to characterize the distribution of either the CD71/Ter119 subsets of erythroid cells or to enumerate the absolute reticulocyte number, respectively. On each day, 4 to 5 mice were analyzed. (B) Changes in the absolute number of reticulocytes in the BM (1 femur + 1 tibia) and PB of 5-FU-treated or untreated (d0) mice. Data are shown as mean ± standard deviation and 4 to 5 mice were analyzed. (C) Histology of control and 5-FU-treated mice by H&E staining. Venous sinuses (marked with asterisks). Bar = 20 μm. (D) Changes in PB red blood cell counts in 5-FU-treated and untreated (d0) mice after a single 5-FU injection. Data are shown as mean ± standard deviation and 4 to 5 mice were analyzed. ∗P < .05; ∗∗P < .01; ∗∗∗P < .001; unpaired Student t test. H&E hematoxylin and eosin; n.s., not significant; RBC, red blood cell; Retic, reticulocyte; SSC, side scatter.
5-FU treatment leads to defective reticulocyte exit from the BM into circulation. (A) Wild-type mice received 1 5-FU injection on day 0 (150 mg/kg) and mice were analyzed at various times during recovery (at 2, 4, 8, 12, and 16 days). BM cells were stained with anti-CD71 and anti-Ter119 antibodies (upper panels) and PB were stained with thiazole orange (lower panels) and analyzed by flow cytometry to characterize the distribution of either the CD71/Ter119 subsets of erythroid cells or to enumerate the absolute reticulocyte number, respectively. On each day, 4 to 5 mice were analyzed. (B) Changes in the absolute number of reticulocytes in the BM (1 femur + 1 tibia) and PB of 5-FU-treated or untreated (d0) mice. Data are shown as mean ± standard deviation and 4 to 5 mice were analyzed. (C) Histology of control and 5-FU-treated mice by H&E staining. Venous sinuses (marked with asterisks). Bar = 20 μm. (D) Changes in PB red blood cell counts in 5-FU-treated and untreated (d0) mice after a single 5-FU injection. Data are shown as mean ± standard deviation and 4 to 5 mice were analyzed. ∗P < .05; ∗∗P < .01; ∗∗∗P < .001; unpaired Student t test. H&E hematoxylin and eosin; n.s., not significant; RBC, red blood cell; Retic, reticulocyte; SSC, side scatter.
Notably, a reduction in the PB red blood cells count was observed after 5-FU injection, which appeared to coincide with the time when the reticulocyte count was high in the BM but low in the PB (Figure 2B,D). These data indicate that in addition to the depletion of proliferating cells, another possible mechanism by which 5-FU induces anemia could be to block reticulocyte exit from the BM into the PB, a finding that has not been previously described.
Finally, we asked whether reticulocyte accumulation in the BM could be a direct consequence of 5-FU administration, or was it possibly caused by indirect physiological insults induced by anemic stress. To do so, we explored an alternative stress model for hemorrhage-induced anemia. Direct bleeding in mice induced anemia, as the red blood cells count dropped significantly (supplemental Figure 7A). When we calculated the absolute number of reticulocytes in the control and anemic mice, we found that the BM reticulocyte count was reduced by 50% after bleeding (supplemental Figure 7B-C), demonstrating that reticulocyte egress from the BM was not significantly affected by these alternative anemia-inducing conditions.
Acknowledgments
The authors thank Daniel Lucas at Cincinnati Children’s Hospital for insightful discussions and Ingrid Bergin at the Unit for Laboratory Animal Medicine in vivo animal core facility at the University of Michigan for bone histology analysis. This work was supported by National Heart, Lung, and Blood Institute grants P01 HL117658 (J.D.E.), K08 DK127013 (S.A.S.), R01 HL148333 (R.K.), and HL157062 (R.K.).
Authorship
Contribution: G.M., K.-C.L., R.K., J.D.E., and L.Y. designed the study and wrote the manuscript; G.M., Y.W., Q.W., A.F., A.S.-M., X.L., S.A.S., K.-C.L., and L.Y. acquired and analyzed the data; and G.M., R.K., J.D.E., and L.Y. interpreted the data.
Conflict-of-interest disclosure: The authors declare no competing financial interests.
Correspondence: James Douglas Engel, Department of Cell and Developmental Biology, University of Michigan, 109 Zina Pitch Pl, Ann Arbor, MI 48109; e-mail: engel@umich.edu; and Lei Yu, Department of Cell and Developmental Biology, University of Michigan, 109 Zina Pitch Pl, Ann Arbor, MI 48109; e-mail: leyu@med.umich.edu.
References
Author notes
The mouse model in this study was deposited to The Jackson Laboratory. Other data are available upon request from the corresponding authors, James Douglas Engel (engel@umich.edu) and Lei Yu (leyu@med.umich.edu).
The full-text version of this article contains a data supplement.

