Key Points
TP53 mutations are frequent events in certain subtypes of PTCL.
Patients with TP53-mutated PTCL experience high relapse rates when treated with curative-intent CHOP-based chemotherapy.
Abstract
Nodal peripheral T-cell lymphomas (PTCL), the most common PTCLs, are generally treated with cyclophosphamide, doxorubicin, vincristine, and prednisone (CHOP)-based curative-intent chemotherapy. Recent molecular data have assisted in prognosticating these PTCLs, but most reports lack detailed baseline clinical characteristics and treatment courses. We retrospectively evaluated cases of PTCL treated with CHOP-based chemotherapy that had tumors sequenced by the Memorial Sloan Kettering Integrated Mutational Profiling of Actionable Cancer Targets next-generation sequencing panel to identify variables correlating with inferior survival. We identified 132 patients who met these criteria. Clinical factors correlating with an increased risk of progression (by multivariate analysis) included advanced-stage disease and bone marrow involvement. The only somatic genetic aberrancies correlating with inferior progression-free survival (PFS) were TP53 mutations and TP53/17p deletions. PFS remained inferior when stratifying by TP53 mutation status, with a median PFS of 4.5 months for PTCL with a TP53 mutation (n = 21) vs 10.5 months for PTCL without a TP53 mutation (n = 111). No TP53 aberrancy correlated with inferior overall survival (OS). Although rare (n = 9), CDKN2A-deleted PTCL correlated with inferior OS, with a median of 17.6 months vs 56.7 months for patients without CDKN2A deletions. This retrospective study suggests that patients with PTCL with TP53 mutations experience inferior PFS when treated with curative-intent chemotherapy, warranting prospective confirmation.
Introduction
Comprising ∼10% to 15% of all non-Hodgkin lymphoma cases, peripheral T-cell lymphoma (PTCL) encompasses more than 30 histological subtypes.1,2 The relative frequency of each subtype is influenced by geographic region, but the most common PTCL, globally, remains nodal PTCL.2 Nodal PTCLs include PTCL–not otherwise specified (PTCL-NOS), angioimmunoblastic T-cell lymphoma (AITL), other PTCL with a follicular T-helper cell phenotype (PTCL-TFH), and anaplastic large cell lymphoma (ALCL), including anaplastic lymphoma kinase (ALK)-positive and -negative disease.1-3 Although pathologically and molecularly distinct, nodal PTCLs are most often treated similarly, with curative-intent cyclophosphamide, doxorubicin, vincristine, and prednisone (CHOP)-based chemotherapy for eligible patients.3-8 In patients with CD30+ PTCL, vincristine can be replaced by brentuximab vedotin (BV), based on the ECHELON-2 data showing improved survival compared with use of CHOP, although this advantage was predominantly driven by patients with ALCL.9 For those with CD30– PTCL, etoposide can be added, which has been correlated with improved response rates and survival, particularly in patients aged ≤60 years.4,10,11 For eligible patients who achieve remission, high-dose chemotherapy with autologous stem cell transplantation (ASCT) rescue can be offered, with ASCT showing a survival advantage in nonrandomized prospective trials, compared with historical control therapies, and in some retrospective analyses.4,12-14
Over the past decade, the genetic landscape and oncogenic underpinning of PTCL have been more clearly delineated and, to some extent, can aid in prognosticating and predicting the response to treatments.15-21 However, although most studies define molecular risk factors for inferior overall survival (OS), they often omit comprehensive details on both first-line treatment and treatment at relapse. Moreover, few reports detail somatic genetic risk factors for refractory or relapsed disease when treated with curative-intent strategies. This makes it challenging to risk stratify patients who may benefit from alternative induction and consolidation strategies and to stratify patients in future first-line randomized control trials.
We sought to add to the existing PTCL genetic literature by incorporating baseline clinical characteristics and comprehensive treatment data for a cohort of patients treated with curative-intent CHOP-based chemotherapy and to combine these data with a clinically validated targeted next-generation sequencing (NGS) panel to identify features of patients at highest risk for relapsed or refractory disease.
Methods
Patient selection
The protocol for this retrospective study was approved by the institutional review board (IRB) at Memorial Sloan Kettering Cancer Center (MSK; IRB #22-025) and was written in compliance with the principles outlined in the Declaration of Helsinki. The online platform cBioPortal for Cancer Genomics was used to screen for all patients with PTCL who visited MSK from 1 April 2015 to 31 December 2020 and had NGS of tumor biopsies performed primarily via the Memorial Sloan Kettering Cancer Center Integrated Mutational Profiling of Actionable Cancer Targets (MSK-IMPACT; 1 included tumor was sequenced using a smaller 49-gene MSK-targeted sequencing panel at diagnosis).22,23 MSK-IMPACT is a clinically validated, targeted NGS panel analyzing somatic alterations in up to 500 genes.24 Using various iterations of this NGS platform, the mutational landscape of >10 000 tumors has been published, and MSK-IMPACT has become an integral part of the PTCL pathological work-up at MSK.25
MSK-IMPACT panels and sequencing results are provided in supplemental Table 1. In addition to the nodal PTCL subtypes, we also included enteropathy-associated T-cell lymphoma and monomorphic epitheliotropic T-cell lymphoma (MEITL) because they are treated similarly to nodal PTCL.
Subsequently, patients’ electronic medical records were manually reviewed to confirm the diagnosis and first-line treatment regimen (regimens listed in Table 1). All diagnoses were confirmed by ≥1 hematopathologist at MSK. We included only adults aged ≥18 years. Patients were excluded if they were lost to follow-up during first-line treatment, underwent allogeneic stem cell transplantation (allo-SCT) in first remission, or had active central nervous system involvement at the time of diagnosis. We manually extracted electronic medical records data on baseline clinical characteristics, treatments, and survival for patients meeting all inclusion criteria, which included having an aforementioned histology, being treated with curative-intent CHOP-based chemotherapy (with or without ASCT in first remission), and having MSK-IMPACT performed on biopsied tumor tissue.
We anticipated that some patients with tumors sequenced via MSK-IMPACT were not patients of an MSK oncologist during first-line therapy, thus, potentially missing key clinical baseline prognostic data, and/or patients for whom MSK-IMPACT would have had been ordered only at the time of relapse, thereby inducing a selection bias. Accordingly, 3 cohorts were grouped for analysis: (1) the entire MSK-IMPACT–sequenced cohort meeting the inclusion criteria (entire cohort); (2) a cohort with complete clinical baseline prognostic data, including pretreatment laboratory data and baseline bone marrow (BM) biopsies (complete clinical data [CCD] cohort); and (3) the cohort that was managed by an MSK oncologist during the CHOP-based treatment and also had their pretreatment tumor biopsy sequenced at the time of CHOP-based treatment and/or before relapse, when applicable (prospective cohort).
MSK-IMPACT results from pretreatment biopsies were analyzed when available; sequencing results from progression biopsies (applicable only to the entire and CCD cohorts) were otherwise analyzed.
Statistical analysis
Progression-free survival (PFS) was calculated from the start of chemotherapy to progression or death. The OS was calculated from the start chemotherapy to the date of death, with data of living patients censored at the time of the last documented follow-up, with a data cutoff on 31 May 2021.
Univariate analysis was performed using a Cox proportional hazards regression analysis for PFS and OS. Characteristics with P ≤ .05 in the univariate analyses were included in a multivariate analysis. Baseline clinical parameters were chosen based on previously described prognostic indicators in PTCL.26,27 Characteristics also included the use of etoposide, use of BV, receipt of consolidation ASCT in first remission, and/or receipt of maintenance therapy after CHOP-based chemotherapy with or without consolidative ASCT. Further characteristics included genetic aberrancies (mutations or copy number alterations [CNAs]) that occurred in ≥5% of the entire cohort.
Fisher's exact test and the Wilcoxon rank sum test were used for the descriptive statistical analyses of categorical data and continuous data, respectively. Comparisons between survival curves were performed using the log-rank test, and hazard ratios (HRs) were computed using the Cox proportional hazards model. Data analysis was generated using SAS software (Cary, NC). The oncoplot was developed using R and Complex Heatmap package (version 4.2.2), and the lollipop plot was generated using cBioPortal.
Results
Patient distribution into cohorts
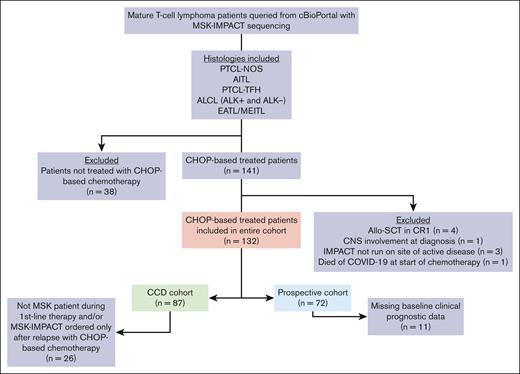
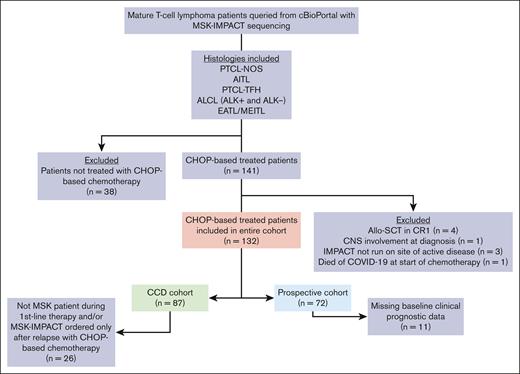
A total of 396 patients with PTCL sequenced via MSK-IMPACT were identified through cBioPortal, of whom 179 (45%) had a confirmed histology of interest. Of these 179 patients, 141 (79%) were treated with a CHOP-based regimen. Nine patients were further excluded, leaving 132 patients comprising the entire cohort (Figure 1). There were 45 patients (34%) missing ≥1 baseline clinical prognostic parameter (Table 1). Missing baseline clinical variables included lactate dehydrogenase level (LDH), the most frequent and only missing variable in 24 patients (18%), followed by BM biopsies, the only missing variable in 10 patients (8%); both baseline LDH and BM biopsies were missing in 11 patients (8%). Thus, the CCD cohort consisted of 87 patients (66%; Figure 1).
Flowchart of patient identification and distribution into respective cohorts. The entire cohort includes 132 patients with NGS of tumor samples. CCD was available for 87 patients, and 72 patients were managed by an MSK oncologist for their first-line treatment and had tumor NGS before or during CHOP-based treatment. CNS, central nervous system; CR1, first complete remission; EATL, enteropathy-associated T-cell lymphoma.
Flowchart of patient identification and distribution into respective cohorts. The entire cohort includes 132 patients with NGS of tumor samples. CCD was available for 87 patients, and 72 patients were managed by an MSK oncologist for their first-line treatment and had tumor NGS before or during CHOP-based treatment. CNS, central nervous system; CR1, first complete remission; EATL, enteropathy-associated T-cell lymphoma.
Of the 87 patients in the CCD cohort, 26 (30%) were not included in the prospective cohort because they were not patients of MSK until after relapse or had MSK-IMPACT sequencing only after relapse. The prospective cohort consisted of 72 patients (55% of the entire cohort). There were 61 patients who were included in both the CCD cohort and the prospective cohort.
Baseline characteristics and treatments
Table 1 depicts the baseline characteristics of the entire cohort (N = 132), CCD cohort (n = 87), and prospective cohort (n = 72) (note that throughout the manuscript and supplement, uppercase N denotes the entire cohort, whereas lowercase n denotes all other groups). Among the entire cohort, the median age at diagnosis was 65 years (range, 25-82 years) with a male predominance (61%; n = 81). The most common histology was AITL, (47%; n = 62) followed by PTCL-NOS (27%; n = 36), ALK− ALCL (11%; n = 15), PTCL-TFH (7%; n = 9), ALK+ ALCL (5%; n = 6), and MEITL (3%; n = 4). The majority of patients had advanced-stage disease (83%; n = 110). Most patients in the CCD cohort had a low-intermediate to high-risk score on the international prognostic index (IPI; 81%; n = 70) and a prognostic index for T-cell lymphomas (PIT) score of ≥2 (49%; n = 43).4,26-28
The most common CHOP-based regimen was that containing etoposide, including both CHOP with etoposide (CHOEP) or etoposide, prednisone, vincristine, cyclophosphamide, and doxorubicin (EPOCH) (45%; n = 59) followed by CHOP (30%; n = 40) or a CHOP-based clinical trial with the addition of a novel investigational drug (13%; n = 17). BV-containing regimens were used in 16 patients (12%), including 9 of 21 patients with ALCL (43%). Of the total cohort, 50 patients (38%) received ASCT in first remission, and in the prospective cohort, 33 patients (46%) received ASCT in first remission, and 13 patients (10%) were treated on a maintenance therapy clinical trial protocol either after CHOP-based chemotherapy (n = 3) or after ASCT consolidation (n = 10).
There were no significant differences in any baseline clinical characteristic, chemotherapy regimen, or ASCT status among the 3 cohorts (Table 1).
MSK-IMPACT results
Of the entire cohort, samples used for sequencing were most often taken from a lymph node biopsy (70%; n = 93), whereas 8 (6%) had sequencing performed using a sample of leukemic blood or a biopsy of BM with disease involvement, and 31 (24%) came from other diseases sites. A patient-matched control was available in 103 (78%) cases, with those lacking a patient-matched control being matched to a pool of healthy donor control tissues (supplemental Table 1A).
Of the entire cohort, 87 patients (66%) had tumor samples sequenced upon initial diagnostic biopsy, 25 (19%) upon first relapse, and 20 (15%) beyond first relapse. For the CCD cohort, 64 patients (74%) had tumor samples sequenced upon initial diagnosis, 15 (17%) upon first relapse, and 8 (9%) beyond first relapse. By predetermined definition, all patients in the prospective cohort had sequencing performed using a diagnostic biopsy (supplemental Table 1A).
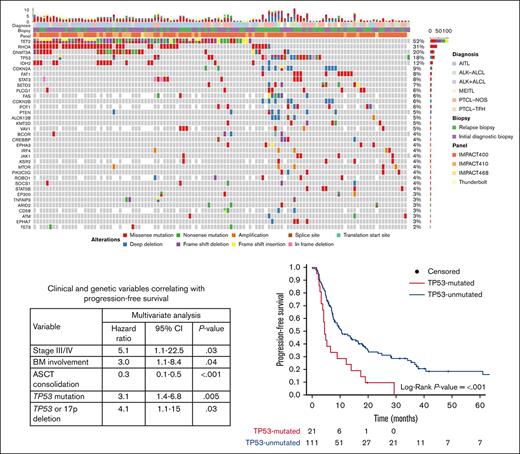
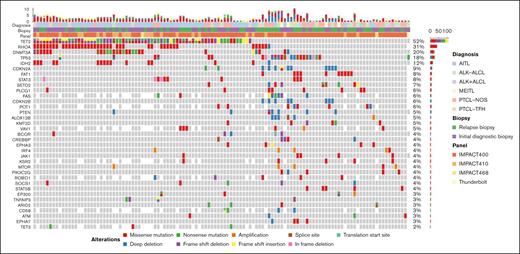
The most common mutations for the entire cohort were in TET2 (52%; n = 69), RHOA (30%; n = 40), DNMT3A (19%; n = 25), TP53 (16%; n = 21), and IDH2 (11%; n = 15). The most common CNAs were TP53 deletions (7%; n = 9) and CDKN2A deletions (7%; n = 9) (Figure 2; supplemental Table 1A-J).
Oncoplot of the most frequent genetic aberrations in the entire cohort (N = 132). Each column represents a unique patient. The top row represents both the number and type of alterations detected in each biopsy. Each row represents the diagnosis, biopsy, sequencing panel, gene and type of mutation, and/or CNA. Gray tiles indicate wild type. Missing tiles represent a gene that is not included in that specific NGS panel. Percent frequencies in the far-right column represent both mutations and CNAs for that specific gene.
Oncoplot of the most frequent genetic aberrations in the entire cohort (N = 132). Each column represents a unique patient. The top row represents both the number and type of alterations detected in each biopsy. Each row represents the diagnosis, biopsy, sequencing panel, gene and type of mutation, and/or CNA. Gray tiles indicate wild type. Missing tiles represent a gene that is not included in that specific NGS panel. Percent frequencies in the far-right column represent both mutations and CNAs for that specific gene.
Among the 36 cases of PTCL-NOS, the most common mutations were in TP53 (28%; n = 10), and TET2 (28%; n = 10), followed by PLCG1 (17%; n = 6), STAT5B (11%; n = 4), and KMT2D mutations (11%; n = 4). TP53 or 17p deletions (11%; n = 4) were also observed. No patient had an IDH2 mutation, and 2 patients (6%) had RHOA mutations (Figure 2; supplemental Table 1B-C).
The most common aberrancy among the 62 cases of AITL were TET2 mutations (82%; n = 51) followed by mutations in RHOA (53%; n = 33), DNMT3A (31%; n = 19), and IDH2 (23%; n = 14). All IDH2 mutations involved exon 4 at R172X. Of the 52 cases with TET2 mutations, 36 (71%) had >1 mutation in TET2. Of the 33 RHOA mutations, 29 (88%) were RHOA G17V mutations. TP53 mutations (3%; n = 2), TP53 deletions (2%; n = 1), and CDKN2A deletions (2%; n = 1) were rare (Figure 2; supplemental Table 1D-E).
The most common aberrancy among the 9 cases of PTCL-TFH were TET2 mutations (67%; n = 6) followed by mutations in RHOA (56%; n = 5), DNMT3A (44%; n = 4), TP53 (22%; n = 2), and TET3 (22%; n = 2) (Figure 2; supplemental Table 1F-G).
The most common aberrancy among the 15 cases of ALK− ALCL were TP53 mutations (33%; n = 5), followed by TP53 deletions (27%; n = 4), STAT3 mutations (20%; n = 3), and FAT1 mutations (20%; n = 3) (Figure 2; supplemental Table 1H-I). TP63 and DUSP22/IRF4 rearrangements were detected via other methodologies (fluorescence in-situ hybridization and/or RNA sequencing) in 3 (20%) and 2 (13%) cases, respectively, although not all cases of ALK− ALCL were evaluated for these structural variations via these other methodologies. No patient with either of these rearrangements had a TP53 mutation.
Among this series of 132 cases, there were 6 cases of ALK+ ALCL (5%) and 4 cases of MEITL (3%). Aside from ALK rearrangements, the most common aberrancies among the 6 cases of ALK+ ALCL were FAT1 mutations (33%; n = 2), whereas TP53 mutations occurred in 1 case (17%) (Figure 2; supplemental Table 1H-I). Of the 4 cases of MEITL, 3 (75%) had CDKN2A aberrancies (mutation, n = 1; deletions, n = 2), 3 (75%) had SETD2 mutations, and 1 (25%) had a TP53 mutation (Figure 2; supplemental Table 1J-K).
Responses and survival
The overall response rate was 69% (62% complete response [CR], n = 82 and 7% partial response [PR], n = 9) for the entire cohort, 73% (67% CR and 6% PR) for the CCD cohort, and 80% (74% CR and 6% PR) for the prospective cohort. The median follow-ups among survivors were 26, 23, and 24 months for the entire cohort, CCD cohort, and prospective cohort, respectively (supplemental Table 2).
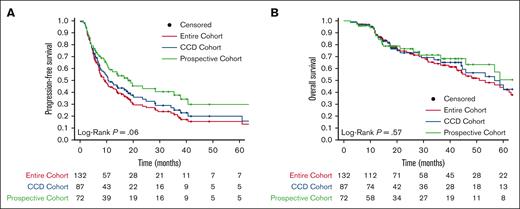
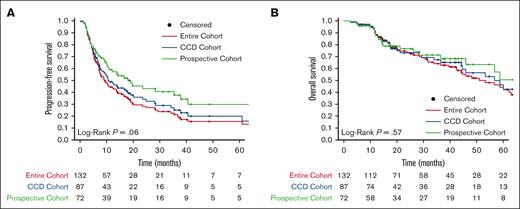
The median PFS was 9.4 months (95% confidence interval [CI], 7.3-13.9) for the entire cohort, 10.8 months (95% CI, 7.8-20.1) for the CCD cohort, and 19.1 months (95% CI, 10.8-40.7) for the prospective cohort. The 2-year PFS was 28% (95% CI, 21.0-38.0) for the entire cohort, 34% (95% CI, 25.0-47.0) for the CCD cohort, and 43% (95% CI, 32.0-58.0) for the prospective cohort. Compared with the entire cohort, the prospective cohort had a longer PFS (P = .02), but otherwise, PFS did not differ based on the cohort (Figure 3A; supplemental Table 2).
Kaplan-Meier survival curves for each cohort. (A) PFS and (B) OS of the entire cohort (red), CCD cohort (blue), and prospective cohort (green). The prospective cohort had superior PFS compared with the entire cohort (P = .02). There were no other significant differences in PFS or OS. Living patients were censored at time of last follow-up (filled circles). The number of patients at risk for each time point and cohort is shown.
Kaplan-Meier survival curves for each cohort. (A) PFS and (B) OS of the entire cohort (red), CCD cohort (blue), and prospective cohort (green). The prospective cohort had superior PFS compared with the entire cohort (P = .02). There were no other significant differences in PFS or OS. Living patients were censored at time of last follow-up (filled circles). The number of patients at risk for each time point and cohort is shown.
The median OS was 53.2 months (95% CI, 42.5-70.7) for the entire cohort, 56.7 months (95% CI, 44.6 to not reached [NR]) for the CCD cohort, and NR (95% CI, 45.9-NR) for the prospective cohort. The 2-year OS was 74% (95% CI, 66.0-82.0) for the entire cohort, 73% (95% CI, 63.0-84.0) for the CCD cohort, and 77% (95% CI, 66.0-88.0) for the prospective cohort (Figure 3B; supplemental Table 2). OS did not differ based on the cohort. PFS and OS did not differ based on the histology (supplemental Figure 1).
Clinical and genetic associations with survival
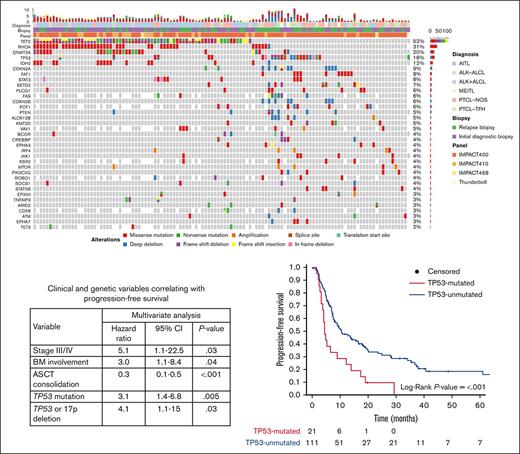
Factors affecting PFS in univariate analyses (Table 2) were examined in a multivariate analysis. For the 87 patients in the CCD cohort, the clinical parameters correlating with inferior PFS on multivariate analysis were advanced-stage disease (HR, 5.1; 95% CI, 1.1-22.5; P = .03) and BM involvement (HR, 3.0; 95% CI, 1.1-8.4; P = .04). Although higher IPI and PIT scores correlated with inferior PFS on univariate analysis, they lost significance upon multivariate analysis. No first-line treatment regimen correlated with PFS outcomes, but receipt of ASCT in first remission was associated with superior PFS (HR, 0.3; 95% CI, 0.1-0.5; P < .001). The only 2 genetic aberrancies correlating with inferior PFS on multivariate analysis were TP53 mutations (HR, 3.1; 95% CI, 1.4-6.8; P = .005) and TP53/17p deletions (HR, 4.1; 95% CI, 1.1-15.0; P = .03; Table 2).
Factors affecting the OS in univariate analyses (Table 3) were examined in a multivariate analysis. The only baseline clinical parameter correlating with inferior OS on multivariate analysis was an Eastern Cooperative Oncology Group performance status score of ≥2 (HR, 19.2; 95% CI, 2.8-133.0; P = .003). ASCT receipt during the first remission remained significant for a superior OS upon multivariate analysis (HR, 0.1; 95% CI, 0.04-0.4; P < .001). The only genetic aberrancy correlating with inferior OS was the presence of a CDKN2A deletion (HR, 12.1; 95% CI, 2.8-52.0; P < .001). In contrast to PFS, TP53 alterations did not correlate with inferior OS (Table 3).
Cohort-wide survival based on TP53 and CDKN2A status
Cases harboring either a TP53 mutation or a TP53/17p deletion in the CCD cohort correlated with inferior PFS on multivariate analysis. Therefore, we stratified the entire cohort based on the presence (16%; n = 21) or absence (84%; n = 111) of a TP53 mutation (with or without a TP53/17p deletion). Of the 21 cases with TP53 mutations, 15 (71%) did not have a concurrent TP53/17p deletion, and 6 (29%) had a concurrent TP53/17p deletion. Two cases (10%) had a concurrent CDKN2A deletion, 1 of which also had a concurrent TP53/17p deletion. A TP53/17p deletion without a concurrent TP53 mutation was found in only 3 cases (2%) of the entire cohort.
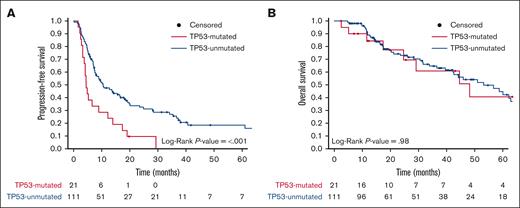
Among the entire cohort of PTCL, patients with TP53 mutations had inferior PFS, with a median PFS of 4.5 months (95% CI, 3.8-13.9) vs 10.5 months (95% CI, 7.8-18.1) for those without TP53 mutations (P < .001) (Figure 4A; supplemental Table 3). The 2-year PFS was 10% (95% CI, 3.0-36.0) in TP53-mutated PTCL and 32% (95% CI, 24.0-43.0) in TP53-unmutated PTCL (supplemental Table 3). All PFS events for patients with TP53-mutated PTCL were due to relapsed or refractory disease. In the prospective cohort, the median PFS was 4.1 months (95% CI, 2.8-NR) for patients with TP53-mutated PTCL vs 19.7 months (95% CI, 10.8-72.3) for those with TP53-unmutated PTCL (P = .02; supplemental Figure 2A; supplemental Table 4).
Kaplan-Meier survival curves for the entire cohort (N = 132) stratified based on the TP53 mutation status. (A) PFS and (B) OS of patients with (TP53-mutated; red) or without (TP53-unmutated; blue) PTCL. Data of living patients were censored at the time of last follow-up (filled circles). The number of patients at risk for each time point and cohort is shown.
Kaplan-Meier survival curves for the entire cohort (N = 132) stratified based on the TP53 mutation status. (A) PFS and (B) OS of patients with (TP53-mutated; red) or without (TP53-unmutated; blue) PTCL. Data of living patients were censored at the time of last follow-up (filled circles). The number of patients at risk for each time point and cohort is shown.
There were no significant differences in the OS of patients with TP53-mutated PTCL compared with that of those with TP53-unmutated PTCL in either the entire or prospective cohorts. For the entire cohort, the median OS of patients with TP53-mutated PTCL was 48.2 months (95% CI, 29.2-NR) vs 53.2 months (95% CI, 42.3-71) for those with TP53-umutated PTCL (Figure 4B; supplemental Table 3). In the prospective cohort, the median OS was NR (95% CI, NA-NA) for patients with TP53-mutated PTCL vs 58.7 months (95% CI, 45.9-NR) for those with TP53-unmutated PTCL (supplemental Figure 2B; supplemental Table 4).
CDKN2A deletions correlated with inferior OS upon multivariate analysis in the CCD cohort. Therefore, we compared the OS of the entire cohort with that of the prospective cohort based on the presence (7%; n = 9) or absence (93%; n = 123) of CDKN2A deletions. Of the 9 cases with a CDKN2A deletion, 2 (22%) had a concurrent TP53/17p deletion, and 2 (22%) had a concurrent TP53 mutation. For the entire cohort, CDKN2A-deleted PTCL correlated with an inferior OS, with a median of 17.6 months (95% CI, 12.8-NR) vs 56.7 months (95% CI, 44.6-101.0) for PTCL without CDKN2A deletions (P = .004; supplemental Figure 3B; supplemental Table 3). PFS trended but remained nonsignificant based on the presence or absence of CDKN2A deletions (supplemental Figure 3A; supplemental Table 3). There were only 4 cases (5%) with CDKN2A deletions in the prospective cohort (supplemental Table 4).
Consistent with prior reports, TP53 mutations (3%; n = 2) and CDKN2A deletions (n = 0) were rare in AITL.29 Therefore, we analyzed the survival rates of non-AITL PTCL (n = 70) based on the presence or absence of these alterations. Patients with TP53-mutated non-AITL PTCL experienced inferior PFS, with a median of 4.5 months (95% CI, 4.1-17.4) vs 7.8 months (95% CI, 7.1-20.1) for TP53-unmutated non-AITL PTCL (P = .02), with no difference in the OS (supplemental Figure 4; supplemental Table 5). Patients with non-AITL PTCL harboring CDKN2A deletions had inferior OS, with a median OS of 17.4 months (95% CI, 11.1-NR) for patients with CDKN2A deletions vs 48.2 months (95% CI, 42.5-NR) for those without such deletions (P = .004). There was no difference in the PFS based on the CDKN2A status (supplemental Figure 5; supplemental Table 5).
TP53/17p deletions were uncommon in the absence of a TP53 mutation (2%; n = 3). There were no differences in PFS when both TP53/17p deletion and TP53 mutation were present as compared with a TP53 mutation alone (supplemental Figure 6).
Characteristics of TP53-mutated PTCL
We then compared the characteristics and treatment outcomes for patients with TP53-mutated PTCL vs TP53-unmutated PTCL (Table 4). TP53 mutations were relatively enriched in PTCL-NOS (n = 10; P = .03) and relatively less frequent in AITL (n = 2; P < .001) compared with other histologies. There were no significant differences in age, disease stage, BM involvement, involvement of other extranodal sites, or IPI or PIT scores between patients with TP53-mutated and TP53-unmutated PTCL. There were also no differences in first-line treatment regimen or whether ASCT was received in first remission. There was a trend toward fewer CRs for patients with TP53-mutated PTCL (P = .053).
Similar proportions of patients with TP53-mutated and TP53-unmutated PTCL had sequencing performed using their initial diagnostic biopsy. TP53 mutations were more likely to cooccur with TP53 or 17p deletions (P < .001), whereas TET2 and RHOA mutations were enriched in patients with PTCL without TP53-mutations (P = .03 and P = .04, respectively). TET2 and TP53 mutations cooccurred in 6 cases. None of the 15 patients with an IDH2 mutation had a concurrent TP53 mutation. Cases with mutated TP53 had a higher median number of total aberrancies per sample (P = .008; Table 4).
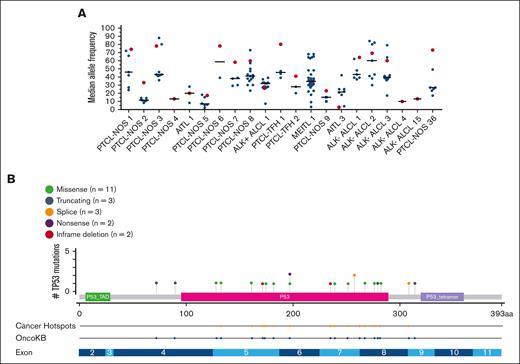
Lastly, for all cases of PTCL with a TP53 mutation (16%; n = 21), we compared the median variant allele frequency of the TP53 mutation to all other concurrent mutations within each patient’s biopsy (Figure 5A). TP53 mutations were the dominant mutation in 12 cases (57%), at or above the median of all mutations in 18 cases (86%). The majority of TP53 mutations involved the DNA binding domain (81%; n = 17) and were missense mutations (52%; n = 11; Figure 5B). All the TP53 mutations had been reported previously as a cancer hotspot mutation and/or are documented in the OncoKB database as being likely oncogenic.30,31
TP53 median variant allele frequencies (MAFs) and mutation specifics among PTCL cases with a TP53 mutation (n = 21). (A) MAF of TP53 mutations as compared with all other gene mutations in each tumor sample (n = 21). Each of these 21 patients’ biopsies are represented on the x-axis. Red symbols represent the MAF of the TP53 mutation. Black symbols represent the MAF of any non-TP53–mutated gene found in the same biopsy. The solid lines represent the median MAF of all mutations occurring in the biopsy sample. (B) Lollipop plot of TP53 mutations (n = 21). Each colored symbol represents a specific TP53 mutation along the entire coding region. The green boxed region represents the transactivation domain (P53_TAD). The red boxed region represents the DNA binding domain (P53). The blue boxed region represents the tetramerization domain (P53_tetramer). The next 2 rows signify that all mutations are listed in the OncoKB database as likely oncogenic, and 15 have been reported as cancer hotspot mutations. The bottom row illustrates the exon structure of the TP53 gene.
TP53 median variant allele frequencies (MAFs) and mutation specifics among PTCL cases with a TP53 mutation (n = 21). (A) MAF of TP53 mutations as compared with all other gene mutations in each tumor sample (n = 21). Each of these 21 patients’ biopsies are represented on the x-axis. Red symbols represent the MAF of the TP53 mutation. Black symbols represent the MAF of any non-TP53–mutated gene found in the same biopsy. The solid lines represent the median MAF of all mutations occurring in the biopsy sample. (B) Lollipop plot of TP53 mutations (n = 21). Each colored symbol represents a specific TP53 mutation along the entire coding region. The green boxed region represents the transactivation domain (P53_TAD). The red boxed region represents the DNA binding domain (P53). The blue boxed region represents the tetramerization domain (P53_tetramer). The next 2 rows signify that all mutations are listed in the OncoKB database as likely oncogenic, and 15 have been reported as cancer hotspot mutations. The bottom row illustrates the exon structure of the TP53 gene.
Discussion
To the best of our knowledge, these data represent the largest cohort of patients with PTCL treated with curative-intent chemotherapy to undergo targeted NGS of their tumors using a clinically validated sequencing panel. We centered on histologies treated with CHOP-based regimens with the option of ASCT consolidation, when eligible. Upon multivariate analysis in the CCD cohort, TP53 alterations were detected as the only genetic event that independently predicted inferior PFS; this result was observed in both the entire and prospective cohorts when stratified based on the presence or absence of a TP53 mutation. In addition, TP53-mutated PTCL showed a trend toward a lower frequency of CRs compared with TP53-unmutated PTCL, suggesting inherent chemoresistance in these cases. This is consistent with the observations of patients with TP53 alterations in other hematological malignancies in which TP53 alterations associate with inferior outcomes when treated with both curative- and noncurative-intent therapies.32-36
The TP53 mutations in our cohort were highly suggestive of a predominant clone based on the high allele frequency observed in all but 1 case. The relatively high prevalence of TP53 mutations in PTCL-NOS (28%) and ALK− ALCL (33%) in this series was similar to prior reports. For example, 2 independent publications on PTCL-NOS reported the presence of TP53 mutations in 28% and 19% of cases, respectively.18,19 In a recent large series of patients with systemic ALCL (N = 82), TP53 mutations occurred in 23% of ALK− and 11% of ALK+ ALCL cases, respectively, and correlated with inferior PFS and OS.16TP53 mutations in our series were rare in AITL (3%), consistent with prior reports.29 Based on previous observations, TP53 mutations occured in ∼17% to 40% of PTCL-TFH cases37,38 and 33% of MEITL cases.39 Overall, our data on the prevalence of TP53 mutations in PTCL are consistent with prior observations.
Interestingly, although patients with TP53 mutations experienced inferior PFS, they had no impact on OS. We hypothesized that this could have been attributed to the inclusion of multiple histologies, access to multiple novel clinical trials implementing non-cytotoxic therapies, and/or variability in eligibility for curative-intent allogeneic stem cell transplant. However, only 3 (10%) patients with TP53-mutated PTCL underwent curative-intent allo-SCT after CHOP-based progression, and all 3 relapsed. One of these patients achieved a second CR with duvelisib plus romidepsin, was consolidated with donor lymphocyte infusion, and has remains disease-free for >5 years.40 Nevertheless, despite the low number of patients with TP53-mutated PTCL who underwent a potentially curative allo-SCT, the median number of lines of therapy was 3 (range, 1-11), and 10 (48%) patients received ≥4 lines of therapy (data not shown). Moreover, 10 (48%) patients were treated on a least 1 clinical trial investigating novel therapies such as valemetostat, duvelisib, duvelisib plus romidepsin, ruxolitinib, or cerdulatinib; all of which have demonstrated relatively encouraging response rates and durability in a subset of patients.40-44 This suggests novel agents may provide meaningful outcomes for TP53-mutated PTCL. A dedicated analysis on the outcomes of relapsed or refractory TP53-mutated PTCL compared with non-TP53-mutated PTCL is needed to better understand this patient population and determine the best treatment strategies.
Multivariate analyses in the CCD cohort and the entire cohort indicated that patients with CDKN2A deletions experienced inferior OS when compared to patients who did not harbor such deletions. Using various methodologies for CNA detection combined with other published datasets, a recent study reported a high frequency (46%) of these deletions in PTCL-NOS and their significant association with inferior PFS and OS.15CDKN2A deletions were rare in our cohort (7% of entire cohort and 8% in PTCL-NOS), possibly restricted by the threshold of CNA detection through exome sequencing and the clinical reporting of MSK-IMPACT limiting definitive conclusions based on our data alone.
Limitations to this retrospective study include the small numbers of patients with certain histologic subsets, patients for whom data on baseline clinical characteristics were missing, lack of uniform treatment for patients, lack of complete PTCL-TFH immunohistochemical markers in older cases, and the limitations of MSK-IMPACT methodologies in detecting CNAs and other structural variations. There are also limitations with targeted exon sequencing and the threshold for calling chromosome arm-level deletions and copy-neutral loss of heterozygosity with MSK-IMPACT. Given these limitations, caution is advised when interpreting these data for first-line treatment modifications and should not reflexively institute deviations in the current standard of care including enrollment onto first-line clinical trials.
Despite some limitations, we found that 95% of patients (20 of 21) with TP53-mutated PTCL in our study had relapsed after, or were refractory to, curative-intent treatment with CHOP-based therapy. Other than TP53 mutations, as described in this manuscript and in others, additional genetic markers including GATA-3 expression, FAT1 mutations, and CDKN2A deletions in PTCL-NOS, CD28 mutations in AITL, and TP63 structural variations in ALK− ALCL have been previously reported as indicators of a poor prognosis.7,15,17,21,45 Whether TP53 aberrancies or other genetic events require an alternative approach to therapeutic induction and/or consolidative strategies will require further research on a larger cohort of patients who are uniformly treated.
Acknowledgments
Editorial support was provided by Katharine Olla Inoue and Clare Wilhelm at Memorial Sloan Kettering Cancer Center.
This work was supported in part by National Institutes of Health/National Cancer Institute grant P30 CA00878, the Leukemia and Lymphoma Society (7026-21), and the Nonna’s Garden Foundation.
Authorship
Contributions: W.T.J. designed the research study, collected the data, and wrote the manuscript; N. Ganesan performed the primary statistical analysis; Z.D.E.-P., A.J.M., and R.N.S. reviewed and assisted in the writing of the manuscript; C.R.M. collected the data; N. Galasso collected the data and assisted in the institutional review board submission process; T.C. collected the data; N.K. reviewed and assisted in the writing of the manuscript; U.A. reviewed the sequencing data, and reviewed and assisted in the writing of the manuscript; N.E.L. reviewed the pathology diagnoses; A.D.Z., M.L.P., M.J.M., A.N., A.M.H., P.H., P.C.C., D.J.S., A.M.I., C.L.B., A.K., C.N.O., C.S.S., L.F., J.K.L., S.A.V., and G.S. reviewed and assisted in the writing of the manuscript; A.D. reviewed the pathology diagnoses; N.D.S. assisted with data review from cBioPortal; M.E.A. reviewed the clinically reported genetic sequencing results; and S.M.H. provided oversight to the research study design and reviewed and assisted in writing the manuscript.
Conflict-of-interest disclosure: W.T.J. received consulting fees from Myeloid Therapeutics. A.J.M. received research support from ADC Therapeutics, BeiGene, Miragen, Seattle Genetics, Merck, Bristol Myers Squibb, Incyte, and SecuraBio, and received honoraria from Affimed, Imbrium Therapeutics LP/Purdue, Janpix Ltd, Merck, Seattle Genetics, and Takeda. N.K. received research support from Seattle Genetics. A.D.Z. received consulting fees from Genentech/Roche, Gilead, Celgene, Janssen, Amgen, Novartis, Adaptive Biotechnology, MorphoSys, AbbVie, AstraZeneca, and MEI Pharma; received research funding from MEI Pharmaceuticals, Genentech/Roche, BeiGene, and NIH/NCI SPORE in Lymphoma (P50 CA192937-06A1); and served in data monitoring committees for BeiGene (Chair) and Bristol Myers Squibb/Celgene/Juno. M.L.P. received advisory/consulting fees from Novartis, Synthekine, BeiGene, Kite, and MustangBio. M.J.M. received honoraria from Genentech, Roche, GlaxoSmithKline, Bayer, Pharmacyclics, Janssen, Seattle Genetics, Immunovaccine Technologies, Takeda, and Epizyme; received advisory/consulting fees from Genentech, Bayer, Merck, Juno Therapeutics, Roche, Teva, Rocket Medical, Seattle Genetics, Daiichi Sankyo, Takeda, and Epizyme; and received research funding from Genentech, Roche, GlaxoSmithKline, IGM Biosciences, Bayer, Pharmacyclics, Janssen, Rocket Medical, Seattle Genetics, and Immunovaccine Technologies. A.N. received research funding from Pharmacyclics/AbbVie, Kite/Gilead, and Cornerstone; received consulting fees from Janssen, Morphosys, Cornerstone, Epizyme, EUSA, TG therapeutics, ADC Therapeutics, and AstraZeneca; and received honoraria from Pharmacyclics/AbbVie. P.C.C. holds stock/stock options in Bristol Myers Squibb, Johnson & Johnson, Pfizer, AstraZeneca, GlaxoSmithKline, and Novartis. C.L.B. is employed by Genentech. A.K. received research funding from AbbVie Pharmaceuticals, Adaptive Biotechnologies, Celgene, Pharmacyclics, Seattle Genetics, AstraZeneca, and Loxo Oncology/Lilly, and served in an advisory role for Celgene, Genentech, Kite Pharmaceuticals, Loxo Oncology/Lilly, and AstraZeneca. C.S.S. provided consulting for Juno Therapeutics, Sanofi-Genzyme, Spectrum Pharmaceuticals, Novartis, Genmab, Precision Biosciences, Kite/Gilead, Celgene/Bristol Myers Squibb, Gamida Cell, Karyopharm Therapeutics, Ono Pharmaceuticals, MorphoSys, CSL Behring, Syncopation Life Sciences, CRISPR Therapeutics, and GlaxoSmithKline, and received research funding from Juno Therapeutics, Celgene/Bristol Myers Squibb, Precision Biosciences, Actinium Pharmaceuticals, and Sanofi-Genzyme. L.F. received research funding and consulting fees from Genmab, AbbVie, and Roche/Genentech; received honoraria from and served on advisory boards for ADC Therapeutics, Seattle Genetics, and AstraZeneca. J.K.L. received consulting fees from TG Therapeutics and Epizyme. S.A.V. served on advisory board for Immunai, and received consulting fees from ADC Therapeutics and Koch Disruptive Technologies. G.S. served on advisory boards for and received consulting fees from AbbVie, Bayer, BeiGene, Bristol Myers Squibb/Celgene, Epizyme, Genentech/Roche, Genmab, Incyte, Ipsen, Janssen, Kite/Gilead, Loxo, Miltenyi, Molecular Partners, MorphoSys, Nordic Nanovector, Novartis, Rapt, Regeneron, and Takeda, and owns shares in Owkin. A.D. provided consulting for Incyte, EUSA Pharma, and Loxo, and received research support from Roche and Takeda. S.M.H. received research funding from ADC Therapeutics, Affimed, Aileron, Celgene, CRISPR Therapeutics, Daiichi Sankyo, Forty Seven Inc, Kyowa Hakko Kirin, Millennium/Takeda, Seattle Genetics, Trillium Therapeutics, and Verastem/Secura Bio, and received consulting fees from Acrotech Biopharma, ADC Therapeutics, Astex, Auxilus Pharma, Merck, C4 Therapeutics, Celgene, Cimieo Therapeutics, Daiichi Sankyo, Janssen, Kura Oncology, Kyowa Hakko Kirin, Myeloid Therapeutics, ONO Pharmaceuticals, Seattle Genetics, Secura Bio, Shoreline Biosciences Inc, Takeda, Trillium Therapeutics, Tubulis, Verastem/Secura Bio, Vividion Therapeutics, and Yingli Pharma Ltd. The remaining authors declare no competing financial interests.
A.M.H. is a retired member of the faculty of Memorial Sloan Kettering Cancer Center, New York, NY.
The current affiliation for C.L.B. is Genentech, South San Francisco, CA.
Correspondence: William T. Johnson, Department of Medicine, Lymphoma Service, Memorial Sloan Kettering Cancer Center, 530 East 74th St, New York, NY 10021; e-mail: johnsow3@mskcc.org.
References
Author notes
Genetic data are available at the cBioPortal for Cancer Genomics at https://www.cbioportal.org/study/summary?id=mtnn_msk_2022.
Deidentified data that are not publicly accessible or included in this article or data supplement are available upon request from the corresponding author, William T. Johnson (johnsow3@mskcc.org).
The full-text version of this article contains a data supplement.

