Key Points
Nearly 95% of cfDNA is derived from hematopoietic tissue.
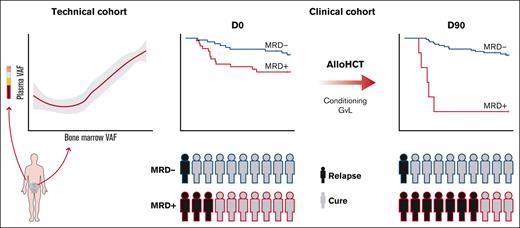
cfDNA MRD at D90 is an important predictor of post-alloHCT relapse.
Abstract
The measurable residual disease (MRD) assessment provides an attractive predictor of allogeneic hematopoietic cell transplnat (alloHCT) outcomes. Cell-free DNA (cfDNA) has been applied to diagnosis, early detection, and disease burden monitoring in various tumors, but its utility as an MRD test in myeloid malignancies has not been systematically evaluated. We sought to determine the differential sensitivity between bone marrow (BM) and cfDNA MRD and to assess the effect of cfDNA MRD on alloHCT outcomes. The technical and clinical validation cohorts, including 82 patients participating in clinical trials (Bone Marrow Transplant Clinical Trials Network-0201 and 0402), were used. Ultradeep error-corrected targeted sequencing was performed on plasma and BM-derived DNA. We demonstrated that 94.6% (range, 93.9-95.3) of cfDNA was derived from hematopoietic tissue. The mutant allele fraction was congruent between BM and cfDNA (rho = 0.8; P < .0001); however, cfDNA seemed to be more sensitive in detecting clones with a variant allele frequency (VAF) of <0.26%. cfDNA-MRD clearance by day 90 after alloHCT (D90) was associated with improved relapse-free survival (RFS, median survival not reached vs 5.5 months; P < .0001) and overall survival (OS, median survival not reached vs 7.3 months; P < .0001) when compared with patients with persistent MRD. Irrespective of pre-alloHCT MRD, D90 cfDNA MRD was associated with inferior 2-year OS (16.7% vs 84.8%; P < .0001) and RFS (16.7% vs 80.7%; P < .0001). cfDNA seems to be an accurate, minimally invasive alternative to BM aspirates in MRD assessment and confers important prognostic implications in patients with myeloid malignancies undergoing alloHCT.
Introduction
In the current era of less toxic and highly effective therapies, most patients with acute myeloid leukemia (AML) and myelodysplastic syndrome (MDS) achieve meaningful responses.1 Despite this remarkable progress, the cure rate remains low and can be attained only by allogeneic hematopoietic cell transplantation (alloHCT).2 Contemporary alloHCT approaches have greatly expanded the pool of available donors while substantially reducing transplant-related mortality. Accordingly, disease recurrence remains the main cause of post-alloHCT morbidity and mortality.3-5
The presence of certain somatic mutations and structural chromosomal abnormalities remains the most significant predictor of outcome after alloHCT for AML and MDS.6,7 In addition, the presence of measurable residual disease (MRD) at the time of complete remission (CR) is associated with an increased probability of relapse after alloHCT.8-10 Even though important prognostically, pretransplant MRD lacks sufficient precision, as nearly 30% of patients who are MRD negative eventually relapse after alloHCT.11 In contrast, MRD positivity after alloHCT seems to be a more accurate prognosticator of posttransplant relapse in both lymphoid and myeloid malignancies.12,13 Thus, the notion of dynamic MRD monitoring early after alloHCT seems to be an attractive strategy for early detection of impending relapse. To be suitable for frequent disease status assessment, the MRD test should be minimally invasive. Unfortunately, nearly all currently used MRD tests (both molecular and flow cytometric) rely on the detection of residual cancer cells in the tested specimen. Accordingly, a bone marrow (BM) aspirate has been recommended for the most accurate results,14 which considerably limits the ability to dynamically monitor MRD after remission and during consolidation therapies.
Circulating tumor DNA released from malignant cells can be reliably detected in patients’ plasma and has been widely used in diagnosis, early detection, and disease burden monitoring in several solid malignancies.15 Even though most cell-free DNA (cfDNA) is derived from hematopoietic tissue,16,17 the advantages of “liquid biopsy” have not been fully used in myeloid malignancies. Even though several studies have demonstrated cfDNA as an attractive substitute for intracellular DNA for molecular diagnostics and disease monitoring in myeloid malignancies,18 its utility as a surrogate for BM aspiration in MRD assessment has not been rigorously studied.
Here, we aimed to determine the value of minimally invasive cfDNA-based MRD monitoring in the early detection of impending posttransplant relapse. We sought to define the differential sensitivity between BM and cfDNA-based MRD using prospectively collected BM and plasma samples from patients with myeloid malignancies undergoing alloHCT. To evaluate the clinical utility of cfDNA-based MRD monitoring before and after alloHCT, we analyzed plasma samples from 2 prospective clinical trials (Bone Marrow Transplant Clinical Trials Network [BMT CTN] 0201 and 0402).
Methods
Patient selection and clinical data
The technical validation cohort included 20 patients diagnosed with hematologic malignancies who underwent alloHCT at the Johns Hopkins University on the clinical study NCT02556931/J15165 clinical trial “Shorter Course Tacrolimus After Nonmyeloablative, Related Donor PBSCT with High-Dose Posttransplant Cytoxan for Hard-to-Engraft Malignancies.” A total of 8 patients were diagnosed with myeloid malignancies and had at least 1 somatic single nucleotide variant or insertion/deletion (indel) at diagnosis. The concurrent plasma and BM aspirate samples were collected at diagnosis and remission before alloHCT as well as days 60, 90, and 180 after alloHCT.
Clinical data and plasma/serum samples from 2 prospective clinical trials (BM CTN 0201 and 0402) were obtained from the Biologic Specimen and Data Repository Information Coordinating Center and constituted our clinical validation cohort. BMT CTN 0201 compared alloHCT results between unrelated BM and peripheral blood as donor stem cell sources,19 and BMT CTN 0402 compared alloHCT results with sirolimus/tacrolimus vs tacrolimus/methotrexate as graft-versus-host disease (GvHD) prophylaxis after matched, related alloHCT.20 The following inclusion criteria were used: (1) enrollment in BMT CTN 0201 or BMT CTN 0402 with clinical data available for download, (2) the presence of myeloid malignancy, and (3) a minimum of 1 mL of serum or plasma available from baseline/pre-alloHCT visit and at the post-alloHCT visit at days 90 to 100. A total of 144 patients met the inclusion criteria. A sufficient amount of cfDNA from 2 time points was available from 82 patients.
Clinical outcomes included relapse-free survival (RFS) and overall survival (OS). RFS was defined as the time from transplant to the time of disease progression (as defined previously by the 2 trials) or death, whichever came first. OS was defined as the time from transplant to the time of death. The cumulative incidence of relapse (CIR) was defined as the time from transplant to the time of disease progression (as defined previously by the 2 trials). Nonrelapse mortality (NRM) was defined as the time from transplant to the time of death that was not preceded by disease progression. For RFS, OS, and CIR, patients who did not achieve the respective event were right censored at 2 years after alloHCT or when lost to follow-up, whichever came first. For NRM, patients were right censored at the time of disease progression, or if neither the event of interest nor progression occurred, the patients were right censored at 2 years after alloHCT or when lost to follow-up, whichever came first. The study was approved by the Johns Hopkins Institutional Review Board and conducted according to the Declaration of Helsinki.
Sequencing
cfDNA was extracted from serum or plasma samples using the QIAamp Circulating Nucleic Acid Kit (Qiagen, Germantown, MD), according to the manufacturer’s protocol. DNA concentration was assessed using the Qubit fluorometer (Thermo Fisher Scientific, Waltham, MA). The sequencing library preparation was performed using the xGen Prism DNA Library prep kit (IDT, Coralville, IA) and Kapa Roche (Wilmington, MA) reagents. Hybrid capture and targeted panel enrichment were performed using Integrated DNA Technologies (Coralville, IA) xGen probe chemistry, using dual index for sample barcoding and a 10-basepair single unique molecular identifier (UMI) as a read barcode. Our custom-targeted panel included 49 genes most frequently mutated in myeloid malignancies (supplemental Table 1). The hybridized products were then sequenced using the NOVASeq 6000 platform (paired-end technology; Illumina, San Diego, CA).
Variant calling and unique molecular identifier (UMI)–aware deduplication
Raw sequencing data were demultiplexed using manufacturer-supplied software (bcl2fastq2), in which FASTQ read data were trimmed and tagged with the molecular barcode sequence. The resulting FASTQ read sequences were then aligned to hg19 (GRCH37.p13) reference using the Burrows-Wheeler Aligner (BWA-MEM, 0.7.17).21 The aligned reads were coordinate sorted, indexed, and marked with PCR duplicates using Picard tools (https://broadinstitute.github.io/picard/) (v2.18.26), and corresponding UMI tags were used to group read data into individual molecular families using the latest version (version 16) of an in-house UMI family construction algorithm (unpublished data). Briefly, the sequencing reads represented by the same UMI tag and sharing the same alignment start and stop sites were defined as a unique UMI family. A minimum of 2 such reads were required to construct a read family. A UMI family–based variant allele frequency (%UMIF-VAF) was then derived at each variant site using the number of UMI families aggregated for a variant allele divided by the sum of the number of families aggregated for the reference allele and variant allele. The percent UMIF-VAF was then used to carry out further variant call filtering and quantitative correlations.
NGS variant filtering
For the variants resulting from the UMI pipeline, we applied the following filters: (1) filtered out the mutations that were observed at any level in blank or in a pool of normal samples; (2) the strand bias filter; (3) variants in COSMIC v95 hg19 filtered for “confirmed somatic mutation,” pathogenic FATHMM prediction for single nucleotide variants, nonsynonymous variants observed in hematopoietic neoplasms (excluding mast cell neoplasms or acute lymphoblastic leukemia); and (4) variants predicted to be “pathogenic” according to the American College of Medical Genetics and Genomics.22 In the technical cohort, variants present in at least 5 family consensus reads were considered positive. Because the diagnostic molecular profiles were not available for the clinical validation cohort, we applied more stringent variant calling and filtering criteria to ensure high specificity. We considered variants to be positive if they were present at day 0 (D0) and had a VAF > 0.5% and a minimum of 15 family consensus reads supporting the variant. Patients were deemed MRD positive at D90 if the variant present at D0 was detected at any level on D90.
Statistical analysis
Statistical analysis was performed using R 4.1.0. Categorical variables were represented as an absolute value (percent). The normality of the distribution was assessed using Shapiro-Wilk test, histogram visualization, and skewness and kurtosis assessment. All the assessed continuous variables were non-normally distributed and were represented as medians (quartile 1, quartile 3). The correlation between 2 non-normally distributed continuous variables was assessed using Spearman rho. Univariate survival analysis was performed using a univariate Cox proportional hazards model. A multivariable survival analysis was performed using a multivariable Cox proportional hazards model. A P value of <.05 was considered statistically significant.
Results
Clinical characteristics of the technical cohort
The technical validation cohort consisted of 8 consecutive patients with myeloid malignancy (4 AML, 1 MDS, and 3 MDS/MPN overlap syndrome). All patients underwent nonmyeloablative haploidentical alloHCT with mobilized peripheral blood and posttransplant cyclophosphamide as GvHD prophylaxis (Table 1). Overall, 24 plasma and 19 BM samples were collected at multiple time points (remission before alloHCT, D60-D90, and D180 after alloHCT).
The contribution of hematopoietic tissue to cfDNA
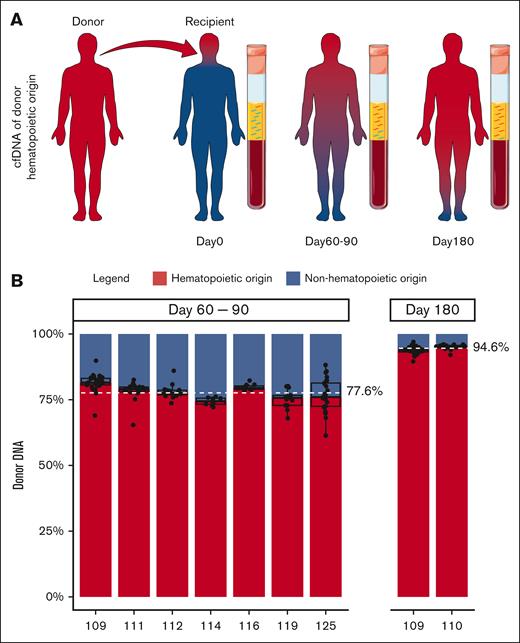
To accurately determine the fraction of cfDNA derived from hematopoietic tissue, we examined cfDNA obtained from transplant recipients at D90 and D180 after successful engraftment (full donor chimerism) and with no evidence of disease relapse. Because the entire hematopoietic system should be of donor origin in fully engrafted transplant recipients, the contribution of hematopoietic (donor-derived) and nonhematopoietic (recipient-derived) tissues to cfDNA could be precisely enumerated by studying donor- and recipient-specific single nucleotide polymorphisms in cfDNA (Figure 1A). At the time of early engraftment (days 60-90), 77.6% (range, 74.4%-81.5%) of cfDNA was of donor hematopoietic origin. After 6 months, 94.6% (range, 93.9%-95.3%) of cfDNA was derived from donor hematopoietic tissue (Figure 1B). These results suggest that under homeostasis, most of the circulating cfDNA is of hematopoietic origin. Thus, plasma seemed to be a promising tissue for MRD assessment in hematologic malignancies.
The contribution of hematopoietic and nonhematopoietic tissues to cfDNA. (A) Schematic of the contribution of donor and recipient tissue to cfDNA after alloHCT. Red and blue depict donor and recipient tissues, respectively. In the recipient, the entire hematopoietic tissue is donor derived (red). CfDNA at different time points after alloHCT is shown. cfDNA from hematopoietic tissue is red, and nonhematopoietic tissue is blue. Relative amount of cfDNA from hematopoietic cells (donor-derived) at D60 to D90 and D180 after alloHCT is shown. Servier Medical Art, provided by Servier, was used to generate Figure 1A.
The contribution of hematopoietic and nonhematopoietic tissues to cfDNA. (A) Schematic of the contribution of donor and recipient tissue to cfDNA after alloHCT. Red and blue depict donor and recipient tissues, respectively. In the recipient, the entire hematopoietic tissue is donor derived (red). CfDNA at different time points after alloHCT is shown. cfDNA from hematopoietic tissue is red, and nonhematopoietic tissue is blue. Relative amount of cfDNA from hematopoietic cells (donor-derived) at D60 to D90 and D180 after alloHCT is shown. Servier Medical Art, provided by Servier, was used to generate Figure 1A.
Comparison of mutant allele frequency in the BM and cfDNA
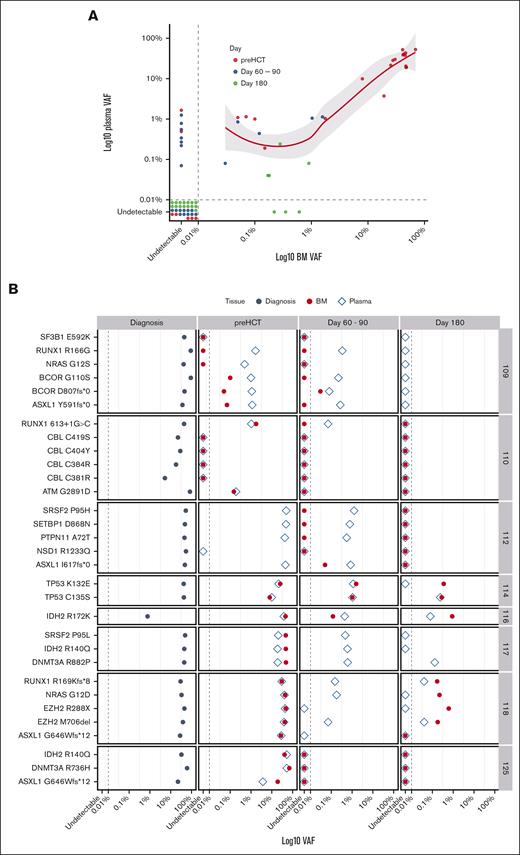
To determine the utility of cfDNA in MRD assessment, the leukemia-specific variants in concurrent cfDNA and BM samples from the technical validation cohort were analyzed during postinduction remission and at multiple time points after alloHCT. Thirty-one leukemia-specific somatic mutations were found at diagnosis (supplemental Table 2). The limit of detection of somatic mutations was 0.04% in cfDNA and 0.03% in BM. Of 31 mutations seen in BM at any time point, only 3 (9.7%) were not detected in cfDNA (Figure 2A-B). On the contrary, of 37 mutations found in cfDNA, 9 (25%) were not seen in BM. Although a strong positive correlation at any level of MRD between BM and cfDNA was observed (rho = 0.8; P < .0001), cfDNA seemed to be more sensitive at the lower MRD level (VAF < 0.26%; Figure 2A). At the time of CR before alloHCT, 21 of 26 mutations (80.8%) present at diagnosis were detected by both BM and cfDNA analysis. Although all of them were present in cfDNA, 2 of 21 (9.5%) were not detected in the BM. From D60 to D90, concurrent BM and cfDNA samples were available from 6 patients (23 variants). Twelve of 23 variants (52.2%) were present in either BM and/or cfDNA. Although all of them were detected in cfDNA, only 5 (41.7%) were seen in concurrent BM samples. At day 180, 7 of 22 variants (31.8%) were detected: 5 (22.7%) by cfDNA and BM and only 3 (13.6%) by BM alone. cfDNA-MRD analysis missed 3 variants in 2 patients (Figure 2A-B). At the patient level, all 8 patients were MRD positive by either BM or cfDNA at the time of CR before alloHCT. At D60 to D90 or D180 after alloHCT, BM-based MRD assessment would classify 1 patient as MRD negative when, in fact, leukemia-specific variants were present in cfDNA. Of note, multiparameter flow cytometry performed in 6 patients at D60 to D90 showed no phenotypically abnormal populations in BM aspirates. Thus, cfDNA-based MRD assessment seems to be noninferior to the BM-based method and may be more sensitive in detecting low-frequency clones with VAF < 0.26%.
The differential sensitivity of BM and cfDNA-based variant detection. (A) Correlation between VAF of leukemia-specific somatic mutations in BM and cfDNA is shown. The data points represent individual variants. The variants detected before alloHCT (red) and D60 to D90 (blue) and D180 (green) are shown. The dashed line represents the limit of detection. (B) The leukemia-specific mutations at diagnosis, D60 to D90, and D180 after alloHCT are shown for individual patients. The dashed line marks the limit of detection. VAF is presented on a logarithmic scale.
The differential sensitivity of BM and cfDNA-based variant detection. (A) Correlation between VAF of leukemia-specific somatic mutations in BM and cfDNA is shown. The data points represent individual variants. The variants detected before alloHCT (red) and D60 to D90 (blue) and D180 (green) are shown. The dashed line represents the limit of detection. (B) The leukemia-specific mutations at diagnosis, D60 to D90, and D180 after alloHCT are shown for individual patients. The dashed line marks the limit of detection. VAF is presented on a logarithmic scale.
Clinical characteristics of the clinical validation cohort
To examine the clinical utility of cfDNA-based MRD in predicting transplant outcomes, we analyzed plasma/serum specimens from 82 patients enrolled in 2 prospective BMT CTN clinical trials: 0201 (18 patients) and 0402 (64 patients).19,20 The median age was 45 years (33-50). The pre-alloHCT diagnoses included AML (65), MDS (14), and MDS//MPN overlap syndrome (3). Nearly all patients (79 of 82) received myeloablative conditioning (Table 1).
Molecular characteristics of MRD before HCT and D90.
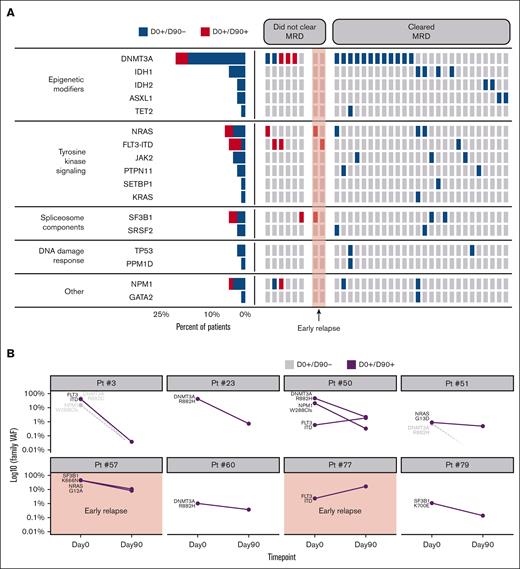
To identify MRD present at the time of remission (D0), we used a mutation-agnostic analytical approach because the diagnostic molecular data were not available. Thus, to minimize the rate of false-positive results, we included only known pathogenic variants with a VAF > 0.5% and at least 15 UMI-based consensus reads supporting the variant (supplemental Table 3). This approach identified 34 of 82 patients (46.2%) as MRD positive before alloHCT. The median VAF was 20.74% (range, 0.59-46.71). Mutations in epigenetic modifiers, tyrosine kinase signaling, spliceosome factors, and NPM1 were most common (Figure 3A). Two patients with detectable MRD before alloHCT relapsed within 90 days. Thirty-two patients remained in morphological remission at D90, and 26 of 32 (81.2%) cleared their MRD (Figure 3A). In 6 patients who did not clear the MRD by D90, the mutational burden of individual variants decreased by a median of 21.21% (range, 0.41-47.15). FLT3-ITD was the most common mutation that persisted by D90 in 3 of 4 patients (75%), followed by NRAS in 2 of 5 patients (40%). In 2 cases (patient #3 and #51), alloHCT resulted in the eradication of some clones (DNMT3A and NPM1), whereas resistant clones carrying FLT3-ITD and NRAS mutations persisted beyond D90 and eventually resulted in disease relapse (Figure 3B).
Genomic features and clonal dynamics in MRD-positive patients before alloHCT. (A) Leukemia-specific mutations found before alloHCT are grouped based on the function of the corresponding gene. The columns represent individual patients. They are grouped based on the clearance of MRD by D90. The red highlight marks 2 patients who were MRD positive who relapsed before D90. (B) Clonal dynamics in patients who did not clear MRD by D90. Clones harboring mutations in gray were not detected on D90 (D0+D90–). The graph with red highlights represents patients who relapsed by D90. VAF is presented on a logarithmic scale.
Genomic features and clonal dynamics in MRD-positive patients before alloHCT. (A) Leukemia-specific mutations found before alloHCT are grouped based on the function of the corresponding gene. The columns represent individual patients. They are grouped based on the clearance of MRD by D90. The red highlight marks 2 patients who were MRD positive who relapsed before D90. (B) Clonal dynamics in patients who did not clear MRD by D90. Clones harboring mutations in gray were not detected on D90 (D0+D90–). The graph with red highlights represents patients who relapsed by D90. VAF is presented on a logarithmic scale.
MRD clearance by D90 and clinical outcomes
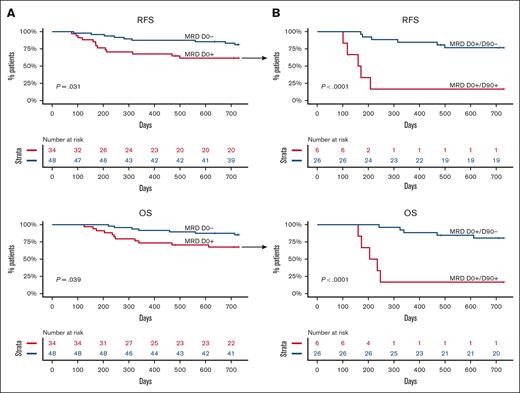
We first sought to corroborate the detrimental effect of pre-alloHCT MRD on RFS and OS in this cohort. As expected, the presence of MRD at D0 was associated with significantly worse RFS (P = .031) and OS (P = .039). Neither group reached a median survival (Figure 4A). The inferior RFS was mainly due to a higher CIR (hazard ratio [HR] 3.16 [1.03-9.7]; P = .044) rather than transplant-related mortality (supplemental Figure 1). Because DNMT3A, TET2, and ASXL1 (DTA) mutations frequently indicate the presence of antecedent clonal hematopoiesis, the effect of non-DTA MRD on survival was also analyzed. Non-DTA MRD at D0 was no longer associated with adverse outcomes (supplemental Figure 2).
RFS and OS according to MRD status at D0 and MRD clearance by D90. (A) Unadjusted RFS and OS according to MRD status before alloHCT (D0). (B) Unadjusted RFS and OS in patients who were MRD positive before alloHCT according to MRD clearance at D90.
RFS and OS according to MRD status at D0 and MRD clearance by D90. (A) Unadjusted RFS and OS according to MRD status before alloHCT (D0). (B) Unadjusted RFS and OS in patients who were MRD positive before alloHCT according to MRD clearance at D90.
Even though statistically significant, pre-alloHCT MRD was not a robust determinant of the outcome, perhaps because it did not consider the therapeutic effect of the cytotoxic conditioning regimen and graft vs leukemia activity mediated by the donor immune system. Hence, we examined the effect of MRD clearance by D90 on outcomes. Three patients who relapsed before D90 were excluded from the analysis. In 79 patients with detectable mutations before alloHCT, MRD clearance by day 90 was associated with a significant improvement in RFS (median survival not reached vs 5.5 months; P <.0001) and OS (median survival not reached vs 7.3 months; P < .0001) when compared with patients who did not clear the MRD (Figure 4B). In the multivariable model adjusting for age and remission status, MRD at D0 was no longer a statistically significant predictor of outcome, whereas MRD clearance by D90 remained a statistically significant favorable prognostic factor for RFS and OS (supplemental Figure 3A-B). The data suggest that MRD clearance by D90 is a better predictor of post-alloHCT outcome than pre-alloHCT MRD.
The presence of MRD at D90 and clinical outcomes
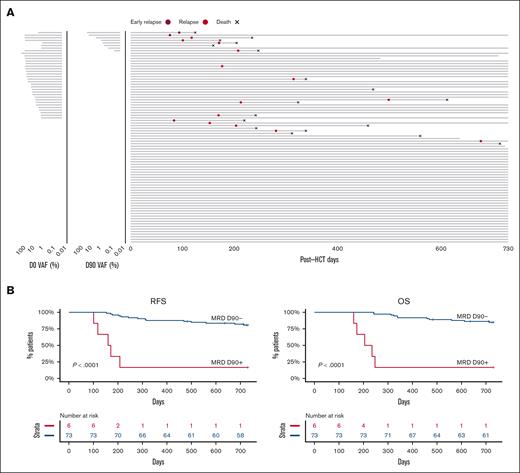
Next, we sought to determine the effect of D90 MRD, regardless of pre-alloHCT MRD status. Of 82 patients, 3 relapsed before D90 (2 were MRD positive and 1 was MRD negative at D0) and were excluded from the analysis (Figure 5A). MRD positivity at D90 was associated with significantly worse 2-year RFS compared with patients with MRD negativity (16.7% vs 80.7%; P < .0001; Figure 5B). Similarly, patients with MRD at D90 had significantly worse 2-year OS (16.7% vs 84.8%; P < .0001; Figure 5B). Multivariable analysis that included age and remission status before alloHCT demonstrated that MRD at D90 was independently associated with worse RFS (HR 10.91 [3.60-33.0]; P < .001) and OS (HR 14.11 [4.52-44]; P < .001; supplemental Figure 3C). The inferior OS and RFS were due to higher CIR (HR 11.9 [3.31-42.7]; P < .001; supplemental Figure 4).
RFS and OS according to MRD status at D90. (A) Swimmer plot depicting the time from D0 to relapse, death, or end of follow-up. The MRD status and levels at D0 and D90 for individual patients are shown (left panel). (B) Unadjusted RFS and OS according to MRD status at D90.
RFS and OS according to MRD status at D90. (A) Swimmer plot depicting the time from D0 to relapse, death, or end of follow-up. The MRD status and levels at D0 and D90 for individual patients are shown (left panel). (B) Unadjusted RFS and OS according to MRD status at D90.
Discussion
Our data corroborated the results from previously published studies demonstrating the utility of cfDNA in diagnostic molecular assessment and disease monitoring in AML and MDS.23-28 At diagnosis, the disease burden in cfDNA measured as VAF of individual mutations closely matched the disease burden in the BM. Interestingly, our data showed that at the MRD level, cfDNA might be more sensitive than BM, particularly in patients with a very low disease burden (VAF < 0.26%). There are several potential reasons for our finding.29 Because genomic DNA is mostly released into circulation as a result of apoptosis, necrosis, and active secretion, relatively more tumor-derived DNA may be obtained from plasma than from intact residual leukemic cells in the BM. Unlike at diagnosis, when leukemic blasts are evenly distributed in the intramedullary space, patchy infiltration by residual leukemic cells was observed during remission and after alloHCT.30 In addition, extramedullary relapses are relatively common. Unlike leukemic cells in the BM, tumor DNA is evenly distributed in circulating plasma regardless of the localization of the cells from which it was derived. Finally, the BM is often inaspirable in patients with significant marrow fibrosis. In such cases, cfDNA seems to be a suitable alternative.
In addition to its ostensible technical advantages, cfDNA-based MRD assessment does not require an invasive procedure. Because high-quality first-pull BM aspirates are currently recommended for both molecular and immunophenotypic assessment of MRD,14 cfDNA offers a minimally invasive and cost-effective approach. Even though the level of detection of MRD by the multiparametric flow cytometry assay is often inadequate in myeloid malignancies, it may be favored over molecular approaches in selected patients. For example, in patients treated with differentiation therapies, mutational burden may remain stable or increase despite successful restoration of hematopoietic differentiation and significant blast reduction.
Several previous studies have also shown the practicality and clinical utility of molecular MRD monitoring by measuring the presence of leukemia-specific mutations in cfDNA. However, most studies used variant-specific ddPCR as an analytical tool.31 This approach, although useful as a research tool, has several limitations that may preclude broad clinical application. Because ddPCR assays require a specific design and validation for individual variants, their clinical utility is limited mainly to hot-spot mutation detection. Unfortunately, most somatic alterations in myeloid malignancies are loss-of-function mutations that often spread across the gene. Thus, sequencing approaches focused on genes or gene regions rather than individual variants are more versatile and can be easily performed in most molecular laboratories.32 Our results indicated that cfDNA-based molecular MRD assessment using a targeted panel and error-corrected sequencing is an accurate predictor of post-alloHCT relapse.
Pre-alloHCT MRD assessment is clinically useful and may influence clinical decision making in terms of conditioning regimen and stem cell source to maximize alloHCT efficacy, but it is not a very accurate determinant of post-alloHCT outcome.9,33 The MRD assessment at D90 seems to be a superior prognosticator of post-alloHCT outcome. This is likely because pretransplant MRD assessment does not consider the antileukemic effects of the conditioning regimen and the donor’s immune system. Our data demonstrated that the presence of MRD in cfDNA at D90 after alloHCT was associated with a nearly 80% relapse rate at 1 year, compared with around 20% in MRD-negative groups. This translated to nearly 85% 2-year survival in the MRD-negative group compared with 16.7% in the MRD-positive group. Even though we observed that D90 MRD was an accurate predictor of outcome, it is possible that the most optimal timing of MRD assessment might depend on the transplant platform, stem cell source, and duration of GvHD prophylaxis. Hence, the timing of MRD may need to be further optimized for various alloHCT strategies.
Using the alloHCT platform, we precisely measured the direct contribution of donor-derived hematopoiesis to circulating cfDNA. We established that during homeostasis, ∼95% of cfDNA is derived from hematopoietic tissue. Several prior studies addressed the tissue of origin of cfDNA indirectly by examining the tissue-specific epigenetic signatures. Methylation analysis of cfDNA demonstrated that ∼85% of cfDNA was of hematopoietic origin, mostly from myeloid cells.16,34,35 Similarly, nucleosome spacing, which directly correlates with epigenetic features of individual tissues and influences cfDNA characteristics, indicated that the majority of cfDNA in healthy individuals was derived from hematopoietic cells.17,36 The first direct measure of the hematopoietic tissue contribution to cfDNA using the percentage of Y chromosome in cfDNA of sex-mismatched alloHCT recipients demonstrated that nearly all cfDNA was of hematopoietic origin.37
We recognize several potential limitations of our study. First, because of plasma availability, the study was limited to a relatively small cohort of patients. Second, because the plasma was not collected solely for cfDNA assay in the clinical validation cohort, the volume as well as collection methods were not optimized for cfDNA assessment. Thus, the sensitivity and limit of detection of cfDNA MRD can potentially be improved by optimizing the quantity of plasma and the preservation of cfDNA.
Overall, our results demonstrate the clinical utility of post-alloHCT cfDNA-MRD assessment and provide a useful and minimally invasive tool that can be easily incorporated into the risk stratification schema in patients after alloHCT. The dynamic assessment of MRD by cfDNA may also guide the therapeutic decision making and timely implementation of post-alloHCT maintenance therapies to improve the outcomes of patients with myeloid malignancies.
Acknowledgments
This work was supported by the National Institutes of Health, National Heart, Lung and Blood Institute grants R21HL143096 (L.P.G.) and R01HL156144 (L.P.G.).
Authorship
Contribution: S.W., S.P., M.Z.G., K.S., and A.S. collected and prepared biospecimens and collected and annotated clinical data; S.W. and C.S. performed targeted next-generation sequencing; S.P., A.P., and R.P. processed, analyzed, and interpreted sequencing data; S.P., M.Z.G., A.E.D., R.J.J., C.D.G., and L.P.G. analyzed and interpreted clinical data and wrote and edited the manuscript; and all authors critically reviewed the manuscript and approved the final version.
Conflict-of-interest disclosure: The authors declare no competing financial interests.
Correspondence: Lukasz P. Gondek, Johns Hopkins University School of Medicine, Sidney Kimmel Comprehensive Cancer Center, 1650 Orleans St CRB1-290, Baltimore, MD 21287; e-mail: lgondek1@jhmi.edu.
References
Author notes
Data are available on request from the corresponding author, Lukasz P. Gondek (lgondek1@jhmi.edu).
The full-text version of this article contains a data supplement.

