Key Points
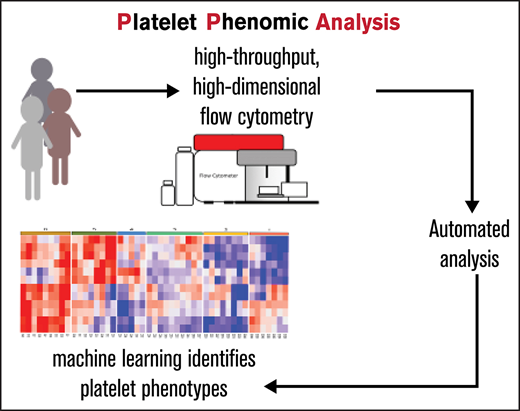
PPAnalysis is a new framework for generating high-dimensional descriptions of platelet function.
Using PPAnalysis, we identified 6 distinct platelet phenotypes that can aid investigation of platelet function in relation to disease.

Abstract
Accurate and comprehensive assessment of platelet function across cohorts of donors may be key to understanding the risk of thrombotic events associated with cardiovascular disease, and, hence, to help personalize the application of antiplatelet drugs. However, platelet function tests can be difficult to perform and analyze; they also can be unreliable or uninformative and poorly standardized across studies. The Platelet Phenomic Analysis (PPAnalysis) assay and associated open-source software platform were developed in response to these challenges. PPAnalysis utilizes preprepared freeze-dried microtiter plates to provide a detailed characterization of platelet function. The automated analysis of the high-dimensional data enables the identification of subpopulations of donors with distinct platelet function phenotypes. Using this approach, we identified that the sensitivity of a donor’s platelets to an agonist and their capacity to generate a functional response are distinct independent metrics of platelet reactivity. Hierarchical clustering of these metrics identified 6 subgroups with distinct platelet phenotypes within healthy cohorts, indicating that platelet reactivity does not fit into the traditional simple categories of “high” and “low” responders. These platelet phenotypes were found to exist in 2 independent cohorts of healthy donors and were stable on recall. PPAnalysis is a powerful tool for stratification of cohorts on the basis of platelet reactivity that will enable investigation of the causes and consequences of differences in platelet function and drive progress toward precision medicine.
Introduction
Platelet function testing has been an important aspect of cardiovascular research, diagnostics, and investigation of platelet biology since the invention of Born aggregometry in the 1960s.1 Platelets are central to the pathology of cardiovascular disease (CVD), forming thrombi that occlude blood vessels and, hence, cause major adverse cardiovascular events, such as myocardial infarction and ischemic stroke. Platelet function tests measure the propensity of platelets to perform functions that are central to hemostasis and thrombosis, such as the formation of aggregates, activation of integrin αIIbβ3, or the secretion of dense and α granules. These responses can be triggered by multiple stimuli, such as collagen, adenosine 5′-diphosphate (ADP), and thrombin to which platelets are exposed following vascular damage. There is a large degree of heterogeneity in the way in which platelets respond to these stimuli,2-4 but it is not fully understood why these differences exist and whether they should be taken into account clinically. To understand the importance of differences in platelet function, they must first be characterized and defined using comprehensive standardized tests. Only in this way can even basic questions regarding the relative degree of heterogeneity in responses to different platelet agonists, such as the extent to which an individual might be hyperresponsive to 1 agonist but hyporesponsive to another, be answered.
We have developed and validated the Platelet Phenomic Analysis (PPAnalysis) platform to simplify and standardize assessment of platelet function. The platform is designed to assess platelet function across cohorts of donors recruited and assessed at multiple sites, where reproducibility and consistency are paramount. As such, it utilizes minimal specialist equipment, preprepared freeze-dried assay plates, and bespoke software that eases the analysis of the high-dimensional data. To aid implementation of the assay, step-by-step instructions are included in supplemental Sections 1 through 3; all data, software, and outputs are available for download.
Unlike other tests of platelet function, PPAnalysis utilizes multiple agonists over a wide range of concentrations to pharmacologically characterize the full range of platelet reactivity. To validate PPAnalysis we tested 2 cohorts of healthy donors at separate study sites. We investigated sources of variance within the data and, in particular, whether sensitivity to an agonist and the magnitude of the functional response to this agonist (capacity) were independent metrics of platelet reactivity. Using sensitivity and response capacity, we performed hierarchical clustering to identify subpopulations with distinct platelet-reactivity phenotypes. Our aim is to provide a validated assay and analysis platform to facilitate future studies of clinical and nonclinical cohorts that can evaluate the interplay among CVD, risk factors, and platelet function.
Methods and materials
Details about materials and reagents and step-by-step instructions for PPAnalysis are included in supplemental Sections 1, 2, and 3, respectively. Although we have endeavored to provide as much information as possible to implement PPAnalysis, adaptation for alternative equipment may be necessary; we welcome questions, comments, and suggestions for improvement of these protocols.
Blood donation and cohorts
The study was carried out in accordance with the Declaration of Helsinki. Recruitment of healthy fasted nonsmoking donors aged 30 to 65 years and free from drugs known to influence platelet function for cohort 1 was approved by the University of Reading Research Ethics Committee. Recruitment of nonfasted donors aged 18 to 75 years (cohort 2) was approved by the Cambridge East Research Ethics Committee.
Platelet function assay
The flow cytometry assay measured fluorescein isothiocyanate–conjugated anti-fibrinogen antibody and PE-Cy5–conjugated anti–P-selectin antibody binding following stimulation with ADP (0.03-30 µM), collagen-related peptide (CRP; 0.003-3 µg/mL), epinephrine (0.1-30 µM), thrombin receptor activator peptide 6 (TRAP-6; 0.05-15 µM), and U46619 (0.3-100 µM) using an Accuri C6 (BD, Winnersh, UK) for cohort 1 and a Beckman-Coulter EPICS Profile XL for cohort 2, as described in supplemental Section 2.
Data analysis
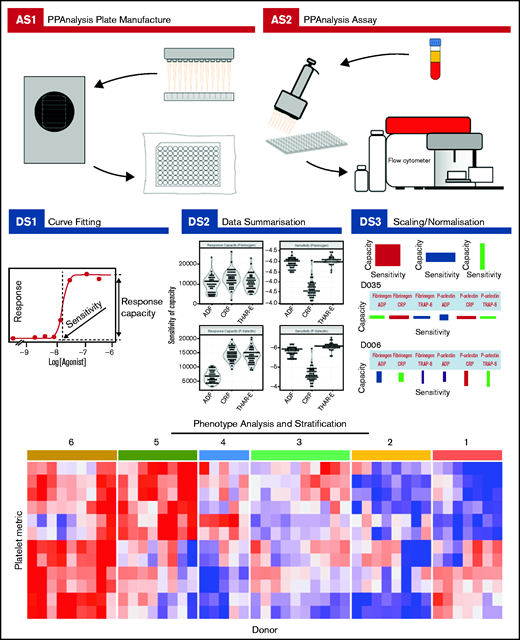
Complete details about how to download the PPAnalysis software and analyze the data are given in supplemental Section 2. PPAnalysis software analyzes data in 3 steps (Figure 1):

PPAnalysis workflow. A summary of PPAnalysis assay steps (AS) and data steps (DS). AS1, PPAnalysis plate is prepared, freeze-dried, and vacuum sealed. AS2, Flow cytometry assay is performed using platelet-rich plasma. DS1, Concentration-response curves are fitted to data, and sensitivity and response capacity metrics are collected. DS2, Data are summarized. DS3, Data are normalized, and barcodes are produced. Postanalysis hierarchical clustering and PCA are used to identify platelet function phenotypes. The heat map depicts platelet metrics in the rows and individual donor responses in the columns (red indicates high; blue indicates low). Numbers above the heat map correspond to the phenotypic groups identified by clustering.
PPAnalysis workflow. A summary of PPAnalysis assay steps (AS) and data steps (DS). AS1, PPAnalysis plate is prepared, freeze-dried, and vacuum sealed. AS2, Flow cytometry assay is performed using platelet-rich plasma. DS1, Concentration-response curves are fitted to data, and sensitivity and response capacity metrics are collected. DS2, Data are summarized. DS3, Data are normalized, and barcodes are produced. Postanalysis hierarchical clustering and PCA are used to identify platelet function phenotypes. The heat map depicts platelet metrics in the rows and individual donor responses in the columns (red indicates high; blue indicates low). Numbers above the heat map correspond to the phenotypic groups identified by clustering.
Data step 1 (DS1): processes the raw data, fitting concentration-response curves. Data that fail to have a curve fitted or are out of a predefined range are marked as “Dirty.” A series of visualizations detailing the data, the fitted curve, and any reasons for a Dirty status are provided together with a summary file that details metrics for all donors.
DS2: provides a range of summary visualizations that depict population-level variation, correlations, assay consistency and donors that lie out of normal population range (outliers).
DS3: normalizes and scales data. A donor barcode is provided that visually summarizes each donor’s response.
The availability of the software, data, and analysis outputs generated from cohort 1 allows future users of the assay to trial and test the software, which is modularized to allow easy adaptation and adjustments, such as alternative plate designs (wellData.txt), filename formats (filenameSplit.R), or modification of rules for the identification of dirty data (dirtyCheck.R).
Once processed, the variability in the data was investigated using Principal Component Analysis (PCA) and then clustered using the R hclust function (stats package) with distance measure Manhattan and agglomeration method Ward.D2. The heat map visualizing the clustering was plotted using the ComplexHeatmap function (Bioconductor). The stability of donor and variable subgroups was tested using PVclust, which utilizes a multiple bootstrap resampling algorithm to calculate the approximately unbiased probability values for cluster distinctiveness. All details about PCA and clustering are provided in R notebooks (NotebookPCA.Rmd and NotebookClusterAnalysis.Rmd, respectively); these offer a template that can be adapted for users to carry out their own analysis.
Results
PPAnalysis comprises a flow cytometry–based assay and bespoke software that was developed to make data analysis simple, rapid, and reproducible. The assay (Figure 1) uses assay plates containing concentration ranges of ADP, CRP, epinephrine, TRAP-6, and U46619, simultaneously measuring 2 aspects of platelet activation, fibrinogen binding (a marker of αIIbβ3 activation) and the exposure of P-selectin on the platelet surface (a marker of α-granule secretion). The plates can be easily reconfigured to include alternative types and concentrations of agonists and functional end points.
PPAnalysis: assessment of platelet function
PPAnalysis (Figure 1) was initially performed on platelet-rich plasma from 50 fasted healthy donors (cohort 1). The software analyzes the data in 3 simple steps (depicted in Figure 1 as DS1-3), taking ∼10 minutes to generate results for cohort 1 on a standard laptop computer. The measurement of platelet responses evoked by such a wide range of agonist concentrations allows the software to fit a Hill curve to data, characterizing the concentration-response relationship and enabling the extraction of multiple parameters that summarize platelet reactivity (examples given in Figure 2A). Two key parameters are the difference between baseline and maximal response and the concentration needed to achieve half of this response (Figure 2B). We refer to these properties as capacity of response and sensitivity, to differentiate these metrics from efficacy and potency (50% effective concentration [EC50]), which are commonly used to refer to the pharmacological properties of agonists.
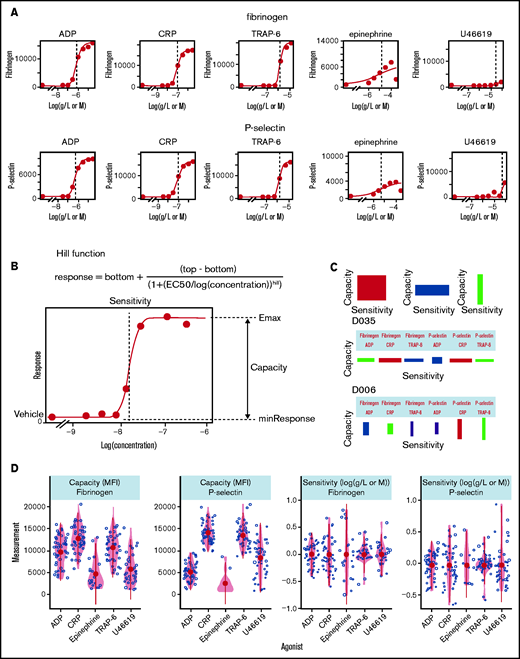
Characterization of platelet function with PPAnalysis. (A) Examples of concentration-response curves fitted to the data in DS1. Errors in the fitting process are marked “Dirty” (eg, fibrinogen response to epinephrine). (B) Diagram depicting how the summary statistics sensitivity and capacity are extracted from concentration-response curves fitted to data via the Hill function. (C) Examples of donor barcodes that capture a donor’s relative sensitivity and capacity and are produced in data step 3 (DS3). D035 is a donor with high sensitivity to agonists but low capacity, whereas donor D006 has platelets with low sensitivity but a higher capacity, particularly P-selectin exposure in response to CRP and TRAP-6. (D) Variability in measures of capacity and sensitivity for fibrinogen binding and P-selectin exposure in response to the 5 agonists. Outputs from DS1, DS2, and DS3 for all donors are available in the code and data download.
Characterization of platelet function with PPAnalysis. (A) Examples of concentration-response curves fitted to the data in DS1. Errors in the fitting process are marked “Dirty” (eg, fibrinogen response to epinephrine). (B) Diagram depicting how the summary statistics sensitivity and capacity are extracted from concentration-response curves fitted to data via the Hill function. (C) Examples of donor barcodes that capture a donor’s relative sensitivity and capacity and are produced in data step 3 (DS3). D035 is a donor with high sensitivity to agonists but low capacity, whereas donor D006 has platelets with low sensitivity but a higher capacity, particularly P-selectin exposure in response to CRP and TRAP-6. (D) Variability in measures of capacity and sensitivity for fibrinogen binding and P-selectin exposure in response to the 5 agonists. Outputs from DS1, DS2, and DS3 for all donors are available in the code and data download.
The software allows an unbiased, reproducible, and open assessment of the quality of the experimental data with predefined rules that identify failures to fit concentration-response curves and extremes in data. DS1 generated valid concentration-response curves for the majority of donors (47 sufficient responses for fibrinogen; 50 sufficient responses for P-selectin) in response to ADP, CRP, and TRAP-6, but responses stimulated by epinephrine and U46619 were frequently insufficient to enable curve fitting (epinephrine, 28 insufficient fibrinogen binding and 38 insufficient P-selectin exposure responses; U44619, 12 insufficient fibrinogen binding and 6 insufficient P-selectin exposure responses) (see supplemental Table 2 for details).
DS2 generates publication-ready figures that summarize the cohort response, describing variability, distributions, and correlations, and aid quality assessment. These are provided in the data download; an example plot of all metrics against collection date that enables quality control monitoring and assessment of “drift” caused by reagent deterioration or “steps” caused by changes in reagent batches is given in supplemental Figure 9, whereas Figure 2 (additional details in supplemental Table 3) demonstrates the variability in capacity and sensitivity. We observed that the capacity to generate P-selectin exposure and fibrinogen binding is highest in response to the agonists CRP (median, P-selectin, 14, 482; fibrinogen, 12, 614 mean fluorescence intensity [MFI]) and TRAP-6 (median P-selectin, 12, 239; fibrinogen, 10, 688 MFI), whereas it is lower in response to ADP (median P-selectin, 6, 721; fibrinogen 9, 951 MFI). Response capacity for epinephrine, when present, was consistently low and skewed toward the lower end of the range, with a large number of low responders. Response capacity for U46619 was highly variable and could exceed the capacity of ADP in some donors. The level of variability in sensitivity for fibrinogen binding and P-selectin exposure was different for each of the agonists, with sensitivity to TRAP-6 displaying the least variability [fibrinogen interquartile range, −6.07 to −5.93 log(M); P-selectin interquartile range, −6.13 to −5.73 log(M)] and sensitivity to CRP displaying the greatest [fibrinogen interquartile range, −7.52 to −7.12 log(g/L); P-selectin interquartile range, −7.53 to −7.17 log(g/L)]. Because of the high number of insufficient responses recorded for the agonists U46619 and epinephrine, their metrics were excluded from further analysis.
The third step in the analysis (DS3) normalizes and scales the data to generate a graphical representation of a donor’s platelet functional response that we call a barcode (Figure 2C). Each rectangle on the barcode represents the relative sensitivity and capacity of a donor’s platelets to the 3 agonists and 2 outputs. The width of the rectangle represents the relative sensitivity of the response (a wide rectangle depicts sensitive platelets), and the height of the rectangle represents the relative capacity of the response.
The precision of the assay, when repeated on the same day, was assessed by taking blood samples from 4 donors and repeating the assay 6 times, on 2 different plate batches (3 tests on each plate batch; supplemental Figure 10; supplemental Table 5). We also assessed the precision of the assay when measurements were taken on different days by taking blood samples from 5 donors on 4 separate days within 1 month (supplemental Figure 11). Interquartile ranges of these technical replicates were compared against those measured across the entire population. We found that variability in both groups of technical replicates for sensitivity were an order of magnitude smaller than for the whole population (supplemental Figures 10 and 11). Variability in capacity measurements were greater for both groups but small relative to interindividual variability.
In summary, PPAnalysis simplifies and makes easier a standardized reproducible assessment of a high-dimensional description of platelet function.
Sensitivity and capacity are distinct characteristics of platelet function
Large-scale studies of platelet function often involve measuring responses to 1 or relatively few3,4 concentrations of agonist and, therefore, cannot fully differentiate sensitivity of platelets from their capacity. In effect, they conflate sensitivity and capacity into a single hybrid reactivity metric. Routine tests of platelet function using light transmission aggregometry (LTA) commonly use a range of agonist concentrations, but standardization is poor and analysis generally does not routinely include estimation of parameters analogous to sensitivity and capacity. Studies that use low-dimensional approaches have classified donors and patients as having low or high platelet reactivity. Characterization of the complete concentration-response curve allowed us to identify that sensitivity to an agonist does not predict capacity of response. Sensitivity and capacity for fibrinogen binding or P-selectin exposure evoked by the agonist panel (Figure 3A) do not correlate (|r| ≤ 0.38; P > .01), indicating independence (supplemental Figures 12 and 13).
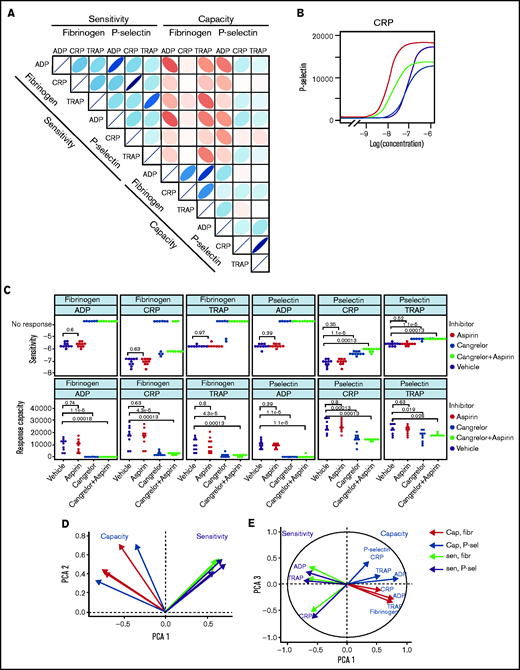
Patterns of variability in cohort 1. (A) Correlation matrix summarizing patterns between the 12 measures of platelet function and the sensitivity and capacity of fibrinogen and P-selectin to the agonists ADP, CRP, and TRAP-6. The area, shape, and color of the ellipses correspond to Spearman’s correlation coefficient. Colors indicate Spearman’s correlation coefficient values ranging from −1 (dark red) to +1 (dark blue). The ellipse shape indicates the relative spread of data points and the slope of the correlation, with a wider ellipse indicating a greater relative spread and a narrower ellipse indicating a lower spread (numerical values for Spearman correlation coefficients are given in supplemental Figure S12. (B) Examples of concentration-response curves for 4 donors. The curves depicted in red and magenta have capacity and sensitivity that correlate (high and low, respectively), whereas response curves in blue and gray do not follow this pattern and have high sensitivity but low capacity and vice versa. All curves are for P-selectin in response to CRP. (C) Effects of platelet inhibitors (100 µM aspirin, 1 µM cangrelor, or both) on responses to ADP, CRP, and TRAP-6. Data are generated from the responses of 10 blood donors. (D-E) Results of the PCA (scree plot is provided in supplemental Figure 18). The biplots show vectors representing each variable on a plane where the angle between the vectors is informative; vectors closer together suggest dependence, whereas those that are orthogonal suggest a lack of independence in the variables. (D) Biplot of PC1 and PC2. (E) PCA biplot of PC1 (x-axis) and PC3 (y-axis). In both biplots, colored arrows represent the contribution of each variable to the PC; arrows representing measures of sensitivity are shown in red, and arrows representing measures of capacity shown in blue.
Patterns of variability in cohort 1. (A) Correlation matrix summarizing patterns between the 12 measures of platelet function and the sensitivity and capacity of fibrinogen and P-selectin to the agonists ADP, CRP, and TRAP-6. The area, shape, and color of the ellipses correspond to Spearman’s correlation coefficient. Colors indicate Spearman’s correlation coefficient values ranging from −1 (dark red) to +1 (dark blue). The ellipse shape indicates the relative spread of data points and the slope of the correlation, with a wider ellipse indicating a greater relative spread and a narrower ellipse indicating a lower spread (numerical values for Spearman correlation coefficients are given in supplemental Figure S12. (B) Examples of concentration-response curves for 4 donors. The curves depicted in red and magenta have capacity and sensitivity that correlate (high and low, respectively), whereas response curves in blue and gray do not follow this pattern and have high sensitivity but low capacity and vice versa. All curves are for P-selectin in response to CRP. (C) Effects of platelet inhibitors (100 µM aspirin, 1 µM cangrelor, or both) on responses to ADP, CRP, and TRAP-6. Data are generated from the responses of 10 blood donors. (D-E) Results of the PCA (scree plot is provided in supplemental Figure 18). The biplots show vectors representing each variable on a plane where the angle between the vectors is informative; vectors closer together suggest dependence, whereas those that are orthogonal suggest a lack of independence in the variables. (D) Biplot of PC1 and PC2. (E) PCA biplot of PC1 (x-axis) and PC3 (y-axis). In both biplots, colored arrows represent the contribution of each variable to the PC; arrows representing measures of sensitivity are shown in red, and arrows representing measures of capacity shown in blue.
Figure 3B presents representative concentration-response curves demonstrating all 4 possible combinations of high or low sensitivity and capacity for P-selectin exposure evoked by CRP. Although the measures of sensitivity and capacity did not correlate, there are indications of other patterns in responses. The sensitivity of fibrinogen binding and P-selectin exposure to individual agonists correlate (|r| > 0.91; P < .01) to a greater degree than does the capacity to generate these responses (|r| < 0.76; P < .01). There are also correlations between sensitivity to different agonists, with sensitivity to ADP and TRAP-6 being particularly strongly correlated (fibrinogen, r = 0.78; P < .01; P-selectin, r = 0.76; P < .01). Correlations between responses mediated by ADP and other agonists may be due to the release of ADP from platelets following agonist stimulation, which stimulates P2Y receptors and contributes to activation. We investigated the contribution of secreted ADP and thromboxane A2 (TxA2) by pretreating platelet-rich plasma with the P2Y12 antagonist cangrelor and COX1 inhibitor aspirin (which prevents de novo synthesis of TxA2) (Figure 3C). Fibrinogen binding capacity for CRP and TRAP-6 was ablated in almost all cases following treatment with cangrelor, indicating that integrin activation, and, hence, fibrinogen binding, is dependent on secreted ADP. P-selectin exposure capacity and sensitivity were reduced by treatment with cangrelor (P < .05), indicating a partial dependence on secreted ADP to trigger α-granule release stimulated by CRP and TRAP-6. These results suggest that PPAnalysis may be a useful tool for assessment of residual platelet reactivity during treatment with P2Y12 antagonists. Estimates of sensitivity and capacity were critical to identifying residual platelet reactivity following treatment with cangrelor, because assessment with only single concentrations of agonist failed to identify residual P-selectin exposure following stimulation with CRP or TRAP-6 (supplemental Figure 14). Dependence on TxA2 release was less pronounced, with no significant effect on sensitivity and capacity for CRP or TRAP-6 (P > .05).
Platelet count and mean platelet volume can influence functional measurements, but we found that only ADP response metrics correlated significantly with platelet count and mean platelet volume (P < .05; supplemental Figures 15 and 16), and this accounts for a low proportion of total variability (|r| < 0.44). We also investigated the influence of individual donor characteristics on functional measurements and found that body mass index (BMI), age, and sex did not correlate significantly within the cohort (supplemental Figure 17). Lack of significant correlations should be interpreted with caution as a result of the limited age range (30-65 years) and low numbers of overweight and obese individuals within this cohort of healthy donors.
We anticipated that some platelet function parameters might be highly correlated, whereas others would be independent markers of platelet function. We used PCA, a dimension-reduction technique that summarizes the relationships between variables into “PCs” to distinguish between parameters that are dependent and independent platelet function metrics. The analysis revealed that the majority (85%; supplemental Figure 18) of variation within the entire data set was captured by 3 PCs (Figure 3D-E). PC1 captures the overall response, grading donors from generally low through to generally high responders. PC2 differentiates between the metrics sensitivity and capacity. When PC1 is plotted against PC2, measures of sensitivity and capacity are distinct (Figure 3D), confirming the results from the correlation matrix that sensitivity and capacity are independent measures of platelet function. PC3 (Figure 3E) highlights further structure within the data, hinted at above, with the capacity metrics dividing into those for P-selectin exposure and fibrinogen binding, whereas sensitivity divides by agonist. This indicates that capacity could be inferred from the response to any single agonist, suggesting that this metric could be dependent upon common features, such as integrin expression levels, granule numbers, or expression of cellular signaling machinery. However, the sensitivity is distinct for each agonist; therefore, it is necessary to test a range of agonists.
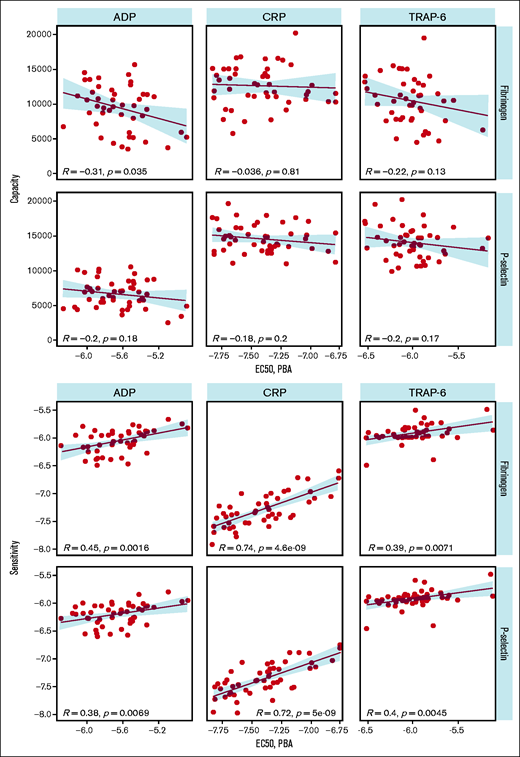
We compared PPAnalysis outputs with results from the Optimul plate-based LTA test performed on the same samples to provide a comparison with an established platelet function test. Optimul is sensitive to mild and severe platelet function disorders.5 We found that sensitivity measured using PPAnalysis correlated with the EC50 identified by LTA for each agonist, indicating that this metric corresponds well with results from a standard method (Figure 4). However, capacity did not correlate with EC50, suggesting that this metric corresponds to a feature of platelet function that is not identified by standard methods.

Comparison of plate-based aggregarion (PBA) EC50 with capacity (upper panels) and sensitivity (lower panels).
Comparison of plate-based aggregarion (PBA) EC50 with capacity (upper panels) and sensitivity (lower panels).
Identification of platelet phenotypes
To discover whether distinctive platelet function phenotypes exist in healthy populations, the data from cohort 1 were clustered using an agglomerative hierarchical algorithm that groups individuals together on the basis of similarity. The columns of the resulting heat map (Figure 5A) represent the 12 variables describing platelet function, and the rows represent the individual donor responses. The dendrogram above the heat map divides the metrics of sensitivity and capacity. It then divides capacity into the 2 functional measures of P-selectin exposure and fibrinogen binding and then by agonist. However, sensitivity is divided first by agonist and then by functional measure. Taken together, this indicates that sensitivity and capacity are distinct independent measures of platelet function. Capacity to generate functional responses of fibrinogen binding and P-selectin exposure are independent of each other, but the sensitivity to each agonist in generating these responses is similar (eg, the sensitivity to ADP is similar when measuring fibrinogen binding or P-selectin exposure). However, the sensitivity to each agonist is distinct (eg, an individual that is highly sensitivity to ADP may not be sensitive to CRP).

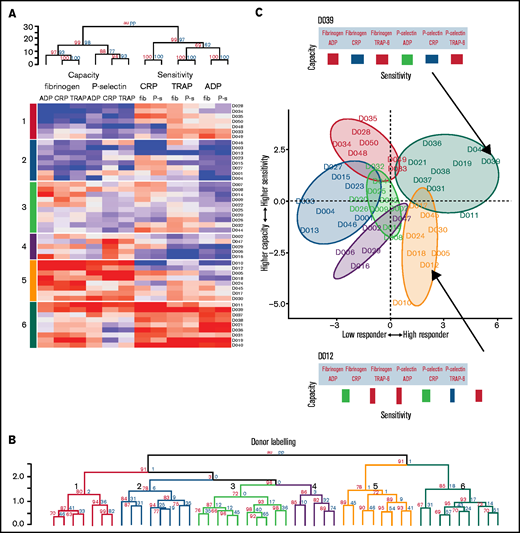
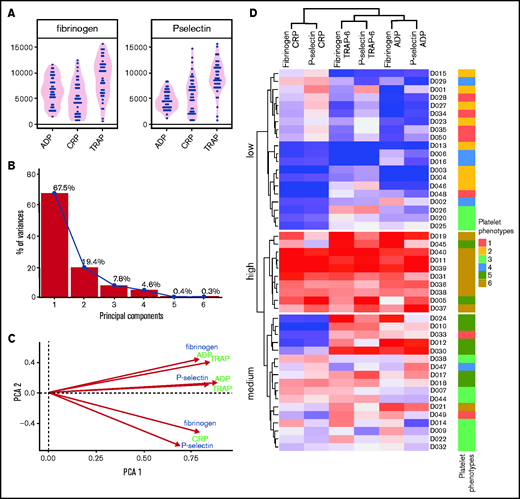
Platelet function phenotypes. (A) Heat map resulting from hierarchical clustering of data from cohort 1. Each column represents a response variable, and each row represents a donor. Red cells represent higher responses, and blue cells represent lower responses. (B) Rows are clustered into subgroups. Dendrograms, columns, and rows are assessed by bootstrapping randomizations (Pvclust; n = 10 000). Approximately unbiased > 90 indicates stable clusters. (C) Donors are placed on the plane of the first 2 PCs to highlight subgroup characteristics. The x-axis goes from low responders on the left through to high responders on the right. The y-axis progresses from those donors who have a higher capacity than sensitivity at the bottom through to those with a higher sensitivity than capacity at the top. Subgroups 6 and 5 contain donors that are high responders. Subgroup 6 has donors that have a higher sensitivity than capacity, whereas donors in subgroup 5 have a greater capacity of response than they are sensitive to agonists. Subgroups 4, 3, 2, and 1 are lower responders. Group 3 contains general medium responders and group 2 contains lower responders, whereas group 1 contains donors with a greater sensitivity than capacity, and group 4 are low responders with a greater capacity than sensitivity. Barcodes (displayed for donors D039 and D012) summarize individual donor characteristics.
Platelet function phenotypes. (A) Heat map resulting from hierarchical clustering of data from cohort 1. Each column represents a response variable, and each row represents a donor. Red cells represent higher responses, and blue cells represent lower responses. (B) Rows are clustered into subgroups. Dendrograms, columns, and rows are assessed by bootstrapping randomizations (Pvclust; n = 10 000). Approximately unbiased > 90 indicates stable clusters. (C) Donors are placed on the plane of the first 2 PCs to highlight subgroup characteristics. The x-axis goes from low responders on the left through to high responders on the right. The y-axis progresses from those donors who have a higher capacity than sensitivity at the bottom through to those with a higher sensitivity than capacity at the top. Subgroups 6 and 5 contain donors that are high responders. Subgroup 6 has donors that have a higher sensitivity than capacity, whereas donors in subgroup 5 have a greater capacity of response than they are sensitive to agonists. Subgroups 4, 3, 2, and 1 are lower responders. Group 3 contains general medium responders and group 2 contains lower responders, whereas group 1 contains donors with a greater sensitivity than capacity, and group 4 are low responders with a greater capacity than sensitivity. Barcodes (displayed for donors D039 and D012) summarize individual donor characteristics.
The rows in the heat map depict individual donor responses that have been clustered into stable subgroups with similar patterns of sensitivity and capacity (demonstrated in the dendrogram; Figure 5B); colors indicate subgroups (also placed to the left of the heat map). To visualize the separation of donors into distinct phenotypic groups, donors were placed on the plane of the first 2 PCs (PC1 and PC2) identified in Figure 3 (Figure 5C). The x-axis (PC1) distinguishes between low and high responders, whereas the y-axis (PC2) separates donors with a greater capacity than sensitivity (at the bottom) from those with a greater sensitivity than capacity (top). The algorithm identifies 3 groups with matching levels of high (group 6), medium (group 3), and low (group 2) sensitivity and capacity, which could fit into the traditional paradigm of low, medium, and high platelet reactivity. However, 3 more complex groups are also identified; groups with high capacity and medium sensitivity (group 5), medium capacity and low sensitivity (group 4), and low capacity and high sensitivity (group 1). By clustering the data we revealed groups of donors with distinct platelet phenotypes that are more complex than defining donors as simply low or high responders.
To understand differences from previous studies that used single concentrations of an agonist to assess platelet function, the data were reduced to an optimal single concentration of each agonist (Figure 6). PCA highlights the reduced dimensionality of these data, needing just 2 PCs to capture most (87%) of the variability: the first accounts for the majority of this (68%) and grades donors from low to high responders. The remaining structure in the data differentiates by agonist in a similar manner to sensitivity (Figure 3E). Clustering allowed donors to be separated into 3 subgroups of low, medium, and high responders. These groups were compared with the donor subgroups identified by PPAnalysis (side annotation on heat map; Figure 6). There is general agreement in the ability of the 2 approaches to grade donors from low through to high responders; however, donors predominantly identified by PPAnalysis as having a high capacity and lower sensitivity (PPAnalysis Group 5) are misclassified by single concentration analysis, with 6 of the 8 donors shifted from high responders to medium responders.

Platelet function in response to a single concentration of agonists. Analysis of a single concentration of agonist selected retrospectively to provide optimal capture of variation responses in 50 donors from cohort 1. (A) Variation in fibrinogen binding and P-selectin exposure responses. (B) PCA scree plot demonstrating percentage variability captured by each PC; 85% variability is captured in just 2 PCs. (C) Biplot of first 2 PCs. (D) Heat map resulting from hierarchical clustering response to single concentrations of agonist. Each column represents a response variable, and each row represents a donor. Red cells represent high responders, and blue cells represent low responders. Donors are clustered into 3 groups: high, medium, and low responders. Annotations on the right side indicate the original clusters identified in the main text (Figure 4) that use the sensitivity and capacity metrics, for comparison.
Platelet function in response to a single concentration of agonists. Analysis of a single concentration of agonist selected retrospectively to provide optimal capture of variation responses in 50 donors from cohort 1. (A) Variation in fibrinogen binding and P-selectin exposure responses. (B) PCA scree plot demonstrating percentage variability captured by each PC; 85% variability is captured in just 2 PCs. (C) Biplot of first 2 PCs. (D) Heat map resulting from hierarchical clustering response to single concentrations of agonist. Each column represents a response variable, and each row represents a donor. Red cells represent high responders, and blue cells represent low responders. Donors are clustered into 3 groups: high, medium, and low responders. Annotations on the right side indicate the original clusters identified in the main text (Figure 4) that use the sensitivity and capacity metrics, for comparison.
These results demonstrate that PPAnalysis facilitates stratification of donors using sensitivity and capacity to identify multiple distinct phenotypes rather than just “low” and “high” reactivity groups.
Platelet phenotypes are replicated in a second cohort of donors
To evaluate whether the platelet function phenotypes identified are present in other healthy cohorts, a second cohort of donors (cohort 2) was recruited at a second study center. Recruitment criteria for cohort 2 were broadened to include nonfasted donors with a greater age range (18-75 years); despite these changes being likely to increase variation, PCA of the data revealed similar patterns of variability (Figure 7) to cohort 1. The majority of the variability was still captured in 3 PCs that again differentiate donors by low to high responses, followed by sensitivity and capacity.

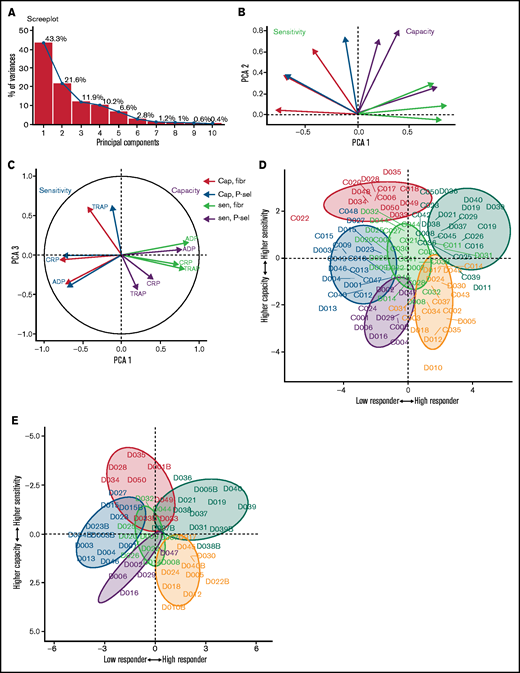
Patterns of variability in a second cohort of donors. (A) Scree plot demonstrating how much variability is captured by each PC. The first 3 PCs (PC1-3) capture 76% of the variability. (B) Biplot of PC1 and PC2. Measures of sensitivity (red) are distinct from capacity (blue). (C) Biplot of PC1 and PC3. (D) Donors from cohort 1 (prefix D) and cohort 2 (prefix C) shown on the plane of the first 2 PCs. Color code as in Figure 5. (E) Cohort 1 donors at original assessment and at recall (denoted by suffix B) displayed on the plane of the first 2 PCs.
Patterns of variability in a second cohort of donors. (A) Scree plot demonstrating how much variability is captured by each PC. The first 3 PCs (PC1-3) capture 76% of the variability. (B) Biplot of PC1 and PC2. Measures of sensitivity (red) are distinct from capacity (blue). (C) Biplot of PC1 and PC3. (D) Donors from cohort 1 (prefix D) and cohort 2 (prefix C) shown on the plane of the first 2 PCs. Color code as in Figure 5. (E) Cohort 1 donors at original assessment and at recall (denoted by suffix B) displayed on the plane of the first 2 PCs.
Combining the data generated for both cohorts demonstrated that donors from cohort 2 can be placed into the subgroups identified previously (Figure 7D). Donors from cohort 2 populated all 6 platelet function subgroups, including groups with high capacity and low sensitivity and vice versa. This validates the platelet phenotypes identified previously, while also demonstrating that PPAnalysis allows cohorts recruited at different sites to be combined.
Platelet phenotypes are stable over time
High variability in platelet function between individuals2-4 reflects genuine heterogeneity. Previous studies of variation in platelet function have demonstrated consistency in their responses over periods ranging from weeks to months, with greater changes in function occurring over longer periods.6,7 To assess the short-term stability of platelet phenotypes identified by PPAnalysis, 5 donors (D1-5) were assessed on 4 occasions over a period of 1 month. To assess long-term stability, 14 donors from cohort 1 were recalled and retested 18 to 24 months after the original assessment.
Results from the 5 donors recruited to assess short-term variability were combined with results from cohort 1 and assigned phenotypes; this was repeated for each day of reassessment. All 5 donors were consistently classified into the same phenotypic group at each of the 4 assessments (supplemental Figure 19). Results from the donors recalled to assess long-term stability were combined with the data from the original assessment before reclustering. Sixty-eight percent (9/14) of the recalled donors were classified into the same groups as during the original visit (Figure 7E). Twenty-one percent of the donors shifted to the nearest neighboring groups and retained the general classification of high or low responders. Only 14% of the donors (2/14) moved to entirely distinct groups: 1 from the medium-responder group to the high-responder group and 1 from the high-responder group to the low-responder group.
Taken together, these results indicate that PPAnalysis is sufficiently accurate and phenotypic groups are sufficiently stable over short time periods for donors to be assigned to the same group when retested. In the longer term, platelet function phenotypes are stable for the majority of those retested up to 2 years later. However, changes in phenotype appear to occur in a minority of patients, possibly as a result of modification of environmental factors that influence platelet function, such as BMI, cholesterol, and alcohol consumption.
Discussion
Precision medicine has not yet delivered benefits for CVD treatment, with improvements needed in patient phenotyping and integration of omics data to achieve progress.8 Despite clear heterogeneity in the responses to treatments for patients with CVD, a successful strategy for stratification of patients within high- and moderate-risk groups has not been established. The challenge is to bring about a reduction in adverse cardiovascular events without an increased risk for hemorrhage. Donor phenotyping is needed to achieve this for patients using current antiplatelet drugs. Stratification using risk factors, such as age, obesity, and sex, appear to be insufficient, particularly in the context of primary prevention with aspirin.9 We developed PPAnalysis on the basis of the hypothesis that systematic measurement of platelet function biomarkers would reveal subgroups with distinct phenotypes that might be used to personalize treatment.
PPAnalysis measures concentration-dependent responses to agonists of the key targets of current and potential antiplatelet therapies. Efficacy and safety of antiplatelet drugs that target the platelet ADP receptor P2Y12 are known to vary, and underlying platelet hyperreactivity has been implicated as a significant source of variability in the pharmacodynamics of clopidogrel.10 In this preliminary study, we found that sensitivity to ADP was highly variable, with the least sensitive responders requiring a nearly 10-fold greater concentration of ADP to stimulate half-maximal activation compared with the most sensitive responders (Figure 2; supplemental Table 3). However, the range of responses to the GPVI receptor agonist CRP were even greater, with a difference of 1.5 orders of magnitude between the most and least sensitive responders. This might have major implications for proposed new therapies, such as the anti-GPVI Fab fragment ACT017,11 suggesting that baseline platelet reactivity might have an even greater confounding role in pharmacodynamics. Sensitivity to the PAR1 agonist TRAP-6 demonstrated the least variability; although a similar range of responses to ADP was observed, the variation was the lowest among the agonists tested (supplemental Table 3). This corresponds with the low variability in the pharmacodynamics of the PAR1 antagonist vorapaxar in phase 1 studies.12
In addition to sensitivity, PPAnalysis measures response capacity, which quantifies the magnitude of the functional outputs of integrin αIIbβ3 activation and α-granule secretion. The conformational change that enables integrin αIIbβ3 to bind fibrinogen is a critical step in thrombosis and hemostasis. Drugs targeting this receptor, such as abciximab, eptifibatide, and tirofiban, are potent antithrombotic agents; however, they have limited clinical utility as a result of their negative impact on hemostasis.13 We found that levels of fibrinogen binding to the activated integrin following stimulation with ADP were highly variable. Response capacity for TRAP-6 and CRP were similar and higher than for ADP, corresponding with ADP being a weak agonist.14 However, blockade of the ADP receptor P2Y12 with cangrelor demonstrated that fibrinogen binding response capacities to TRAP-6 and CRP were themselves dependent upon ADP released from platelet dense granules (Figure 3E). This is likely due to the strong activation of phosphatidylinositol 3-kinase stimulated by the P2Y12 receptor, which is required for activation of the integrin-activating small GTPase Rap1.15 Therefore, PPAnalysis measures the ability to secrete ADP in response to TRAP-6 and CRP as part of the response capacity.
A systematic approach to characterization of platelet function using the 2 separate metrics of sensitivity and capacity has not been undertaken previously, and we found that these metrics are independent, reflecting distinct aspects of platelet function (Figure 3). This new approach suggests that the concept of platelet reactivity, which has been a useful tool in understanding resistance to antiplatelet therapy, might be an oversimplification. High platelet reactivity in patients fitted with drug-eluting stents is associated with an increased risk for myocardial infarction,16 yet increased clopidogrel dosing due to high on-treatment platelet reactivity does not offer any benefit.17-19 Using PPAnalysis, we demonstrated the existence of platelet responses that are characterized by high sensitivity and low capacity, or vice versa, which is not compatible with the concept of simply high and low reactivity. This indicates the existence of individuals with both high sensitivity and capacity who might be more resistant to antiplatelet medication, as well as individuals with low sensitivity and capacity who might be more prone to adverse bleeding events.
To enable the results of PPAnalysis to be used as a practical research and decision-making tool, we incorporated techniques for dimensional reduction into the freely available software. Utilizing PCA and clustering, we identified 6 subgroups with distinct platelet-reactivity profiles (platelet function phenotypes; Figure 5). Identification of these 6 distinct phenotypes suggests that the concept of “low” and “high” platelet reactivity could be another oversimplification. In the context of secondary prevention of CVD, point-of-care tests may successfully identify patients who are at increased risk; however, results from different tests rarely agree with each other,20 suggesting that they measure different aspects of platelet reactivity that are more accurately delineated by PPAnalysis.
Studies utilizing flow cytometry to characterize platelet function have been especially valuable in determining the genetic basis for population variability.3,4,6,21 However, these studies often rely on low-dimensional data sets, including platelet responses to only 1 or 2 concentrations of agonist. We replicated this approach by retrospectively analyzing responses to only a single concentration of each agonist. This approach yielded weaker discriminatory power compared with analysis that incorporated sensitivity and capacity, enabling identification of only 3 distinct clusters of low, medium, and high responders. Large-scale studies of hereditary platelet bleeding disorders frequently fail to identify a cause.22 The enhanced capability of PPAnalysis to distinguish platelet function phenotypes may help to identify genetic variants that determine variation in platelet function. PPAnalysis can be paired with microtiter plate-based aggregometry for studies in which responses to U46619, epinephrine, ristocetin, or arachidonic acid are important.
We found that PPAnalysis phenotypes were highly stable over short periods of time. Over longer periods of up to 24 months, the majority of phenotypes remain stable upon retesting. This is in keeping with studies that have indicated that platelet responses remain consistent over time.2,3,7 The existence of stable platelet function phenotypes agrees with studies that have identified heritable factors as key determinants of platelet function.4,23 However, although heritable factors are dominant in determining platelet reactivity, nonheritable and environmental factors, such as age, BMI, triglyceride and cholesterol levels, and menopause, are also known to affect platelet reactivity.24 This is in line with the fact that a minority of donors within the cohort changed phenotype when retested over a longer time frame.
In conclusion, PPAnalysis provides a foundation for studies investigating associations between platelet function and disease, genetics, and therapeutic interventions. Our ongoing studies will investigate associations between the phenotypic groups identified using PPAnalysis and the risk of bleeding and thrombosis in patients. Our hope is that open access to the PPAnalysis assay method and software will facilitate standardization of this aspect of cardiovascular research and enhance the scope of collaborative research and the potential for meta-analysis, as well as facilitate multicenter and longitudinal studies.
Acknowledgments
This work was supported by the British Heart Foundation (RG/15/2/31224, PG/16/20/32074, PG/16/36/31967).
Authorship
Contribution: A.P.B., A.J.U., J.L.D., J.M.G., and N.K. designed the study; N.K. designed and optimized the assay; A.J.U., N.K. T.S., J.L.M., C.K., J.B., H.M., and P.T. performed assays; J.L.D designed and wrote the software; A.P.B and J.L.D analyzed data and wrote the manuscript; A.J.U. and K.D. coordinated recruitment; and J.M.G, C.I.J., N.K., and A.J.U. reviewed the manuscript.
Conflict-of-interest disclosure: The authors declare no competing financial interests.
Correspondence: Joanne L. Dunster, Institute for Cardiovascular and Metabolic Research, School of Biological Sciences, University of Reading, Reading RG6 6AX, UK; e-mail: j.l.dunster@reading.ac.uk.