Key Points
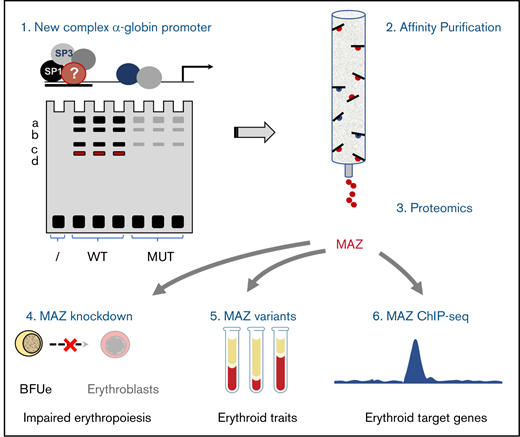
A mass spectrometry screen identified MAZ as a TF binding to the human α-globin promoter.
In erythroid cells, MAZ targets many erythroid-specific regulatory elements, and knockdown of MAZ compromises erythropoiesis.
Abstract
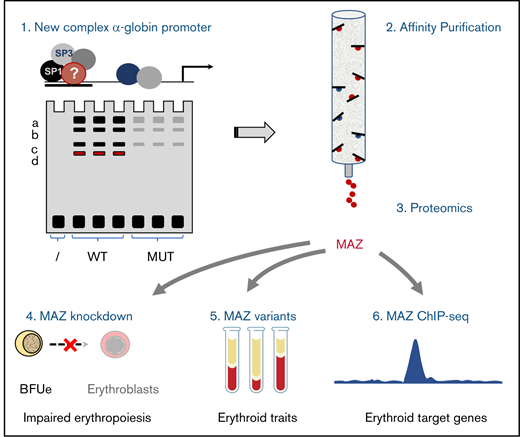
Erythropoiesis requires a combination of ubiquitous and tissue-specific transcription factors (TFs). Here, through DNA affinity purification followed by mass spectrometry, we have identified the widely expressed protein MAZ (Myc-associated zinc finger) as a TF that binds to the promoter of the erythroid-specific human α-globin gene. Genome-wide mapping in primary human erythroid cells revealed that MAZ also occupies active promoters as well as GATA1-bound enhancer elements of key erythroid genes. Consistent with an important role during erythropoiesis, knockdown of MAZ reduces α-globin expression in K562 cells and impairs differentiation in primary human erythroid cells. Genetic variants in the MAZ locus are associated with changes in clinically important human erythroid traits. Taken together, these findings reveal the zinc-finger TF MAZ to be a previously unrecognized regulator of the erythroid differentiation program.
Introduction
For over 4 decades, studies of the α- and β-globin gene clusters have contributed to our understanding of some of the fundamental principles of mammalian gene regulation, including RNA stability, termination of transcription, and the identification of remote regulatory elements.1 A complex network of DNA sequence elements, chromatin accessibility, histone modifications, and transcription factor (TF) occupancy orchestrates expression of globin genes, which are exclusively expressed in erythroid cells.2 Both proximal regulatory elements (promoters) and distal regulatory elements (enhancers) are required for the initiation of α-globin (HBA) and β-globin (HBB) gene expression in erythroid cells. When active, these regulatory elements are characterized by the presence of open chromatin regions and active histone modifications. A small group of lineage-restricted TFs, including GATA binding protein 1 (GATA1), T-cell acute lymphocytic leukemia 1 protein (TAL1), and erythroid Krüppel-like factor (EKLF; henceforth referred to as KLF1), act as erythroid master regulators3 by binding to both promoters and enhancers of the globin genes as well as to other genes important for erythropoiesis (reviewed in Philipsen et al,2 Perkins et al,4 and Katsumura et al5), where they usually act together with other widely expressed TFs.6-14 However, despite the enormous advances that have been achieved in our understanding of the molecular mechanisms controlling globin gene expression, this research area keeps progressing.
Here, we have carried out an unbiased screen for proteins that bind to adjacent GC-rich motifs in the promoter of the duplicated α-globin genes (HBA2 and HBA1) in human erythroid cells, combining electrophoretic mobility shift assays (EMSAs), DNA affinity purification, and mass spectrometry. This screen identified Myc-associated zinc finger (MAZ) protein as a direct binder of the promoter region of the human HBA gene in vitro and in vivo. Knockdown of MAZ reduces HBA expression in K562 cells and impairs erythroid differentiation in primary human cultures. Moreover, variants in the MAZ gene and its promoter region are associated with changes in red blood cell parameters and erythroid traits. Chromatin immunoprecipitation sequencing (ChIP-seq) experiments in primary human erythroblasts revealed that MAZ recognizes a canonical G3(C/A)G4 binding motif and is enriched at transcription start sites (TSSs) of transcriptionally active genes and distal regulatory elements. Erythroid-specific MAZ signal is enriched at promoters of genes associated with erythropoietic disorders. We found that MAZ erythroid-specific binding sites frequently colocalize with GATA1 particularly at enhancer elements, suggesting functional synergy between these 2 TFs. Together, our findings identify MAZ as an important regulator of the erythroid differentiation program.
Materials and methods
Cell lines and primary erythroid cells
Primary erythroid cells and Epstein-Barr virus (EBV)–infected B lymphoblasts were obtained as previously described.15 Cell lines (K562, HT29, HeLa, SW13, and COS7) were cultured in RPMI 1640 supplemented with 10% fetal bovine serum. For small interfering RNA (siRNA) –mediated knockdown of MAZ, K562 cells were transfected with MAZ SMARTPool siRNA or nontargeting control pool siRNA (Dharmacon) using Lipofectamine according to the manufacturer’s instructions, and cells were harvested after 4 days. For overexpression of MAZ, COS7 cells were transfected with the plasmid pcDSAF-1, which expresses full-length MAZ (SAF-1) complementary DNA under the control of the cytomegalovirus promoter.16 Cells were transfected using Lipofectamine according to the manufacturer’s instructions and harvested after 30 hours.
EMSA
Nuclear extracts were performed as described previously,17 except that nuclei were incubated in buffer C for 30 minutes. Protein concentration was determined using the Qubit Protein Assay Kit (Thermo Fisher). Oligonucleotide probes (supplemental Table 6) were designed to have an additional 5'GG overhang on each end after annealing and were labeled by filling in with the large Klenow fragment of DNA polymerase I in the presence of [α-32P]-dCTP as described by the manufacturer (New England Biolabs). For gel shift reactions, 5 μg nuclear extract was incubated with 1 ng radiolabeled probe (>10000 cpm) in buffer (10 mM N-2-hydroxyethylpiperazine-N′-2-ethanesulfonic acid [pH 7.8], 50 mM potassium glutamate, 5 mM MgCl2, 1 mM EDTA, 1 mM dithiothreitol, 0.5 μg of poly(dI-dC), 10 μg bovine serum albumin, 1 mM ZnSO4, and 5% glycerol) for 30 minutes on ice. For competition experiments, unlabeled competitor oligonucleotides were added to the binding reactions at 100 × molar excess. For gel supershift experiments, antibodies were incubated with nuclear extract for 20 minutes on ice prior to the addition of the radiolabeled probe. Antibodies used in supershift experiments were as described in previous ChIP studies.18 Following binding, samples were subjected to electrophoresis at 4°C for 2.5 hours at 12 V/cm on a native polyacrylamide gel (6% [19:1] bis:acrylamide in 0.5 X Tris-borate-EDTA). The gels were dried and analyzed using a Storm 860 Molecular Imager (Molecular Dynamics).
shRNA knockdown in primary erythroid cultures
Lentiviral constructs expressing short hairpin RNAs (shRNAs) targeting nonoverlapping sites in exon 4 of MAZ (clones TRCN0000235699 and TRCN0000235703) or nontargeting scrambled shRNAs were obtained from Merck. These constructs express the shRNA from the human U6 promoter and the Puror gene from the hPGK promoter. Lentiviral preparations were prepared using standard techniques by cotransfection of 293T cells with the lentiviral construct together with psPax2 and pMD2.G using calcium phosphate–mediated transfection. Culture supernatants were harvested at 48 hours after transfection and concentrated by ultracentrifugation using standard techniques. For lentiviral-mediated knockdown experiments, primary erythroid differentiation cultures were carried out essentially as described in Leberbauer et al,19 with the following modifications: peripheral blood mononuclear cells were cultured for 8 days in erythroblast expansion medium containing StemSpan SFEM medium (Stem Cell Technologies) supplemented with Epo (2 U/mL, Roche), IGF-1 (40 ng/mL, R&D systems), stem cell factor (100 ng/mL, R&D Systems), dexamethasone (1 μM, Sigma), and cholesterol-rich lipids (40 μg/mL, Sigma). Cells were infected with concentrated lentivirus for 24 hours in expansion medium supplemented with hexadimethrine bromide (8 µg/mL). The cells were seeded in fresh expansion medium for 24 hours prior to selection with puromycin (2 µg/mL) for 48 hours. After removing puromycin, cells were cultured for a further 3 days in expansion medium prior to harvesting for flow cytometry, RNA, and protein (total of 15 days in culture).
Mass spectrometry
For proteomics analysis, the DNA baits corresponding to oligonucleotide 13/14 wild-type and 13/14 M3 with a TT/AA overhang were annealed, phosphorylated, ligated, and purified as previously described.20 The desthiobiotinylated oligonucleotides were coupled to Streptavidin Dynabeads MyOne C1 (Life Technologies) for 60 minutes at room temperature and excess oligonucleotides removed by washing. The oligonucleotide coupled streptavidin beads were incubated with 250 µg K562 nuclear extract diluted in PBB buffer (150 mM NaCl, 50 mM Tris–HCl [pH 8.0], 10 mM MgCl2, 0.5% Igepal CA630, and Complete Protease Inhibitor without EDTA [Roche]) for 2 hours at 4°C under slight agitation. Nonbound proteins were removed by washing 3 times with PBB buffer and the bound DNA-protein complexes liberated from the streptavidin beads with 200 µL of a 16 mM biotin/50 mM ABC (pH 8.0) solution. The complexes were precipitated with pure ethanol overnight at room temperature. The pellet was resuspended in 50 µL 8M urea and first digested with LysC (Wako) for 3 hours and subsequently diluted to 250 µL with 50 mM ABC buffer and digested with 200 ng trypsin overnight, both at room temperature. The tryptic peptides were loaded onto an SCX StageTip21 and stored until the mass spectrometry measurement.
The tryptic peptides were fractionated on an in-house–packed 25-cm microcapillary column (Reprosil 3.0 µm; Dr. Maisch) in a 125-minute gradient from 5% to 60% acetonitrile. The mass spectrometry measurement was performed on an LTQ Orbitrap XL (Thermo Fisher) with a top5 DDA method using collision-induced dissociation fragmentation. The mass spectrometry data were processed with MaxQuant22 version 1.0.12.5 using the human UniProt database.
Expression analysis
RNA was extracted with Tri reagent (Sigma) according to the manufacturer’s instructions. RNAs were DNaseI treated (Ambion), and complementary DNA was generated with SuperScript III (Invitrogen) as previously described.23 Primers used are listed in supplemental Table 6.
Antibodies
Anti-MAZ antibody (A301-652A) was from Bethyl Laboratories, α-globin (sc-514378) and β-globin (sc-21757) antibodies were from Santa Cruz Biotechnology, and β-actin (A1978) antibody was from Sigma. The following antibodies were used for flow cytometry: CD71 (sc-7327) from Santa Cruz Biotechnology (primary), IgG1-APC (406610) from BioLegend (secondary), and GPA (130-120-473) phycoerythrin-conjugated antibody from Miltenyi Biotec.
ChIP-qPCR and ChIP-seq assay
ChIP was performed as previously described.24 Briefly, chromatin was first crosslinked with ethylene glycol bis(succinimidyl succinate) in phosphate-buffered saline at a final concentration of 2 mM for 60 minutes at room temperature. Formaldehyde (CH2O) was then added at a final concentration of 1% for 15 minutes at room temperature, and samples were sonicated over 20 minutes (10 × 30-second pulses) at 4°C to cleave genomic DNA (Bioruptor, Diagenode). Each ChIP was performed as 2 independent experiments, and quality was assessed by quantitative polymerase chain reaction (qPCR) using primers and probes (5'FAM-3'TAMRA) described in.18 The ChIP-seq libraries were prepared using the New England Biolabs NEBNext ChIP-Seq Library Prep Reagent Set for Illumina according to the manufacturer’s protocol and starting with between 6 and 40 ng of captured DNA. All libraries received 12 cycles of PCR amplification in the final step before PCR cleanup using Ampure beads. Sequencing was carried out on the HiSeq 2500 using Illumina HiSeq Rapid Cluster Kit v2 - Paired-End for 100 cycles. RTA software version used was Illumina RTA 1.17.20 and the Pipeline software version was bcl2fastq-1.8.3. Analysis of ChIP-seq is described in supplemental Materials and Methods.
Ethics approval and consent to participate
This study was conducted in accordance with the Declaration of Helsinki, and protocols received ethical approval from Oxford University Ethical Review Panel (Reference T648). The data were analyzed anonymously. Adult peripheral blood mononuclear cells were isolated from LRS cones, with informed consent from all donors, and used in accordance with the Declaration of Helsinki and approved by the National Health Service National Research Ethics Committee (reference number 08/H0102/26) and the Bristol Research Ethics Committee (reference 12/SW/0199).
Results
A novel DNA-protein complex occupies the distal promoter region of the human HBA genes
Transcriptional activation of the HBA genes during erythroid differentiation is associated with localized relaxation of chromatin structure, which is observed experimentally as a chromatin accessible region immediately upstream (promoter region) of the adult HBA genes (chromosome 16: 172000 and 176000; supplemental Figure 1A) specifically in erythroid cells.25 In order to map chromatin accessibility within this region at a higher resolution than provided by DNase-sequencing and assay for transposase-accessible chromatin using sequencing (ATAC-seq) approaches, intact nuclei isolated from cells expressing α-globin (the erythroid cell line K562) and not expressing α-globin (EBV-transformed B lymphoblast cell line) were digested with low concentrations of selected restriction enzymes. The extent of digestion reflects accessibility of the specific recognition sites and was assessed by Southern blotting (supplemental Figure 1B). This assay revealed that the region of erythroid-specific sensitivity extends from −220 bp (FokI site) to +35 bp (NcoI site) relative to the TSS of the HBA genes (supplemental Figure 1B).
In order to characterize protein binding across this hypersensitive region, we carried out EMSAs using a series of overlapping oligonucleotide probes to compare in vitro binding proteins in nuclear extracts prepared from the same erythroid (K562) and nonerythroid (EBV) cells. Oligonucleotide probes were specifically placed at positions suggestive of protein binding by in vivo dimethyl-sulfate footprinting assays reported previously (Figure 1A and Table 1).26
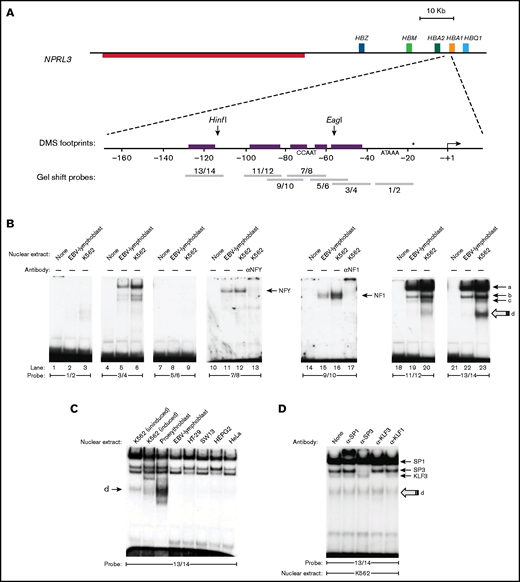
An erythroid-enriched complex binds a distal element of the HBA promoter. (A) Structure of the HBA core and distal promoter elements. The TSS is depicted as an angled arrow, and the locations of the EMSA probes are shown as gray bars. In vivo dimethyl-sulfate (DMS) footprints detected in K562 and erythroblasts26 are represented by the purple boxes. The nucleotide located 18 bp downstream of the TATA box (*) differs between the HBA1 (C) and HBA2 (G) promoters. (B) EMSA and supershift assays using K562 and EBV nuclear extracts with the indicated probes. (C) The fast-migrating species with probe 13/14 (species d) is enriched in erythroid cells. (D) Sp/X-KLF-family antibodies cause retardation or disruption of the bands (a), (b), and (c), but not (d).
An erythroid-enriched complex binds a distal element of the HBA promoter. (A) Structure of the HBA core and distal promoter elements. The TSS is depicted as an angled arrow, and the locations of the EMSA probes are shown as gray bars. In vivo dimethyl-sulfate (DMS) footprints detected in K562 and erythroblasts26 are represented by the purple boxes. The nucleotide located 18 bp downstream of the TATA box (*) differs between the HBA1 (C) and HBA2 (G) promoters. (B) EMSA and supershift assays using K562 and EBV nuclear extracts with the indicated probes. (C) The fast-migrating species with probe 13/14 (species d) is enriched in erythroid cells. (D) Sp/X-KLF-family antibodies cause retardation or disruption of the bands (a), (b), and (c), but not (d).
We observed band shifts for 5 out of 7 probes used (Figure 1B). Previous motif analysis had suggested potential binding motifs for Krüppel-like (Sp/X-KLF) family proteins (−121/−116, −61/−56), NFY (−72/−65), nuclear factor I (NF1) (−85/−72), and α-inverted repeat protein (α-IRP) (−51 − 42)26 (Table 1). Gel supershift assays, in which nuclear extracts were preincubated with anti-NFY or anti-NF1 antibodies, show retarded bands with probes 7/8 and 9/10, respectively, confirming that these sites are indeed bound by NFY and NF1 (Figure 1B, lanes 13 and 17, respectively). Interestingly, complex binding patterns composed of 4 shifted bands were observed at 2 neighboring GC boxes situated at −100/−83 (probe 11/12) and −128/−111 (probe 13/14). These GC boxes have a highly similar sequence (supplemental Figure 2A) and were able to cross-compete with each other in competition assays (supplemental Figure 2B), suggesting that they are likely to be bound by the same proteins. Interestingly, while the most heavily retarded bands (labeled a, b, and c in Figure 1B) were detected in both K562 and EBV nuclear extracts, the faster migrating species (d) was observed only in K562 cells. This factor bound more strongly to probe 13/14 than to 11/12 (Figure 1B, compare lanes 20 and 23), a finding that was confirmed in competition assays (supplemental Figure 2B). Gel shifts carried out with nuclear extracts from other cell types revealed that species (d) was the most abundant complex in primary human erythroblasts but was either not detected or weak in a range of nonerythroid cells types (HT-29, SW13, HepG2, and HeLa) (Figure 1C).
The probe 13/14 (covering −128/−111 region) contains a predicted binding motif for the Krüppel-like zinc-finger TF SP126 (Table 1). We found that the binding of all 4 proteins to probe 13/14 was sensitive to the presence of the zinc-chelating agent EDTA (supplemental Figure 3A), consistent with zinc-finger–dependent binding. In contrast, binding of the non-zinc-finger protein NFY to probe 7/8 was not strongly affected by EDTA (supplemental Figure 3A). To identify the protein responsible for these bands on probe 13/14, we carried out gel supershift reactions using antibodies against candidate zinc-finger proteins (SP1, SP3, KLF1, and Krüppel-like factor 3 [KLF3, also known as BKLF]). These experiments revealed species (a), (b), and (c) to be SP1, SP3, and KLF3, respectively (Figure 1D). These findings are consistent with species (a), (b), and (c) being observed in both erythroid and nonerythroid nuclear extracts (Figure 1C), since SP1, SP3, and KLF3 are all widely expressed TFs and have previously been shown to regulate α-globin expression.10,18 In contrast, the binding of species (d) to probe 13/14 was not strongly affected by any of the antibodies tested. Taken together, these experiments have revealed an erythroid-enriched complex at neighboring sites in the −128/−90 region upstream of HBA genes.
A mass spectrometry–based screen identifies MAZ as a factor binding at the HBA globin promoter
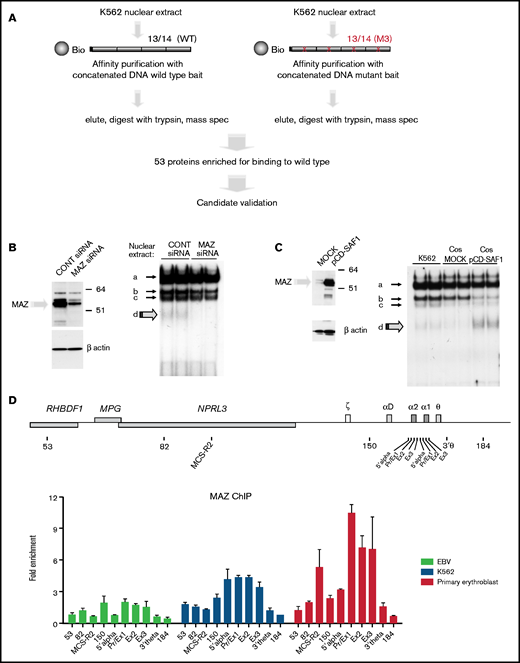
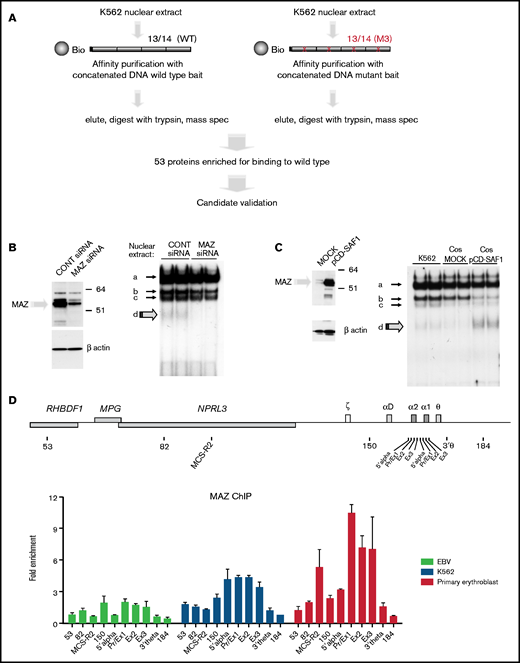
In order to identify the factor responsible for species (d), we carried out a protein affinity purification screen, using probe 13/14 as the bait (Figure 2A). As a negative control, we designed a mutant version of probe 13/14 (M3) in which a central guanidine was changed to thymidine, preventing formation of species (d) while also depleting binding of SP1, SP3, and KLF3 (supplemental Figure 3B). To carry out this screen, K562 nuclear extracts were incubated with desthiobiotin-modified concatenated DNA probes, protein-DNA complexes were purified using streptavidin beads, and eluted proteins were subjected to mass spectrometry (Figure 2A).20 Of the proteins most significantly enriched, MAZ (Myc-associated zinc finger) was the strongest candidate, exhibiting strong enrichment at the wild-type compared with the mutant probe and high tryptic peptide counts in both wild-type replicates (supplemental Table 1). MAZ is a C2H2-type zinc-finger protein, which has been previously shown to bind in vitro to a G-rich consensus motif (G3AG3) in nonerythroid cells.27-29 In order to investigate whether MAZ is indeed the protein responsible for species (d), we performed siRNA-mediated knockdown of MAZ in K562 cells and found that depletion of endogenous MAZ protein (Figure 2B, left panel) was associated with reduction of species (d) in the gel shift assays (Figure 2B, right panel). Conversely, expression of exogenous MAZ protein in COS7 cells was associated with strong enrichment of species (d) (Figure 2C). Binding of the overexpressed MAZ protein resulted in a depletion of the SP3 gel shift, indicating competition for binding under these in vitro conditions. Altogether, these experiments confirm that MAZ is indeed the protein responsible for species (d) and indicate that MAZ binds to neighboring GC boxes at −100/−83 and −128/−111 within the human HBA promoter in vitro.
Identification of MAZ by mass spectrometry. (A) Schematic representation of the affinity purification screen. (B and C) Western blots (left) and EMSA (right) showing that the intensity of species (d) is dependent on MAZ expression using knockdown (siRNA) (B) or overexpression (pCD-SAF1) (C) experiments. (D) MAZ is recruited to the active α-globin promoter in vivo. Analysis of MAZ binding at the α-globin locus in EBV lymphoblasts, K562 cells, and human primary erythroid cells by ChIP-qPCR. The y-axis represents enrichment over the input DNA, normalized to a control sequence in the human 18S gene. The x-axis indicates the TaqMan probes used. The position of probes within the α-globin cluster are indicated on the heading map. The α-globin genes themselves are covered by 3 probes (Pr/Ex1, Ex2, and Ex3). Error bars correspond to 1 standard error of the mean from 2 independent ChIPs.
Identification of MAZ by mass spectrometry. (A) Schematic representation of the affinity purification screen. (B and C) Western blots (left) and EMSA (right) showing that the intensity of species (d) is dependent on MAZ expression using knockdown (siRNA) (B) or overexpression (pCD-SAF1) (C) experiments. (D) MAZ is recruited to the active α-globin promoter in vivo. Analysis of MAZ binding at the α-globin locus in EBV lymphoblasts, K562 cells, and human primary erythroid cells by ChIP-qPCR. The y-axis represents enrichment over the input DNA, normalized to a control sequence in the human 18S gene. The x-axis indicates the TaqMan probes used. The position of probes within the α-globin cluster are indicated on the heading map. The α-globin genes themselves are covered by 3 probes (Pr/Ex1, Ex2, and Ex3). Error bars correspond to 1 standard error of the mean from 2 independent ChIPs.
In order to confirm binding by MAZ at the active HBA promoter in vivo, we carried out ChIP-qPCR experiments using a previously described series of qPCR amplicons throughout the HBA locus.18 Whereas binding was absent or low in nonexpressing cells (EBV lymphoblast), strong enrichment of MAZ was observed at the HBA promoter and gene body in cells expressing α-globin, with the highest enrichment observed in primary erythroid cells (Figure 2D). In these primary cells, MAZ was also enriched at the important distal regulatory element of the HBA locus (MCS–R2). We further investigated the dynamics of MAZ recruitment to the HBA genes during erythroid maturation in primary erythroblast differentiation cultures (supplemental Figure 4A-C). During differentiation, expression of the adult globin genes HBB and HBA is strongly upregulated, peaking in intermediate- and late-stage erythroblasts (supplemental Figure 4D, see also Brown et al30). Concomitantly with the strong upregulation of HBA expression, MAZ was dynamically recruited to the HBA promoter and genes in these cultures (supplemental Figure 4E). Altogether, our results indicate that MAZ binds to the active human HBA locus both in vitro and in vivo.
MAZ is required for erythroid differentiation and is associated with changes in erythroid-related traits
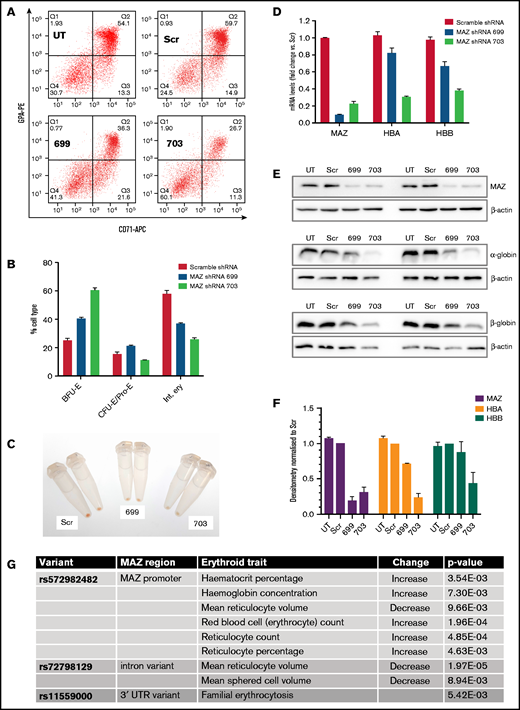
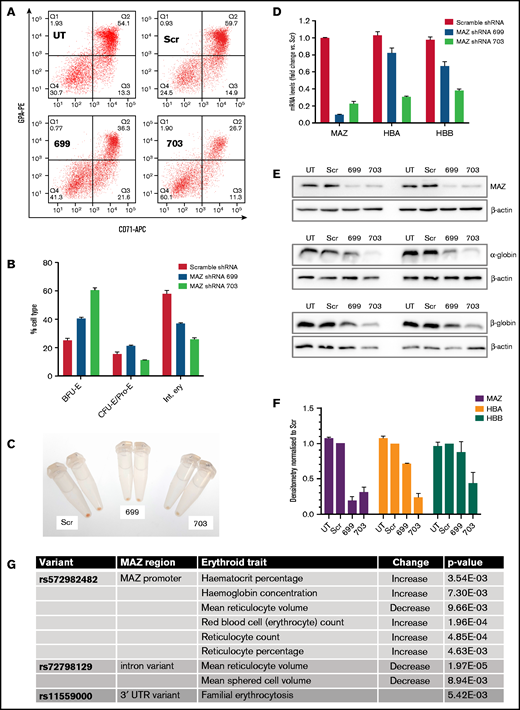
To investigate the functional significance of MAZ during erythroid differentiation, we used 2 different shRNAs to deplete MAZ expression in differentiating primary human erythroid cultures (Figure 3). Flow cytometry analysis revealed an impaired differentiation of primary erythroid cultures infected with the MAZ shRNA lentivirus, with cells accumulating at the burst-forming unit-erythroid (BFU-E) stage (CD71loGPAlo), and fewer cells reaching the stage of intermediate erythroblasts (Int. ery) (CD71+GPA+) (Figure 3A-B; supplemental Figure 5). This impaired differentiation could also be observed as a deficiency of hemoglobinization (Figure 3C). In cells harvested at the end of the culture, knockdown of MAZ expression was confirmed by RT-qPCR and western blots and was associated with downregulation of expression of both α- and β-globin (Figure 3D-F), consistent with the impeded differentiation. In K562 cells (where differentiation is not a factor), shRNA-mediated knockdown of MAZ reduced expression of HBA relative to the HBG and HBE genes of the β-globin cluster (supplemental Figure 5C). Taken together with the EMSA and ChIP-qPCR results, this finding is consistent with MAZ exerting a direct effect on HBA expression, which is independent of an effect on erythroid differentiation.
MAZ knockdown impairs erythropoiesis. (A) Flow cytometry analysis of CD71 and glycophorin (GPA) expression at day 15 of representative primary erythroblast differentiation cultures either untransduced (UT) or transduced with lentivirus expressing scramble shRNA (Scr), MAZ shRNA 699, or MAZ shRNA 703. (B) Quantitation of flow cytometry in A. Shown is the mean and standard deviation from 2 independent differentiation cultures. Burst-forming unit-erythroid (BFU-E) are CD71−/GPA−, and colony-forming unit-erythroid (CFU-E)/Proerythroblasts (Pro-E) are CD71+/GPAlo/int and intermediate erythroblasts (Int. ery) are CD71+/GPA+. (C) Cell pellets from primary cultures at d15 of differentiation. Cultures with the MAZ shRNA 699 and 703 are pale compared with Scr control, indicating less extensive hemoglobinization. (D) Real-time RT-PCR analysis of expression of MAZ, HBA and HBB after 15 days of primary erythroid differentiation cultures. Shown is the mean and standard deviation from 2 independent differentiation cultures. For each gene, expression (relative to the PABPC1 gene) is normalized to the mean value observed with scramble shRNA. (E) Western blot analysis of the expression of MAZ, HBA, and HBB after 15 days in 2 independent primary erythroid differentiation cultures. β-actin was used as loading control. (F) Densitometry analysis of the western blots shown in E. For each protein, expression (relative to β-actin) is normalized to the mean value observed with scramble shRNA. (G) Variants around the MAZ locus significantly associated with changes in clinical erythroid traits (adjusted P value < .01). APC, allophycocyanin; PE, phycoerythrin; UTR, untranslated region.
MAZ knockdown impairs erythropoiesis. (A) Flow cytometry analysis of CD71 and glycophorin (GPA) expression at day 15 of representative primary erythroblast differentiation cultures either untransduced (UT) or transduced with lentivirus expressing scramble shRNA (Scr), MAZ shRNA 699, or MAZ shRNA 703. (B) Quantitation of flow cytometry in A. Shown is the mean and standard deviation from 2 independent differentiation cultures. Burst-forming unit-erythroid (BFU-E) are CD71−/GPA−, and colony-forming unit-erythroid (CFU-E)/Proerythroblasts (Pro-E) are CD71+/GPAlo/int and intermediate erythroblasts (Int. ery) are CD71+/GPA+. (C) Cell pellets from primary cultures at d15 of differentiation. Cultures with the MAZ shRNA 699 and 703 are pale compared with Scr control, indicating less extensive hemoglobinization. (D) Real-time RT-PCR analysis of expression of MAZ, HBA and HBB after 15 days of primary erythroid differentiation cultures. Shown is the mean and standard deviation from 2 independent differentiation cultures. For each gene, expression (relative to the PABPC1 gene) is normalized to the mean value observed with scramble shRNA. (E) Western blot analysis of the expression of MAZ, HBA, and HBB after 15 days in 2 independent primary erythroid differentiation cultures. β-actin was used as loading control. (F) Densitometry analysis of the western blots shown in E. For each protein, expression (relative to β-actin) is normalized to the mean value observed with scramble shRNA. (G) Variants around the MAZ locus significantly associated with changes in clinical erythroid traits (adjusted P value < .01). APC, allophycocyanin; PE, phycoerythrin; UTR, untranslated region.
Though widely expressed across the hematopoietic system in both humans and mice, in both organisms, MAZ is particularly elevated in the erythroid lineage, consistent with an important role for MAZ in erythropoietic differentiation (supplemental Figure 6). We further investigated whether human genetic variants in the MAZ gene are associated with clinically important erythroid traits. We analyzed the GeneATLAS database that reports associations between 778 traits and millions of DNA variants.31 Out of 25 erythroid-related traits in the GeneATLAS (supplemental Table 2), changes in 8 traits (32%) were associated with 3 variants in the MAZ gene or promoter region (rs11559000, rs572982482, and rs72798129) (adjusted P value < .01; Figure 3G; see also supplemental Figure 7A). Taken together, these findings indicate that MAZ is an important factor in the erythroid differentiation program and suggest that this locus contributes to important erythroid traits.
MAZ occupies TSS and binds directly to DNA through a G3(C/A)G4 motif
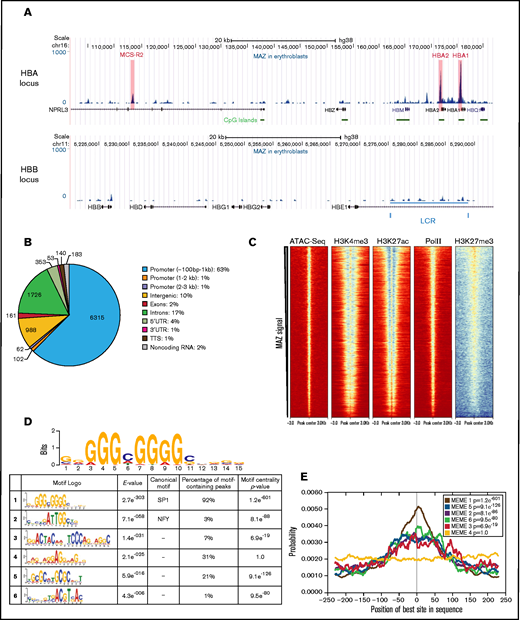
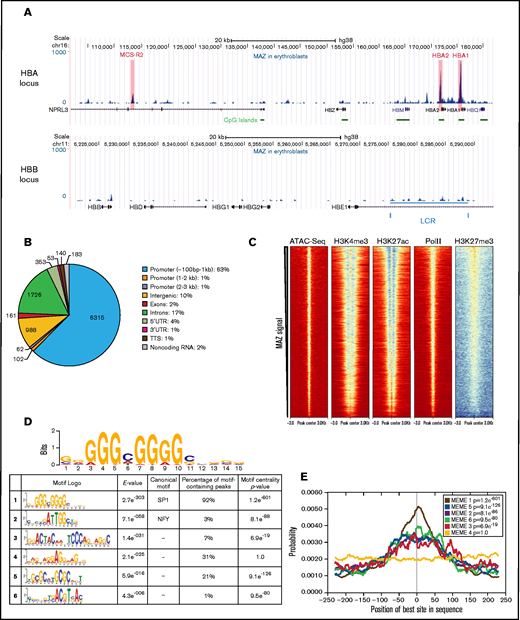
Following from our findings at the HBA locus, we expanded our analysis by investigating binding of MAZ genome-wide in primary human erythroid cells by carrying out ChIP-seq (supplemental Figure 8A-B). As previously observed by ChIP-qPCR (Figure 2D), MAZ was strongly enriched at both HBA2/1 promoters as well as, to a weaker extent, at the MCS-R2 remote regulatory element (Figure 4A, top). In contrast, very low binding of MAZ was detected at the promoter and regulatory elements (locus control region) of the HBB gene cluster (Figure 4a, bottom). Genome-wide, we identified 10088 MAZ binding sites in primary erythroid cells (Figure 4B; supplemental Figure 8C). While the majority of MAZ binding sites (65%) were located at promoter regions (Figure 4B), the average MAZ enrichment was comparable for peaks in the promoter regions, intergenic, and genic regions (supplemental Figure 8D). Overall, MAZ was present at ≥1 TSS of 28% (5466/19646) of protein-coding genes. Comparison with published ChIP- and ATAC-seq datasets from erythroid cells25,32–34 (supplemental Table 3) revealed that MAZ binding sites are located in regions of high chromatin accessibility (as detected by ATAC-seq) that are enriched for activating histone modifications (H3K4me3 and H3K27ac) and RNA Polymerase II (Pol II) but depleted of the repressive histone mark H3K27me3 (Figure 4C).
MAZ is enriched at active TSSs and binds to DNA through a (G)3C/A(G)4 consensus site. (A) MAZ ChIP-seq enrichment profiles surrounding the HBA (top) and HBB (bottom) loci. (B) Genomic distribution of MAZ binding sites showing the number of peaks overlapping the category of genomic element indicated. (C) Heatmap plots of ATAC-seq, H3K4me3, H3K27ac, RNA Polymerase (PolII), and H3K27me3 signal in erythroblasts centered on MAZ peaks (sorted according to decreasing MAZ ChIP signal in erythroblasts). (D) PWMs of the enriched motifs (E-value < 0.01) in the training set of MAZ peaks (500 highest-ranked MAZ peaks) and their occurrence in all MAZ peaks. (E) Motif localization curves relative to the MAZ peak centers. The numbers of the enriched motifs correspond to the logos in (D). LCR, locus control region.
MAZ is enriched at active TSSs and binds to DNA through a (G)3C/A(G)4 consensus site. (A) MAZ ChIP-seq enrichment profiles surrounding the HBA (top) and HBB (bottom) loci. (B) Genomic distribution of MAZ binding sites showing the number of peaks overlapping the category of genomic element indicated. (C) Heatmap plots of ATAC-seq, H3K4me3, H3K27ac, RNA Polymerase (PolII), and H3K27me3 signal in erythroblasts centered on MAZ peaks (sorted according to decreasing MAZ ChIP signal in erythroblasts). (D) PWMs of the enriched motifs (E-value < 0.01) in the training set of MAZ peaks (500 highest-ranked MAZ peaks) and their occurrence in all MAZ peaks. (E) Motif localization curves relative to the MAZ peak centers. The numbers of the enriched motifs correspond to the logos in (D). LCR, locus control region.
In order to identify motifs contributing to MAZ binding, we used the MEME software suite35 to discover de novo enriched sequence motifs in a training set consisting of the 500 highest ranked MAZ peaks.36 Overall, 6 enriched motifs were detected in the MAZ erythroblast training dataset (E-value < 0.01) and were then investigated for their occurrence in all detected MAZ peaks (Figure 4D). The most significantly enriched motif, G3(C/A)G4, is contained within the 13/14 probe derived from the HBA promoter used to identify MAZ in the MS screen and was similar to the previously published MAZ motif G3AG3.37,38 The canonical motif observed in this study G3(C/A)G4 was present in 92% of all MAZ peaks (Figure 4D) and was the only enriched motif with a narrow unimodal central enrichment in the peaks and a large maximum site probability (Figure 4E), suggesting that the vast majority of MAZ genomic binding in erythroblasts is due to direct DNA binding of MAZ to this DNA sequence motif. In agreement with these observations, mutations within this core G3CG4 motif present in the 13/14 probe prevented MAZ binding in vitro, while mutations outside this core motif had little effect (supplemental Figure 9). Furthermore, the 11/12 probe, which exhibits lower affinity for MAZ (Figure 1B; supplemental Figure 2B), contains a less-perfect version of this core motif than the 13/14 probe (supplemental Figure 9). The second most abundant motif detected in our MAZ training set was a GGAGGA-containing motif. This motif was present in 31% of MAZ peaks but did not exhibit central localization, suggesting it may contribute to MAZ binding in a cooperative manner. The enrichment of this motif is consistent with the previous reports demonstrating binding by MAZ to GGA repeats with a high propensity to form G4-quadruplexes.39-42
Our gel shift results indicated that MAZ can bind the same probes within the α-globin promoter as other C2H2 zinc-finger TFs. To investigate the potential for regulatory crosstalk between MAZ and other TFs more generally, we quantified the similarities between the identified MAZ position weight matrix (PWM) and known binding profiles of other TFs curated in the JASPAR database.43 This analysis revealed that the binding motifs of 5 C2H2 zinc-finger TFs (SP1, KLF16, KLF5, SP2, and SP3) significantly match the derived MAZ motif (E-value < 1e−3) (supplemental Figure 10A). KLF3, which binds to the same GC boxes within the α-globin promoter as MAZ (Figure 1) and has been previously described to bind the α-globin promoter,10 also shows a similar PWM. Mining of a published RNA-sequencing dataset44 revealed that with the exception of KLF5, all of these factors are expressed in erythroblasts (supplemental Figure 10B). These findings suggest a potential for widespread regulatory crosstalk between MAZ and multiple other ZF TFs in erythroid cells.
For MAZ and SP1, whose experimentally derived PWMs were most related (supplemental Figure 10C), we also compared these experimentally derived matrices with PWMs that are predicted based on inferred contact energies for the C2H2 zinc-finger domains of these 2 proteins.45 Interestingly, while the predicted PWM of SP1 was very similar to the experimentally derived matrix, the predicted PWM of MAZ was much more extended and variable than that observed experimentally in our ChIP-seq dataset, consistent with the presence of 6 zinc fingers in MAZ compared with 3 in SP1 (supplemental Figure 10C). These observations suggest that outside of an obligatory core subsequence (G3(C/A)G4, detected in 92% of all MAZ peaks), MAZ binding in erythroid cells is less determined by primary DNA sequence than predicted. This is consistent with coassociated TFs or secondary DNA structure playing an important role in determining MAZ binding.
Erythroid-specific MAZ binding sites are associated with the promoters of key erythropoiesis genes
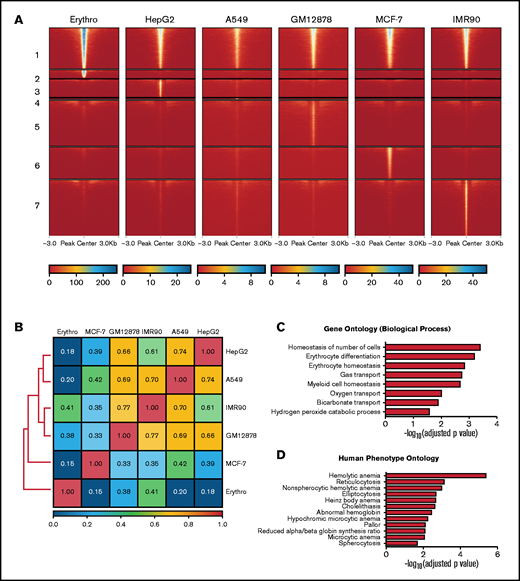
To gain further insight into the specific role of MAZ during erythroid differentiation, we compared the genome-wide profile of MAZ binding in primary erythroblasts with MAZ ChIP-seq profiles from 5 human nonerythroid cell lines (HepG2, A549, GM12878, MCF-7, and IMR90) generated by the ENCODE consortium46,47 (supplemental Table 3). Comparison of MAZ peaks identified in these 6 cell types revealed that, as expected for a housekeeping TF, a large proportion of MAZ peaks are shared between at least 2 different cell types (so called “common” peaks, n = 8310) (Figure 5A). However, between 8% and 40% of the MAZ peaks observed in a given cell line were not observed in any other cell type (Figure 5A; supplemental Table 4), suggesting that as well as regulating housekeeping functions, MAZ also plays an important role in the control of cell-type restricted gene expression programs. Consistent with this, Pearson correlation coefficients for these datasets indicated that MAZ exhibited globally distinct binding profiles in the different cell types (correlation coefficient < 0.85 for all pairwise comparisons) (Figure 5B). In particular, 18% of MAZ peaks observed in erythroid cells were not shared with other cell types (1778 peaks, termed “erythroid-specific” peaks). Comparison with gene expression profiles revealed that MAZ binds 41% (218/528) of promoters of genes with erythroid-specific expression, as defined in van de Lagemaat et al.34 Gene Ontology analysis revealed that genes with a TSS bound by MAZ in an erythroid-specific manner were significantly associated with erythroid differentiation and blood hemostasis functions (Figure 5C) as well as phenotypes associated with hematological diseases (Figure 5D). We also investigated MAZ binding at genomic loci that have previously been linked to clinical erythroid phenotypes in genome-wide association studies (GWAS). Out of these 31 genes,48 MAZ peaks were present at the promoters of 21 of them (supplemental Table 5). Interestingly, among these genes with promoters bound by MAZ in an erythroid-specific manner were the TFs GATA1 and KLF1, master regulators of erythropoiesis (supplemental Table 5 and supplemental Figure 7B). Taken together, these findings indicate that MAZ binds to the promoters of genes with key roles in erythroid differentiation and homeostasis.
Analysis of erythroid-specific MAZ signal. (A) Heatmap plots of MAZ ChIP-seq datasets from 6 cell types separated into MAZ common and cell-line-specific peaksets. Numbers on the left indicate the common peaks (1) and peaks specific to erythroblasts (2), HepG2 (3), A549 (4), GM12878 (5), MCF-7 (6), and IMR90 (7) cells. (B) Pearson correlation analysis of MAZ ChIP-seq datasets from the 6 cell types. (C) Gene Ontology (by biological function) of genes containing erythroid-specific MAZ promoter signal. (D) Human Phenotype Ontology of genes containing erythroid-specific MAZ promoter signal.
Analysis of erythroid-specific MAZ signal. (A) Heatmap plots of MAZ ChIP-seq datasets from 6 cell types separated into MAZ common and cell-line-specific peaksets. Numbers on the left indicate the common peaks (1) and peaks specific to erythroblasts (2), HepG2 (3), A549 (4), GM12878 (5), MCF-7 (6), and IMR90 (7) cells. (B) Pearson correlation analysis of MAZ ChIP-seq datasets from the 6 cell types. (C) Gene Ontology (by biological function) of genes containing erythroid-specific MAZ promoter signal. (D) Human Phenotype Ontology of genes containing erythroid-specific MAZ promoter signal.
MAZ signal is enriched at GATA1-bound enhancers in erythroid cells
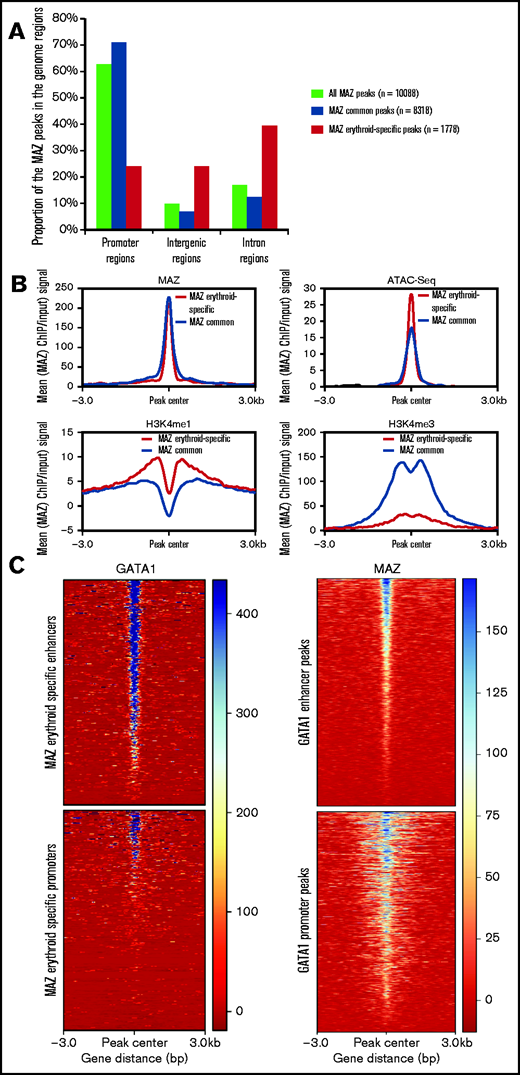
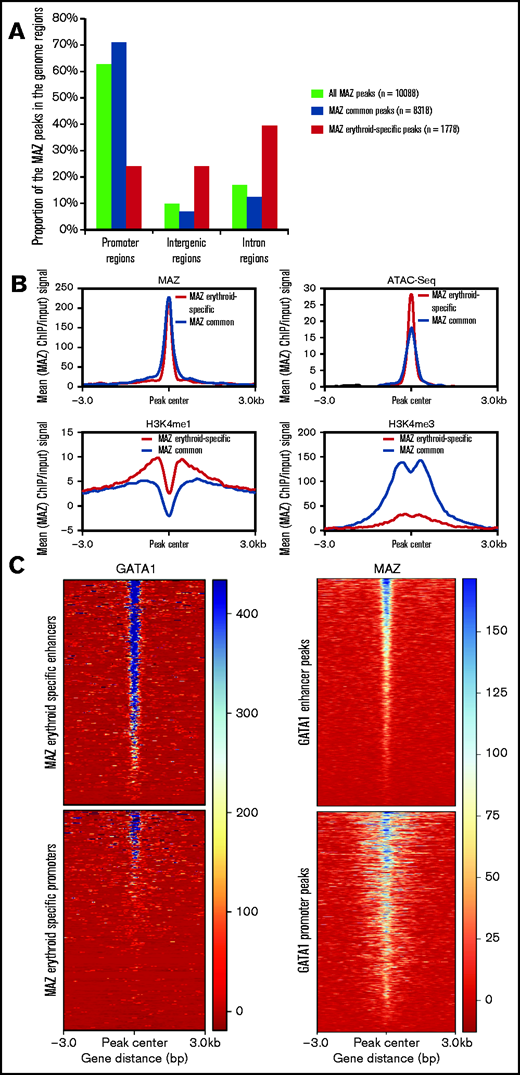
Interestingly, the common and erythroid-specific peaks of MAZ displayed distinct localization relative to genomic features (Figure 6A). While the majority (71%) of common peaks were localized at promoter regions, only 24% of the MAZ erythroid-specific peaks were located at promoters. In contrast to common MAZ peaks, erythroid-specific MAZ peaks were enriched at intergenic (24%) and intronic (40%) sites, suggesting that MAZ may play an important role at erythroid-specific distal regulatory elements. Comparison with our previously published catalog of erythroid enhancers34 confirmed that 27% of the erythroid-specific MAZ peaks coincided with known enhancer elements, compared with only 7% of the common peaks. Consistent with this observation, we observed enrichment of the enhancer-associated histone modification H3K4me1 on erythroid-specific non-TSS MAZ peaks, but not on common non-TSS MAZ peaks, with H3K4me3 following the reverse trend (Figure 6B).
Erythroid-specific MAZ signal is enriched on GATA1-bound enhancers. (A) Genome distribution of MAZ common and erythroid-specific binding sites. (B) Average H3K4me1, H3K4me3, MAZ, and ATAC-seq signal in primary erythroid cells plotted against MAZ erythroid-specific peakset (red) and MAZ common peakset (black) where signal from promoters have been excluded (non-TSS set). (C) Left: Heatmap plot of GATA1 ChIP-seq centered on MAZ erythroid peaks overlapping enhancers (top) and promoters (bottom). Right: Heatmap plot of MAZ ChIP-seq centered on GATA1 peaks overlapping enhancers (top) and promoters (bottom).
Erythroid-specific MAZ signal is enriched on GATA1-bound enhancers. (A) Genome distribution of MAZ common and erythroid-specific binding sites. (B) Average H3K4me1, H3K4me3, MAZ, and ATAC-seq signal in primary erythroid cells plotted against MAZ erythroid-specific peakset (red) and MAZ common peakset (black) where signal from promoters have been excluded (non-TSS set). (C) Left: Heatmap plot of GATA1 ChIP-seq centered on MAZ erythroid peaks overlapping enhancers (top) and promoters (bottom). Right: Heatmap plot of MAZ ChIP-seq centered on GATA1 peaks overlapping enhancers (top) and promoters (bottom).
Ubiquitous and lineage-specific factors often work together at proximal and distal regulatory elements. As such, we explored the association between MAZ and the erythroid master regulator GATA1 in primary erythroid cells. Overall, 49% (864/1778) of erythroid-specific MAZ binding sites overlapped with GATA1 binding sites, consistent with a possible functional cooperative interaction between these 2 factors. Interestingly, this coassociation between MAZ and GATA1 was particularly prominent within erythroid enhancer regions, with GATA1 signal being particularly elevated at erythroid MAZ peaks within enhancers (Figure 6C, left panel) and, conversely, MAZ signal being stronger at GATA1 enhancer peaks (Figure 6C, right panel). Taken together, these findings suggest a particular functional cooperativity between MAZ and GATA1 at erythroid enhancer elements.
Discussion
In this study, a combination of biochemical characterization and unbiased proteomic screening led to the identification of the ubiquitously expressed zinc-finger protein MAZ as a factor binding to neighboring GC-rich sites within the human HBA promoters. Our ChIP-qPCR and ChIP-seq experiments subsequently confirmed in vivo binding of MAZ to the active HBA genes, promoters and enhancers of other key genes within the erythroid differentiation pathway, and genomic loci linked to clinical erythroid phenotypes. Moreover, erythroid-specific binding of MAZ was enriched at distal regulatory enhancer elements, where it frequently coassociated with the erythroid master regulator GATA1. We further showed that genetic variants within the MAZ locus were associated with phenotypic erythroid traits, including hematocrit and familial erythrocytosis. Of interest, MAZ is recruited to its own promoter (supplemental Figure 7A), and one of the variants, rs572982482, is located within this MAZ peak just between 2 MAZ canonical binding sequences, suggesting that this single-nucleotide polymorphism could interfere with autoregulation by MAZ of its own gene. In addition, familial erythrocytosis (associated with the rs11559000 single-nucleotide polymorphism in the MAZ locus) involves the EPOR gene encoding the receptor for erythropoietin,49 which we identify as a target of MAZ binding in erythroid cells (supplemental Table 5). Taken together, these findings reveal a previously unrecognized role for MAZ in the erythroid differentiation program.
Germline deletion of MAZ in mice results in perinatal lethality,50 as might be expected for a ubiquitously expressed TF. Recently, MAZ has been shown to be important for developmental hematopoiesis in zebrafish.14 Here, we showed that MAZ plays an important role during human erythropoiesis, with shRNA-mediated knockdown of MAZ impairing differentiation in primary erythroid cultures. Through integration of MAZ binding profiles from different cell types, we observed both common and erythroid-specific MAZ binding sites. Erythroid-specific MAZ binding is particularly enriched at distal regulatory elements, which are considered to be primary determinants of tissue-specific gene expression programs.32,51 Importantly, it has been shown that the activity of erythroid enhancer elements cannot be predicted based on the binding of the master regulators of erythroid differentiation, GATA1 and TAL1, alone.32 In contrast, combinatorial co-occupancy of enhancers by both lineage-specific and ubiquitously expressed TFs is a more reliable indicator of enhancer activity and cell-specific expression.32,51,52 Our findings suggest that binding of MAZ together with lineage-restricted factors such as GATA1 might be an important step in the activation or maintenance of many erythroid enhancer elements.
At present, it is unclear how binding of MAZ to its target sites is regulated. In particular, while MAZ is a ubiquitously expressed protein whose levels do not change dramatically during erythroid differentiation (supplemental Figures 6 and 10), we observed differential in vitro binding by MAZ to the 13/14 probe in EMSA, as well as a highly dynamic recruitment of MAZ to the HBA locus in primary erythroid cultures, suggesting that its binding is not primarily regulated at the level of expression. Further, the differential binding of MAZ in EMSA is also unlikely to be due to relative abundance of the other competing Sp/X-KLFs in the different cell lines (supplemental Figure 11).
Western blot with α-MAZ antibody detected several bands in K562 cells that were sensitive to MAZ shRNA (Figure 2C), suggesting the possibility that MAZ is subject to posttranslational modifications in these cells. Indeed, Ray and Ray showed that phosphorylation of MAZ exerted strong effects on DNA binding in the absence of changes in total protein levels. Moreover, it is clear that while some phosphorylation events enhance MAZ binding,53-55 phosphorylation at other sites actually decreases binding activity,56 suggesting that the regulation of MAZ by posttranslational modifications during erythroid differentiation is likely to be complex. In addition to posttranslational modifications, our data also support the potential for regulatory crosstalk between MAZ and other KLFs, including SP1, SP3, and KLF3, which can compete for the same binding sites in vitro and exhibit related binding motifs in global ChIP-seq profiles. Indeed, complex cross-regulatory interactions involving MAZ and SP1 have also been reported at other promoters.57,58
Overall, this study serves as an example of how a precise molecular characterization of protein binding at a single regulatory element can be combined with an unbiased generic proteomics method to identify new trans-acting regulators. This approach has revealed the zinc-finger TF MAZ as a previously unrecognized regulator of the erythroid differentiation program, which may be important for human erythroid phenotypic traits.
Acknowledgments
The authors thank Doug Higgs, Robert Beagrie, Michele Goodhardt, and Philipp Voigt for critically reading the manuscript and Dolores Lamb and Olga Medina-Martinez for helpful discussions. High-throughput sequencing was provided by Edinburgh Genomics (http://genomics.ed.ac.uk).
This work was supported by a University of Edinburgh Chancellor’s Fellowship to D.V. and Institute Strategic Grant funding to the Roslin Institute from the Biotechnology and Biological Sciences Research Council (BB/J004235/1 and BB/P013732/1). D.D. is supported by Roslin Institute core funding to D.V. D.G. was supported by the Medical Research Council (United Kingdom) and INSERM (France).
The study was also partly supported by Medical Research Council grants MR/S021140/1 and MR/R009341/1 and by the National Institute for Health Research Blood and Transplant Research Unit in Red Cell Products (IS-BTU-1214-10032).
The views expressed are those of the authors and not necessarily those of the National Health Service, the National Institute for Health Research, or the Department of Health and Social Care.
Authorship
Contribution: D.G. and D.V. developed the hypothesis; F.B., D.E.D., I.F.-V., D.C.J.F., M.L.H., V.S., J.A.S.-S., H.A., and D.G. performed experiments and/or collected data; D.D., F.B., D.E.D., I.F.-V., D.C.J.F., M.M., J.F., D.G., and D.V. analyzed and interpreted data; and D.D., J.F., D.G., and D.V. wrote the manuscript, which was revised and approved by all authors.
Conflict-of-interest disclosure: The authors declare no competing financial interests.
The current affiliation for D.G. is INSERM U976 Équipe 5, Institut de Recherche Saint Louis, Université de Paris, Paris, France.
Correspondence: Douglas Vernimmen, Roslin Institute and Royal (Dick) School of Veterinary Studies, University of Edinburgh, Easter Bush Campus, Midlothian EH25 9RG, United Kingdom; e-mail: douglas.vernimmen@roslin.ed.ac.uk; and David Garrick, INSERM U976 Équipe 5, Institut de Recherche Saint Louis, Université de Paris, 75010 Paris, France; e-mail: david.garrick@inserm.fr.
References
Author notes
D.G. and D.V. contributed equally to this study.
Chromatin immunoprecipitation sequencing datasets have been deposited with the NCBI Gene Expression Omnibus data bank under accession number GSE139281.
The full-text version of this article contains a data supplement.

