Key Points
Separating RFP+ and GFP+ thrombocytes from the GloFli fish developed here led to the analysis of their lipid composition.
DiI-labeled liposomes with similar PE and PC concentrations found in RFP+ thrombocytes explained DiI labeling of thrombocytes.
Abstract
Zebrafish thrombocytes are similar to mammalian platelets. Mammals have young platelets (also called reticulated platelets) and mature platelets. Likewise, zebrafish have 2 populations of thrombocytes; one is DiI-C18 (DiI)+ (DP), and the other is DiI− (DN). However, the mechanism of selective thrombocyte labeling by DiI is unknown. Furthermore, there is no transgenic zebrafish line where DP and DN thrombocytes are differentially labeled with fluorescent proteins. In this study, we found that Glo fish, in which the myosin light chain 2 promoter drives the rfp gene, have a population of thrombocytes that are red fluorescent protein (RFP) labeled. We also generated transgenic GloFli fish in which DP and DN thrombocytes are labeled with RFP and green fluorescent protein (GFP), respectively. Single-cell lipid analysis showed a twofold increase in phosphatidylethanolamine (PE) and a twofold decrease in phosphatidylcholine (PC) in RFP+ thrombocytes compared with GFP+ thrombocytes, suggesting that lipid composition may be important for DiI differential labeling. Therefore, we tested liposomes prepared with different ratios of PC and PE and observed that liposomes prepared with higher amounts of PE favor DiI labeling, whereas the PC concentration had a modest effect. In liposomes prepared using only PE or PC, increased concentrations of PE resulted in increased DiI binding. These results suggest that because RFP+ thrombocytes have higher PE concentrations, DiI may bind to them efficiently, thus explaining the selective labeling of thrombocytes by DiI. This work also provides GloFli fish that should be useful in understanding the mechanism of thrombocyte maturation.
Introduction
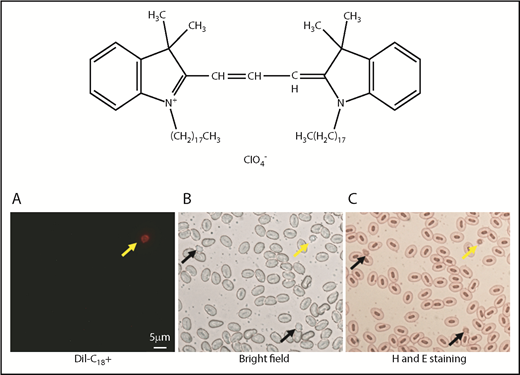
Zebrafish thrombocytes are similar to mammalian platelets.1 In mammals, there are 2 populations of platelets: young platelets (also called reticulated platelets) and mature platelets. Reticulated platelets are labeled specifically by a dye called thiazole orange (TO). By using a lipophilic fluorescent dye, DiI-C18 (DiI), it has been shown that at a specific DiI concentration, DiI labels a group of thrombocytes selectively.2,3 Therefore, in zebrafish, thrombocytes have been categorized as DiI+ (DP) cells and DiI− (DN) cells (Figure 1). It was also found that TO labeled only DP thrombocytes, suggesting that DP thrombocytes might be similar to the reticulated platelets found in mammals, because TO explicitly labels reticulated platelets.2 Furthermore, DiI also selectively labels reticulated platelets. In another report, it was noted that in a transgenic zebrafish line of Fli fish, TG (fli1: EGFP), in which the fli1 promoter drives the expression of a green fluorescent protein (GFP), less intense GFP+ cells are DP thrombocytes and more intense GFP+ cells are DN thrombocytes.4
DiI labeling of thrombocytes. Chemical structure of DiI (top). Bottom panels show red fluorescence (A), cells under bright field (B), and hematoxylin and eosin (H and E)–stained blood cells (C). Yellow and black arrows show DP and DN thrombocytes, respectively. DiI-labeled thrombocytes have red fluorescence.
DiI labeling of thrombocytes. Chemical structure of DiI (top). Bottom panels show red fluorescence (A), cells under bright field (B), and hematoxylin and eosin (H and E)–stained blood cells (C). Yellow and black arrows show DP and DN thrombocytes, respectively. DiI-labeled thrombocytes have red fluorescence.
It is well known that DiI labels cells when it is incorporated into the membrane and laterally diffuses to stain the cells.5,6 However, the mechanism of selective labeling of a population of thrombocytes by DiI is elusive. We hypothesized that membrane lipid composition might show differences between DP and DN thrombocytes and that this difference may be responsible for the selective labeling of a group of thrombocytes by DiI. Thus, to analyze the differences in lipid profiles between DP and DN thrombocytes, isolating pure populations of these thrombocytes is needed. Even though DiI labeling can differentiate DP and DN thrombocytes in vitro, it may not be equivalent to studying freshly prepared blood cells without any manipulation.7 Similarly, separating DP and DN thrombocytes as low- and high-intensity GFP+ thrombocytes from Fli fish may be difficult. Thus, to analyze the differences in lipid profiles between DP and DN thrombocytes, it would be ideal to have a transgenic line in which the DP and DN thrombocytes are labeled by different fluorescent proteins. Unfortunately, such a transgenic line is not available.
Because myosin light chain 2 (MLC2) is an essential protein that participates in platelet function, and because a transgenic line of Glo fish is generated with the plasmid pMYLZ2-RFP, which expresses a red fluorescent protein (RFP) under a mlc2 promoter (also known as mylz2 promoter in zebrafish), we hypothesized that Glo fish thrombocytes might express RFP.8,9 Interestingly, myosin light kinase that phosphorylates mlc2 has been shown to be present in zebrafish thrombocytes.10 Furthermore, because DP thrombocytes have more filopodia (P.J., unpublished data), and because a defect in MLC2 leads to lack of filopodial extensions in megakaryocytes, we also hypothesized that DP thrombocytes that have more filopodia than DN thrombocytes would be labeled with RFP.11 Also, because Fli fish have low-intensity GFP+ thrombocytes that are DP cells, mating Glo fish with Fli fish should result in a hybrid line where DP thrombocytes are RFP labeled (with low GFP) and DN thrombocytes should be GFP+ only. In this paper, we have generated such a transgenic line that differentially labels DP and DN thrombocytes with RFP and GFP, respectively. Using the RFP+ and GFP+ thrombocytes from this line, we analyzed the lipid profile by single-cell analysis and found that RFP+ thrombocytes have twice the amount of phosphatidylethanolamine (PE) than GFP+ thrombocytes and vice versa with respect to phosphatidylcholine (PC). We also generated liposomes with PC and PE and showed that DiI selectively labels liposomes with more PE and that RFP+ thrombocytes have more PE. In conclusion, we generated a transgenic line in which DP thrombocytes are labeled with RFP and DN thrombocytes are labeled with GFP. This line allowed us to determine the lipid profiles of these 2 types of thrombocytes and also provided us with an explanation for the mechanism of selective DiI labeling of DP thrombocytes.
Methods
Zebrafish husbandry
Adult transgenic TG (fli1: EGFP) Fli fish were a gift from Brant Weinstein’s laboratory (National Institutes of Health). CD41-GFP fish (CD41 fish) were obtained from Leonard Zon’s laboratory (Children’s Hospital, Boston). Glo fish were obtained from the Fish N Chirps Pet Center (Denton, TX) and maintained at 28°C in the circulating system of deionized water that was supplemented with Instant Ocean. Fish were kept in a 10-hour dark and 14-hour light cycle and fed with brine shrimp and flakes. For fish breeding, 1 male Fli fish or CD41 fish and 1 female Glo fish were placed in a breeding tank overnight separated by a separator. The next morning, when the light turned on, the separator was removed. After the fish laid eggs, the eggs were directly collected and kept in E3 medium (5 mM NaCl, 0.17 mM KCl, 0.33 mM MgSO4, 0.33 CaCl2.2H2O, and 0.1% methylene blue). From 4 days postfertilization (dpf) to 15 dpf, the larvae were fed with live paramecium, and at 10 dpf, brine shrimp was included in their diet.
Analysis of Glo fish
Genomic DNA was isolated from the tail clip of commercially purchased adult Glo fish. The tail clip was incubated in 50 µL DNA extraction buffer (50 mM KCl, 10 mM Tris [pH 8.5], 0.01% gelatin, 0.45% NP-40, 0.45% Tween20, and 5 mM EDTA) with 0.5 µL proteinase K (20 mg/mL) overnight at 55°C and then at 96°C for 10 minutes to inactivate proteinase K; 2 µL of this DNA was amplified by polymerase chain reaction (PCR) using the 1-Drop PCR Mix (101Bio, Palo Alto, CA) with the primers 5′-CCATCACTTTCCCCCTACCT-3′ (from the mylz2 promoter region) and 5′- GGGTGCTTCACGTACACCTT-3′ (from the rfp section) that flanked the target site. Amplified DNA of predicted 406 bp was resolved on 1.2% agarose gel electrophoresis, extracted, and sent for sequencing (Genewiz; South Plainfield, NJ). The sequence was compared with the pMYLZ2-RFP sequences using NCBI BLAST.
Blood collection
On a clean paper towel, the zebrafish was placed on its lateral side, and the skin surface was gently wiped with Kim wipes. After making a lateral incision between the ventral and dorsal fins and between the second and fourth black stripes from the dorsal end on the lateral side of the fish, blood was collected using a pipette tip and then used in further experiments. The above procedure was approved by the Institutional Animal Care and Use Committee of the University of North Texas, and animal experiments were performed in compliance with institutional guidelines.
Blood smears
For the blood smear, 1.0 µL blood was added on a clean microscope slide. A second slide was placed on the top of the first slide at a 30° to 40° angle away from the blood drop, and the slide was moved toward the drop until the edge of the spreader slide touched the blood drop. The spreader slide was then pushed forward rapidly using a light and smooth motion. The slide was left to dry completely. To stain blood cells, 4 separate 50-mL conical centrifuge tubes were placed in the following order in the reagents described below: methanol fixative (Thermo Fisher Scientific, Waltham, MA), eosin and hematoxylin stain (Biocare Medical, Pacheco, CA), and distilled water. First, the blood smear slide was dipped in the methanol fixative with an up-and-down motion for 30 seconds. Next, the blood smear slide was rinsed with distilled water. Finally, the slide was dipped up and down in the eosin and hematoxylin stain for 30 seconds, followed by a water rinse. The slide was let to air-dry in a vertical position and observed under a microscope.
Fluorescence microscopy and flow cytometry
Bright-field images of the blood smears were captured under a fluorescence microscope (Nikon ECLIPSE 80i). Fluorescence images of GFP-labeled and RFP-labeled thrombocytes were obtained with excitation at 450 to 490 nm and 510 to 560 nm, respectively. DiI-labeled liposomes were kept under a coverslip, and the red fluorescence images were captured with excitation at 510 to 560 nm. Flow cytometry was used for thrombocyte analysis. In a 1.5-mL Eppendorf tube, 1 µL zebrafish blood was added into 200 µL 1× phosphate-buffered saline (PBS). Thrombocytes labeled with GFP and RFP were detected by using FL1 and FL2 channels, respectively. The percentages of RFP-labeled and GFP-labeled thrombocytes were obtained using the gating strategy.
Cell extraction and MALDI-LTQ-Orbitrap analysis
From an adult GloFli fish, 2 µL blood was collected into 0.5 µL 3.8% sodium citrate in an Eppendorf tube, and 100 µL 1× PBS was added. The contents were vortexed, and the diluted blood sample was pipetted to fill the depression slide. The 3 thrombocytes were extracted using an L200 nanomanipulator workstation (DCG Systems, Fremont, CA),12-14 which was mounted to an inverted Nikon TE2000-U microscope and is equipped with a C-HGFI fluorescence source for fluorescence microscopy. The nanomanipulator is connected to a 60-psi nitrogen gas pressure injector (MicroData Instrument, South Plainfield, NJ) with 2 nanopositioners.14 The capillary tip in the nanopositioner was backfilled with 8 µL of a 2:1 chloroform/methanol (vol/vol) solution. The matrix solution for matrix-assisted laser desorption/ionization (MALDI), 8 µL of 20 mg/mL 2,5 dihydroxybenzoic acid solution in 3:2 acetonitrile/water (vol/vol), was backloaded to the second nanopositioner.15 The nanopositioner was directed toward the fluorescent thrombocytes of interest using the control joysticks. Three of the individual thrombocytes were then aspirated into the capillary tip under 20 psi of the pressure injector. The depression slide was then removed to bring extracted nanopositioner to contact with the glass slide, and the extract was ejected from the emitter under 1 psi pressure. The sample was allowed to dry with additional pulse spotting. Three replicates each for RFP+ and GFP+ thrombocytes were extracted, and control was codeposited on each spot by adding 1 µL of 100 µg/mL L-α-phosphatidylcholine standard (PC-16:0/18:2; Sigma-Aldrich, St. Louis, MO) dissolved in chloroform. Subsequently, the sample spot was fully covered with the matrix using the second nanopositioner under the same pressure-ejection parameters. The extract of fluorescent thrombocyte was analyzed using MALDI-LTQ-Orbitrap (Thermo Scientific, San Jose, CA), which was equipped with a pressure MALDI source (75 mTorr) and a 337-nm N2 laser (MNL 100; Lasertechnik, Berlin, Germany).12,13 The following conditions of the instrument were set in our experiment: 15 µJ energy for each laser shot, 5 laser shots per spectra, and 50 µm step size for laser raster motion. The data obtained were collected in positive ion mode, mass/charge (m/z) 700 to 1000 of mass range, and 100 000 mass resolution. The acquired mass spectra were processed and plotted using Xcalibur v 2.2 and PIS-Plot software, respectively.12,13 The lipid spectra were represented as mol % of the PC control. Using the average mol % of the lipids from 3 replicates, the standard error of the mean was calculated. Analysis of variance was used to determine the P values when comparing the differences between the concentration of lipids from RFP+ and GFP+ thrombocytes. For proper identification of molecular species, we subjected selected peaks for fragmentation analysis either as protonated [M+H]+ form or as [M+Na]+ adduct (where M is the neutral mass of the lipid) by tandem mass spectrometry using collision-induced dissociation with higher resolution capabilities of MALDI.
Preparation of liposomes and DiI labeling
PC and PE from egg yolk were obtained from Sigma-Aldrich. First, 2 mM of each lipid was dissolved in 1 mL chloroform. Then, we pipetted various volumes of this lipid solution at different ratios in 15-mL conical centrifuge tubes as follows: PC 100 µL, PC 200 µL, PE 100 µL, PE 200 µL, PC 100 µL and PE 100 µL, PC 200 µL and PE 100 µL, PC 100 µL and PE 200 µL, and PC 200 µL and PE 200 µL. The chloroform was evaporated under a nitrogen stream until the samples were dry. The samples were then suspended in 500 µL of 50 mM of N-2-hydroxyethylpiperazine-N′-2-ethanesulfonic acid saline buffer (pH 7.0), kept on ice, and emulsified by sonication at 60% pulse at setting 2 for 1 minute using a Branson Sonifier 250.15,16 The liposomes were then labeled with DiI as follows: 1.86 mg DiI (Thermo Fisher Scientific, Waltham, MA) was dissolved in 200 µL dimethylformamide; 1 mL PBS in a 15-mL conical centrifuge tube was vortexed, and while vortexing, 2 µL of the above DiI solution was slowly added to this PBS; then, 10 µL of the vortexed DiI solution was added to 100 µL emulsified liposomes and either observed under a microscope or subjected to flow cytometry.
Results
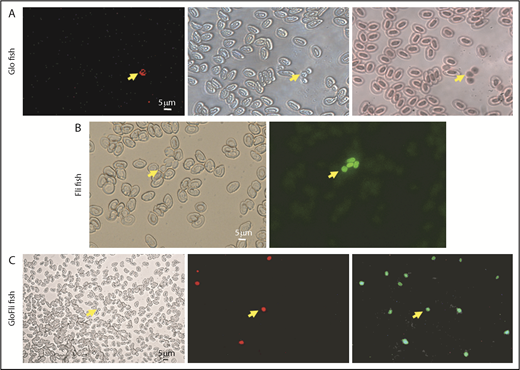
Because we obtained the Glo fish from a commercial source, we wanted to test whether these fish had the rfp gene driven by the mylz2 promoter. Therefore, we prepared genomic DNA from Glo fish and, using the primers derived from mylz2 promoter area and the rfp section, amplified the DNA. The amplified product was sequenced and compared with the published sequences. The sequences confirmed that the commercially purchased Glo fish indeed carried the transgene that was reported earlier (supplemental Figure 1).17,18 To test our hypothesis that the zebrafish mylz2 gene promoter is expressed in circulating thrombocytes, we prepared a smear of Glo fish blood, examined the blood cells under a fluorescence microscope, and took red fluorescence images. Subsequently, the slide was stained with eosin and hematoxylin to identify in the blood smear the type of blood cell that has red fluorescence. The images of stained blood cells were captured and compared with the red fluorescence images. The coordinates on the microscope stage were used as a guide to obtain the images of the same field before and after staining. Such capturing of images before and after staining was needed because the staining procedure affects RFP fluorescence. We found that similar to the result of DiI labeling, where only DP thrombocytes are labeled (Figure 1), the red fluorescent cells were thrombocytes, and all thrombocytes were not labeled with RFP (Figure 2A).
Characterization of Glo fish and GloFli fish. (A) Identification of fluorescent thrombocytes in Glo fish. From left to right are images of blood cells in a smear under red fluorescence, cells under bright field, and hematoxylin and eosin–stained cells obtained from Glo fish. Arrows show RFP+ thrombocytes. (B) Identification of GFP+ thrombocytes in Fli fish. From left to right are images of blood cells in a smear from Fli fish under bright field and green fluorescence. Arrows show GFP+ thrombocytes. (C) Identification of DP and DN thrombocytes in GloFli fish. From left to right are images of a blood smear from GloFli fish showing DP and DN thrombocytes, under bright field, red fluorescence, and green fluorescence. Arrows show DP (GFP+/RFP+) and DN thrombocytes (GFP+/RFP−).
Characterization of Glo fish and GloFli fish. (A) Identification of fluorescent thrombocytes in Glo fish. From left to right are images of blood cells in a smear under red fluorescence, cells under bright field, and hematoxylin and eosin–stained cells obtained from Glo fish. Arrows show RFP+ thrombocytes. (B) Identification of GFP+ thrombocytes in Fli fish. From left to right are images of blood cells in a smear from Fli fish under bright field and green fluorescence. Arrows show GFP+ thrombocytes. (C) Identification of DP and DN thrombocytes in GloFli fish. From left to right are images of a blood smear from GloFli fish showing DP and DN thrombocytes, under bright field, red fluorescence, and green fluorescence. Arrows show DP (GFP+/RFP+) and DN thrombocytes (GFP+/RFP−).
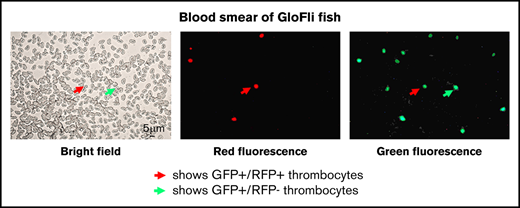
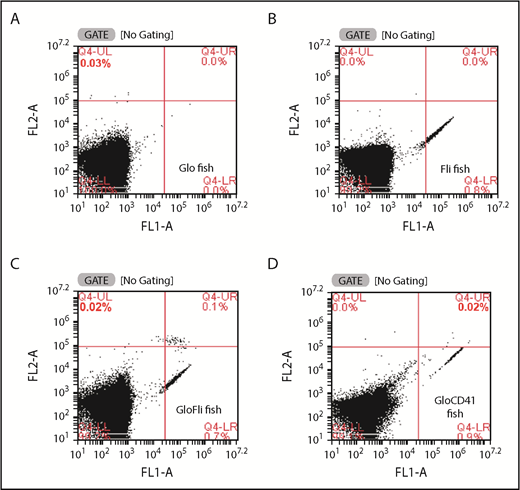
We then crossed the Glo fish that had RFP+ thrombocytes with Fli fish that had all GFP+ thrombocytes (Figure 2B). We predicted that in the progeny F1 fish, there would be both RFP+ and GFP+ thrombocytes, and as expected, we found that the blood smear of F1 fish showed both types of labeled thrombocytes as described above (Figure 2C). We called these F1 fish containing both RFP-labeled and GFP-labeled thrombocytes GloFli fish. In this fish, DP thrombocytes are RFP+GFP+, and DN thrombocytes are GFP+ only. Because we know that low- and high-intensity GFP thrombocytes are DP and DN thrombocytes, respectively, we checked under the microscope to test whether the RFP+ thrombocytes were low-intensity GFP thrombocytes. Even though it was possible to distinguish the intensities of RFP and low GFP fluorescence when observed with the naked eye under the microscope, it was difficult to recognize them in the photograph (Figure 2C). Therefore, we performed flow cytometry on the GloFli fish blood cells. The dot plots of FL1 (GFP fluorescence) vs FL2 (RFP fluorescence) of thrombocytes are shown as side scattering in Figure 3. Gates were placed such that thrombocytes could be identified according to their fluorescence intensities. Glo fish (Figure 3A) and Fli fish (Figure 3B) showed 0.03% of RFP+ (gate UL) and 0.8% GFP+ (gate LR) thrombocytes, respectively. GloFli fish (Figure 3C) showed 0.1% of double-labeled (RFP+GFP) thrombocytes in gate UR. In these double-labeled thrombocytes, GFP fluorescence was relatively low compared with the GFP+ thrombocytes (in gate LR). We also bred Glo fish with CD41 fish, and the thrombocytes from the resulting GloCD41 fish were analyzed by flow cytometry. We found that GloCD41 fish blood had a similar number of double-labeled thrombocytes (Figure 3D) but fewer double-positive cells (0.02%) compared with GloFli fish blood. We also noted that the fluorescence intensities of GFP+ cells was much stronger in GloCD41 fish than in GloFli fish.
Analysis of GloFli fish thrombocytes by flow cytometry. Representative dot plots show the presence of GFP+ and RFP+ thrombocytes in whole blood of Glo fish (A), Fli fish (B), GloFli fish (C), and GloCD41 fish (D). FL1 and FL2 channels are shown as FL1-A and FL2-A on the x-axis and y-axis, respectively. Forward scattering in FL1 and FL2 channels measures green and red fluorescence from GFP+ and RFP+ thrombocytes and is shown in Q4-LR and Q4-UL gates, respectively. DP thrombocytes (GFP+/RFP+) are shown in the Q4-UR gate. The percentages of thrombocytes are shown in the respective gates. The large percentage of cells shown in Q4-LL (lower left quadrangle) gates represents other blood cells. Gating was according to the fluorescence intensities of thrombocytes in the side scattering.
Analysis of GloFli fish thrombocytes by flow cytometry. Representative dot plots show the presence of GFP+ and RFP+ thrombocytes in whole blood of Glo fish (A), Fli fish (B), GloFli fish (C), and GloCD41 fish (D). FL1 and FL2 channels are shown as FL1-A and FL2-A on the x-axis and y-axis, respectively. Forward scattering in FL1 and FL2 channels measures green and red fluorescence from GFP+ and RFP+ thrombocytes and is shown in Q4-LR and Q4-UL gates, respectively. DP thrombocytes (GFP+/RFP+) are shown in the Q4-UR gate. The percentages of thrombocytes are shown in the respective gates. The large percentage of cells shown in Q4-LL (lower left quadrangle) gates represents other blood cells. Gating was according to the fluorescence intensities of thrombocytes in the side scattering.
To characterize the membrane lipids in RFP+ and GFP+ thrombocytes, we performed single-cell lipid analysis. We extracted 3 individual RFP+ and GFP+ thrombocytes distinguishable by the fluorescence separately using a nanomanipulation method. The MALDI-Orbitrap-MS was used to analyze the extracted thrombocytes. The mass spectrum for each sample (Figure 4A-B) was analyzed by comparing with searchable databases, LIPID MAPS for lipid identification with m/z values between 700 and 1000.12 This range was mainly chosen because the major lipid class of PC and PE were within this range. Table 1 shows the categories of lipids found in the thrombocytes. Figure 4A-B shows the representative mass spectra of the lipids with m/z values between 700 and 1000. We found that the differences between RFP+ and GFP+ thrombocytes were in glycerophospholipids with m/z values of 859.61 and 860.62. The results of the spectrum with m/z 860.62 showed a subclass of glycerophospholipids that were twice more abundant in DN thrombocytes compared with DP thrombocytes (Figure 4C) and (Table 1). For proper identification of the molecular species, we selected the peaks with m/z values of 859.61 and 860.62, which were subjected to fragmentation analysis by tandem mass spectrometry. The peak with an m/z value of 860.62 yielded fragments with m/z values of 801.54, 677.55, and 283.71, and the peak with an m/z value of 859.61 yielded fragments with m/z values of 815.50 and 283.71. These fragments suggested that the peaks with m/z values of 859.61 and 860.62 corresponded to PE (18:0/25:5) and PC (18:0/23:0), respectively.
Single-cell lipid analysis of DP and DN thrombocytes by MALDI mass spectrometry. (A-B) Section of lipid profile mass spectrum peaks and their intensities obtained from high-intensity GFP+ thrombocytes (DN thrombocytes) and RFP+ low-intensity GFP+ thrombocytes (DP thrombocytes), respectively, by MALDI-LTQ-Orbitrap [M+Na]+ or [M+H]+. Labels on top of the peaks indicate m/z values. (C) Intensity of mass spectrum peaks representing lipids that were >1%, from DP and DN thrombocytes shown in Table 1. The numbers adjacent to the listed lipids are m/z values. The peaks from DN and DP thrombocytes for glycerophospholipids (PE) with an m/z value of 859.61 and glycerophospholipids (PC) with an m/z value of 860.62 showed significant differences. The respective P values are P < .001 and P < .007 for 3 replicates. The comparison of peak intensities for the sphingolipid-glycerophospholipid with an m/z value of 867.67 did not show any significant difference (ns, not significant; P = .47). Error bars represent standard error of the mean.
Single-cell lipid analysis of DP and DN thrombocytes by MALDI mass spectrometry. (A-B) Section of lipid profile mass spectrum peaks and their intensities obtained from high-intensity GFP+ thrombocytes (DN thrombocytes) and RFP+ low-intensity GFP+ thrombocytes (DP thrombocytes), respectively, by MALDI-LTQ-Orbitrap [M+Na]+ or [M+H]+. Labels on top of the peaks indicate m/z values. (C) Intensity of mass spectrum peaks representing lipids that were >1%, from DP and DN thrombocytes shown in Table 1. The numbers adjacent to the listed lipids are m/z values. The peaks from DN and DP thrombocytes for glycerophospholipids (PE) with an m/z value of 859.61 and glycerophospholipids (PC) with an m/z value of 860.62 showed significant differences. The respective P values are P < .001 and P < .007 for 3 replicates. The comparison of peak intensities for the sphingolipid-glycerophospholipid with an m/z value of 867.67 did not show any significant difference (ns, not significant; P = .47). Error bars represent standard error of the mean.
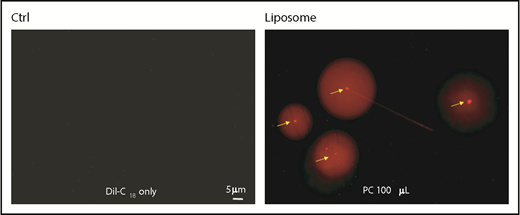
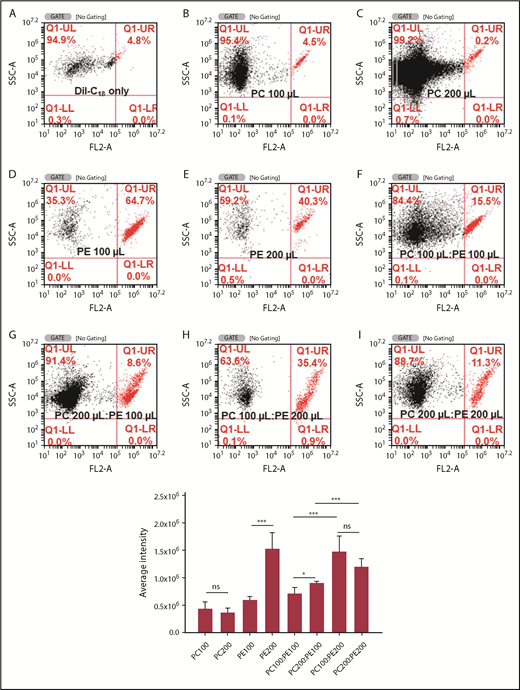
Because there was a significant difference in PC and PE between RFP+ and DFP+ thrombocytes, this prompted us to examine whether the concentration of PC in the membrane is the reason for DiI selective labeling of DP thrombocytes. To address this issue, we prepared liposomes with different PC and PE concentrations and then labeled them with DiI. When we observed the liposomes under the fluorescence microscope, we found that the liposomes, particle-like structures with intense fluorescence, varied in diameter (Figure 5), ranging from 200 nm to almost 1 μm. Interestingly, we found a halo around each liposome. We then quantified the fluorescence intensities of these DiI-labeled liposomes prepared with different ratios of PC and PE particles by flow cytometry. Gates were placed to distinguish labeled and unlabeled liposomes using separate quadrangles. We found that different concentrations of PC and PE yielded variable levels of DiI-labeled liposomes (Figure 6). Overall, a higher concentration of PC alone did not significantly alter DiI binding. However, an increased level of PE alone significantly increased DiI binding to liposomes (Figure 6). We then studied the efficiency of DiI binding to liposomes that were prepared with various combinations of PC and PE. We found that PC seems to have minimal effect in the presence of PE, and PE appeared to play a significant role in DiI binding (Figure 6).
DiI labeling of liposomes. Fluorescence images of liposomes prepared with PC (right panel). Arrows show individual DiI-labeled liposomes. Note the halo surrounding each liposome. DiI in buffer alone as a control (Ctrl) without liposomes.
DiI labeling of liposomes. Fluorescence images of liposomes prepared with PC (right panel). Arrows show individual DiI-labeled liposomes. Note the halo surrounding each liposome. DiI in buffer alone as a control (Ctrl) without liposomes.
Analysis of DiI-labeled liposomes by flow cytometry. Representative dot plots of DiI-labeled liposomes that are included in the upper right gate (top). Fluorescence was measured in the FL2 (red) channel. Liposomes were prepared with DiI alone (A), PC 100 µL (B), PC 200 µL (C), PE 100 µL (D), PE 200 µL (E), PC 100 µL:PE 100 µL (F), PC 200 µL:PE 100 µL (G), PC 100 µL:PE 200 µL (H), and PC 200 µL:PE 200 µL (I) (shown in the upper right quadrangle). Bar graph shows the average fluorescence intensity of 6 experiments (n = 6) of DiI binding to liposomes prepared with the above PC and PE ratios. The numbers by the side of PE and PC show the lipid volume used to prepare liposomes (µL). ***P < .001; *P < .013. Error bars represent standard error of the mean. SSC-A, side scatter.
Analysis of DiI-labeled liposomes by flow cytometry. Representative dot plots of DiI-labeled liposomes that are included in the upper right gate (top). Fluorescence was measured in the FL2 (red) channel. Liposomes were prepared with DiI alone (A), PC 100 µL (B), PC 200 µL (C), PE 100 µL (D), PE 200 µL (E), PC 100 µL:PE 100 µL (F), PC 200 µL:PE 100 µL (G), PC 100 µL:PE 200 µL (H), and PC 200 µL:PE 200 µL (I) (shown in the upper right quadrangle). Bar graph shows the average fluorescence intensity of 6 experiments (n = 6) of DiI binding to liposomes prepared with the above PC and PE ratios. The numbers by the side of PE and PC show the lipid volume used to prepare liposomes (µL). ***P < .001; *P < .013. Error bars represent standard error of the mean. SSC-A, side scatter.
Discussion
In this paper, we found that the mlc2 promoter is expressed strongly in DP thrombocytes, but not in DN thrombocytes, of Glo fish. In mammalian platelets, it has been shown that MLC2 participates in shape change.19 Because DP thrombocytes are more active and produce robust filopodia (P.J., unpublished data), stronger mlc2 promoter activity does correlate with the activity of DP thrombocytes.2 In fact, differences in promoter activity have been noted earlier in DP and DN thrombocytes.4,20 We hypothesized that the Glo fish breeding with Fli fish would give both RFP+ and GFP+ thrombocytes, and as predicted, our results showed that the GloFli fish thrombocytes are labeled by RFP and GFP. This GloFli fish should be useful in analyzing biochemical variations between DP and DN thrombocytes not only by fluorescence-activated cell sorting for large-scale studies (with the limitation of slight contamination) but also by single-cell analysis, similar to the study of lipids in this paper. This fish can also be used to analyze the RNA content of these thrombocytes as well as their half-life. Single-cell analysis of many different types of cells has been performed earlier.21,22 However, this is the first application of such analysis to thrombocytes.
GloFli fish and GloCD41 fish showed double-labeled thrombocytes. However, there were differences in the percentage of DP thrombocytes between these 2 transgenic lines. These differences could be due to strain variation or normal variation in the population. Future analysis of more of these fish should establish the actual percentages of these DP thrombocytes. GFP fluorescence was higher in GloCD41 fish than GloFli fish. This difference in fluorescence is possible because of the 2 different promoters driving the GFP. Thus, the use of both these lines should separate the 2 thrombocyte populations and help us understand the mechanisms of thrombocyte development and maturation. For example, chromatin changes in cells have been studied in the past and more recently with various chromatin-capture techniques.23 Now, with the availability of GloFli and GloCD41 fish, it should be possible to apply these methods to understand changes in the chromatin structure of specific regions of critical regulatory genes during thrombocyte maturation. Also, because it has been demonstrated that there are thrombocyte precursors in the kidney marrow, the GloFli fish kidney could be studied to see what other thrombocyte precursors will be labeled by RFP and GFP.
Even though the classical biochemical extractions of lipids and analysis in platelets yielded excellent results, studies on differences in lipid composition of young and mature platelets have not been performed.24 This study performed lipid analysis of RFP+ and GFP+ thrombocytes for the first time. Also, in this study, with only a few thrombocytes, it was possible to find changes in glycerophospholipids in these thrombocytes. Thus, single-cell analysis of lipids in thrombocytes with a nanomanipulator coupled to mass spectrometry appears to be highly sensitive.12-14 In our analysis, because we used 2 stages of thrombocyte development, we used PC as a control, and lipids were represented as a relative percentage of this control PC. Interestingly, several classes of lipids (Figure 4C) showed identical percentages. Thus, the quantification and changes observed in lipid composition between RFP+ and GFP+ thrombocytes seem to be real and reliable.
We observed a twofold increase in PE and PC in RFP+ and GFP+ cells, respectively. In our liposome-labeling experiments, higher PE concentrations seemed to increase DiI binding, whereas higher PC concentrations did not alter DiI binding. However, DiI binding to PC liposomes was lower than DiI binding to PE liposomes. In DP cells, the PC concentration is lower compared with DN cells. The results of DiI binding to liposomes are consistent with the selective DiI labeling of DP thrombocytes. Thus, we propose that when the PC concentration is low and the PE concentration is high, membrane phospholipids are not tightly packed in DP thrombocytes and are thus are amenable to the entry of DiI.
In summary, we have generated a transgenic line that has DP and DN thrombocytes labeled with RFP and GFP, respectively. We used this zebrafish line to select RFP+ and GFP+ thrombocytes using a nanomanipulator, and lipids were extracted from single thrombocytes to analyze differences between the lipids of RFP+ and GFP+ thrombocytes. We found that PE and PC concentrations were greater in RFP+ and GFP+ thrombocytes, respectively. Interestingly, the DiI-labeled the liposomes prepared with greater PE concentrations more effectively compared to the liposomes prepared with greater PC concentrations. These results suggest that differences in lipid content between DP and DN thrombocytes may be the reason for the specific labeling of DP thrombocytes.
For original data, please contact jag@unt.edu. GloFli fish and GloCD41 fish are available from our laboratory and will be deposited at the University of Oregon Zebrafish International Resource Center.
The full-text version of this article contains a data supplement.
Acknowledgments
The authors thank Rekha Panapakam for proofreading the manuscript.
This work was supported by funds from the University of North Texas and the National Institutes of Health, National Institute of Diabetes and Digestive and Kidney Diseases (DK117384).
Authorship
Contribution: P.J. designed the research, analyzed the data, and wrote the paper; G.F.V. analyzed the data and participated in discussions; and W.F. and I.W.D.S. performed research involving genetic and biochemical experiments.
Conflict-of-interest disclosure: The authors declare no competing financial interests.
Correspondence: Pudur Jagadeeswaran, Department of Biological Sciences, University of North Texas, 1511 West Sycamore St, Denton, TX 76203; e-mail: jag@unt.edu.

![Figure 4. Single-cell lipid analysis of DP and DN thrombocytes by MALDI mass spectrometry. (A-B) Section of lipid profile mass spectrum peaks and their intensities obtained from high-intensity GFP+ thrombocytes (DN thrombocytes) and RFP+ low-intensity GFP+ thrombocytes (DP thrombocytes), respectively, by MALDI-LTQ-Orbitrap [M+Na]+ or [M+H]+. Labels on top of the peaks indicate m/z values. (C) Intensity of mass spectrum peaks representing lipids that were >1%, from DP and DN thrombocytes shown in Table 1. The numbers adjacent to the listed lipids are m/z values. The peaks from DN and DP thrombocytes for glycerophospholipids (PE) with an m/z value of 859.61 and glycerophospholipids (PC) with an m/z value of 860.62 showed significant differences. The respective P values are P < .001 and P < .007 for 3 replicates. The comparison of peak intensities for the sphingolipid-glycerophospholipid with an m/z value of 867.67 did not show any significant difference (ns, not significant; P = .47). Error bars represent standard error of the mean.](https://ash.silverchair-cdn.com/ash/content_public/journal/bloodadvances/3/9/10.1182_bloodadvances.2018023960/2/m_advances023960f4.png?Expires=1763610551&Signature=l-ZSxQ4lZE1L2qF45AXQrmLmjzYnL95I3HF~Xomu9PcjFbRLTVXpheWn~OseUfJGYnhPz0~j6GxFJEaq2UqjbuFI90Q90at~dbt9gaF~VnX9Od0s85JUbK1xZrWXInYlmN6PjrqSnIrYtbJgPC-GXB1Hdaii1zUaUBeG-2gYVb64dJeE1tzDjx5Bmc57D51naIdRb5w77WthR~wuQx9~bu60zYTojIOXmgjVMvlBKP4MolMZyZiorTo9FrK52LJkoc8D7i3fT8WzmqC2pZLic083230b1s7xcwwXAYqK6eUd5Ms3BSuWVMf33Ejh0s49BBgGCiyWPOQOBHMVG23wjg__&Key-Pair-Id=APKAIE5G5CRDK6RD3PGA)
