The Polycythemia Vera Study Group (PVSG) was organized in 1967 to identify the optimal approach to the diagnosis and treatment of polycythemia vera (PV). Nevertheless, a systematic assessment of US physicians' approach to PV has not been performed. To determine practice patterns in the management of PV, a random sample of the US American Society of Hematology (ASH) membership was surveyed. Thirty-three percent of 3000 surveys were returned. Significant variations in diagnostic and therapeutic approach were evident by region, practice type, specialty, and clinical experience. Red cell volume determinations (78% of respondents), serum erythropoietin levels (76%), and arterial blood gases (75%) were the most frequent tests used in the diagnosis of PV. Sixty-nine percent of physicians use phlebotomy as their first choice for erythrocytosis. Phlebotomy plus hydroxyurea (27.8%) and hydroxyurea alone (10%) were used less often. Despite PVSG recommendations, almost 16% of physicians used a target hematocrit of 0.55 (50%) or 0.55 (55%) for phlebotomy therapy. Eighty-two percent of physicians treated thrombocytosis only when platelet counts exceeded 1000 × 109/L (1 000 000/μL) or in the event of symptoms. Hydroxyurea (62.8%) and anagrelide (35.4%) were the primary agents used to treat thrombocytosis. Thus, this national survey of US hematologists and oncologists has identified substantial variation in the approach to the diagnosis and treatment of PV. A significant minority of physicians undertreat erythrocytosis, and little consensus exists regarding the treatment of thrombocytosis.
Introduction
Polycythemia vera (PV) is a chronic myeloproliferative disorder characterized by panmyelosis, splenomegaly, and a predisposition to venous/arterial thrombosis, myelofibrosis, and acute leukemia. Vaquez is credited with the initial description of PV in 1892.1 Osler's case series published in 1903 further delineated the clinical features of PV and differentiated it from other entities characterized by erythrocytosis.2 Over the subsequent 6 decades considerable information on the diagnosis and treatment of PV was amassed but, nevertheless, little consensus or uniformity in approach was achieved.3 In 1967, the Polycythemia Vera Study Group (PVSG) was organized to identify the optimal approach to the diagnosis and treatment of PV.4 To achieve this goal, the PVSG conducted several multicenter trials comparing phlebotomy with chemotherapy and radiotherapy in the management of erythrocytosis and the efficacy of aspirin in prevention of thrombosis.5 6Since the completion of these studies, no systemic assessment of the impact of the PVSG on the routine management of PV by hematologists and oncologists in the United States has been performed. To determine practice patterns in the management of PV, we conducted a nationwide survey of US American Society of Hematology (ASH) members on their approach to the diagnosis and treatment of PV. Our findings demonstrate that significant differences exist among physicians with respect to the appropriate management of PV.
Methods
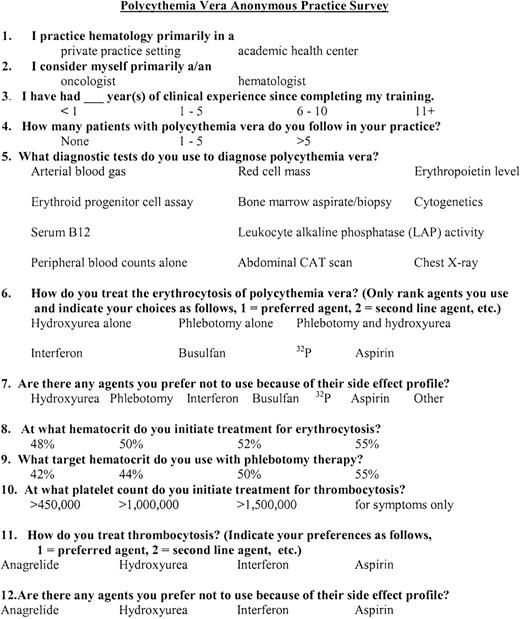
A one-page anonymous questionnaire on the diagnosis and treatment of PV was mailed to 3000 randomly selected US ASH members between July 21, 1999, and July 28, 1999 (Figure1). ASH members who were unlikely to treat PV (ie, pediatric hematologists/oncologists, pathologists, and physicians in the biotechnology or pharmaceutical industry) were excluded from the target population. Each survey was sent with a short letter of introduction as well as return postage. For convenience, a fax number was also included. All returned surveys were included in the data set unless the respondent failed to respond to any of the diagnosis and treatment questions. Failure to respond to all the demographic items was not considered sufficient reason to exclude survey data. Regional location of respondents was determined by postal marks or area codes. After examining the frequency distribution of individual variables, contingency tables were constructed to analyze the relationship between dependent (diagnostic and therapeutic modalities) and independent variables (respondent characteristics). The Pearson χ2 test was used to assess whether significant differences in practice existed between respondents. Comparisons between individual subgroups were performed using a 2-sample test of proportions. Statistical analysis was performed using SPSS (Windows version 10.0, SPSS, Chicago, IL).
The United States American Society of Hematology Polycythemia Vera Practice Survey.
The United States American Society of Hematology Polycythemia Vera Practice Survey.
Results
Population demographics
Of 3000 mailed surveys, 1006 were returned, for a response rate of 33.5%. Twelve surveys (1.2%) were returned substantially or completely blank. The characteristics of the respondent population are listed in Table 1. In general, respondents were more likely to be from the East, in private practice, specializing in either hematology or oncology with more than 10 years of clinical experience since completing training, and have more than 5 patients with PV in their practice. Physicians in private practice (65.1% vs 47.7% in academic practices, P < .0001) and those with more than 10 years of posttraining clinical experience (65.4% vs 55.2% with 6-10 years experience, P = .02, and 31.2% with 1-5 years experience, P < .0001) were more likely to have more than 5 PV patients in their practice. No differences were noted by specialty. Physicians in academic practice were more likely to be hematologists (64.4% vs oncologists, 30%,P < .0001), while physicians in private practice were more likely to be oncologists (45% vs hematologists, 23%,P < .0001). No differences among specialties in clinical experience or regional differences in practice type, specialty, clinical experience, or number of PV patients in the practice were identified. The distribution of the respondent population was similar to the distribution of US ASH members (Table 1, unpublished data, courtesy of Michelle Moody, ASH, 1999).
Survey respondent characteristics
| Characteristic . | No. of respondents . | Percentage of responses* . |
|---|---|---|
| Location (region in US, %) | ||
| Northeast | 257 | 28.6 (25.3) |
| Southeast | 242 | 26.9 (25) |
| Midwest | 159 | 17.7 (22.8) |
| Southwest | 87 | 9.7 (9) |
| West | 154 | 17.1 (17.9) |
| Practice type | ||
| Private | 626 | 62.2 |
| Academic | 372 | 37 |
| Specialty | ||
| Hematology | 420 | 43.1 |
| Oncology | 356 | 36.5 |
| Hematology/oncology | 199 | 20.4 |
| Clinical experience† | ||
| 1 to 5 years | 151 | 15.2 |
| 6 to 10 years | 149 | 15 |
| More than 10 years | 694 | 69 |
| No. of PV patients in practice | ||
| None | 38 | 3.9 |
| 1 to 5 patients | 364 | 37.4 |
| More than 5 patients | 570 | 58.6 |
Percentages are based on the number of respondents who completed each item. Values in parentheses represent the percentage of the ASH membership residing in the region.
Defined as the number of years since completion of training.
Diagnosis of polycythemia vera
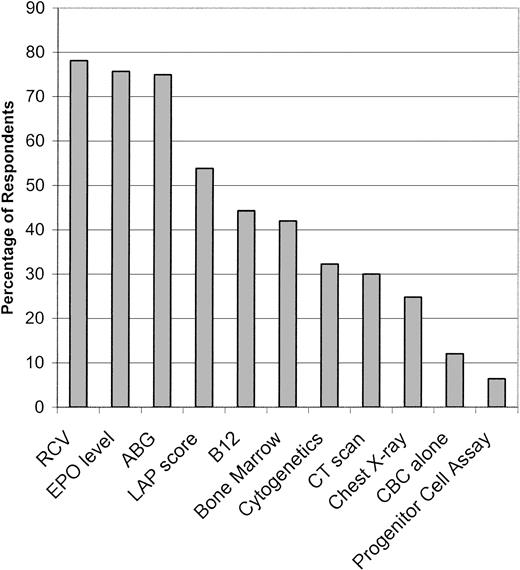
The principal tests used in the diagnosis of PV were the red cell volume (RCV), the serum erythropoietin (EPO) level, and the arterial blood gas (ABG). The leukocyte alkaline phosphatase (LAP) score, serum vitamin B12 level, bone marrow aspiration/biopsy, bone marrow cytogenetics, abdominal computed tomography (CT) scan, and chest x-ray were used less frequently. A complete blood count (CBC) alone or an erythroid progenitor cell assay was employed infrequently (Figure2). The diagnostic approach to PV varied by region, practice setting, specialty, years since completion of training, and the number of PV patients in a physician's practice (Tables 2-6). Utilization of RCV, ABG, LAP scores, CT scans, and progenitor cell assays varied significantly between regions (Table2). Physicians in private practice settings were more likely to use the serum vitamin B12level, LAP score, CT scan, and chest x-ray, while academic physicians employed the RCV and erythroid progenitor cell assay more commonly (Table 3). Hematologists were less likely to use LAP score, serum B12 level, and chest x-rays but more likely to use progenitor cell assays than oncologists or hematologist/oncologists (Table 4). While significant variation among respondents by years since completion of training existed, no interpretable trends were noted (Table5). In contrast, a clear trend for increased utilization of EPO levels, CT scans, and chest x-rays with increasing patient number was evident, whereas decreased employment of progenitor cell assays was noted (Table 6).
Tests employed by respondents in the diagnosis of polycythemia vera.
The percentage of survey respondents using each diagnostic test is indicated.
Tests employed by respondents in the diagnosis of polycythemia vera.
The percentage of survey respondents using each diagnostic test is indicated.
Statistically significant relationships between region and diagnostic testing
| Diagnostic test . | Northeast, % . | Southeast, % . | Southwest, % . | Midwest, % . | West, % . | χ2P . |
|---|---|---|---|---|---|---|
| RCV | 81.3 | 80.6 | 69 | 79.2 | 70.8 | .022 |
| ABG | 72.4 | 82.2 | 78.2 | 76.1 | 66.9 | .008 |
| LAP score | 59.5 | 55.4 | 47.1 | 55.3 | 43.5 | .018 |
| CT scan | 35.4 | 28.1 | 36.8 | 32.7 | 18.8 | .004 |
| Progenitor cell assay | 5.8 | 3.3 | 4.6 | 5.0 | 14.3 | < .001 |
Each row represents the results of a Pearson χ2test computed on a contingency table for region and whether or not a respondent uses a diagnostic test. To conserve space, we present only the affirmative responses to our question and report results only for tests where we found statistically significant regional variation (P < .05).
Statistically significant relationships between respondents' practice type and diagnostic testing
| Diagnostic test . | Private practice, % . | Academic practice, % . | P . |
|---|---|---|---|
| RCV | 75.5 | 83.0 | .007 |
| LAP score | 57.6 | 45.8 | < .001 |
| Vitamin B12level | 48.8 | 35.6 | < .001 |
| CT scan | 34.1 | 23.3 | .0004 |
| Chest x-ray | 28.5 | 18.4 | .0005 |
| Progenitor cell assays | 3.9 | 10.7 | < .001 |
Each row represents the results of a Pearson χ2test computed on a contingency table for practice type and whether or not a respondent uses a diagnostic test. To conserve space, we present only the affirmative responses to our question and report results only for tests where we found statistically significant variation (P < .05).
Statistically significant relationships between respondents' specialty and diagnostic testing
| Diagnostic test . | Oncologists, % . | Hematologists, % . | Hematologist/ oncologists, % . | χ2P . |
|---|---|---|---|---|
| LAP score | 55.1 | 47.4 | 64.3 | < .001 |
| Vitamin B12 level | 47.5 | 36.2 | 56.3 | < .001 |
| Chest x-ray | 27.0 | 21.0 | 29.1 | .044 |
| Progenitor cell assays | 4.2 | 9.5 | 3.5 | .002 |
Each row represents the results of a Pearson χ2test computed on a contingency table for specialty and whether or not a respondent uses a diagnostic test. To conserve space, we present only the affirmative responses to our question and report results only for tests where we found statistically significant variation (P < .05).
Statistically significant relationships between duration of clinical experience after training and diagnostic testing
| Diagnostic test . | 1 to 5 years, % . | 6 to 10 years, % . | More than 10 years, % . | χ2P . |
|---|---|---|---|---|
| EPO level | 77.5 | 86.6 | 73.3 | .002 |
| Cytogenetics | 42.4 | 40.3 | 28.1 | < .001 |
| Chest x-ray | 19.9 | 17.4 | 27.5 | .011 |
| CBC alone | 7.3 | 9.4 | 13.7 | .05 |
| Diagnostic test . | 1 to 5 years, % . | 6 to 10 years, % . | More than 10 years, % . | χ2P . |
|---|---|---|---|---|
| EPO level | 77.5 | 86.6 | 73.3 | .002 |
| Cytogenetics | 42.4 | 40.3 | 28.1 | < .001 |
| Chest x-ray | 19.9 | 17.4 | 27.5 | .011 |
| CBC alone | 7.3 | 9.4 | 13.7 | .05 |
Each row represents the results of a Pearson χ2test computed on a contingency table for time in clinical practice since completion of training and whether or not a respondent uses a diagnostic test. To conserve space, we present only the affirmative responses to our question and report results only for tests where we found statistically significant variation (P < .05).
CBC indicates complete blood counts.
Statistically significant relationships between the number of PV patients in respondents' practices and diagnostic testing
| Diagnostic test . | None, % . | 1-5 patients, % . | More than 5 patients, % . | χ2P . |
|---|---|---|---|---|
| EPO level | 60.5 | 73.1 | 79.1 | .008 |
| CT scan | 13.2 | 28 | 32.3 | .03 |
| Chest x-ray | 18.4 | 20.6 | 28.1 | .02 |
| Progenitor cell assays | 15.8 | 8.2 | 4.4 | .003 |
| Diagnostic test . | None, % . | 1-5 patients, % . | More than 5 patients, % . | χ2P . |
|---|---|---|---|---|
| EPO level | 60.5 | 73.1 | 79.1 | .008 |
| CT scan | 13.2 | 28 | 32.3 | .03 |
| Chest x-ray | 18.4 | 20.6 | 28.1 | .02 |
| Progenitor cell assays | 15.8 | 8.2 | 4.4 | .003 |
Each row represents the results of a Pearson χ2test computed on a contingency table for the number of PV patients in a respondent's practice and whether or not a respondent uses a diagnostic test. To conserve space, we present only the affirmative responses to our question and report results only for tests where we found statistically significant variation (P < .05).
Treatment of erythrocytosis in polycythemia vera
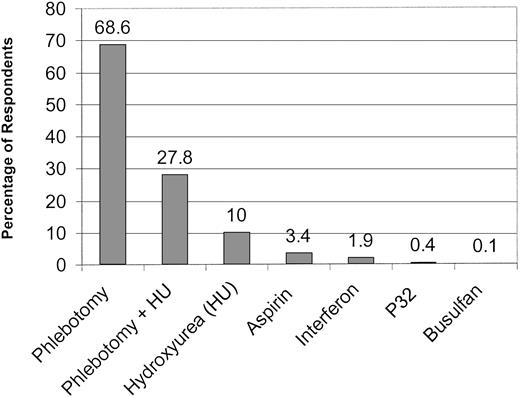
To assess the approach of practitioners to treatment of PV, we asked them to rank their therapeutic preferences. Phlebotomy alone was the overwhelming first choice, followed by a combination of phlebotomy and hydroxyurea and hydroxyurea alone. Aspirin, interferon,32P, and busulfan were chosen by only a small minority of practitioners (Figure 3). Eighty-one percent of physicians included phlebotomy alone at some point among their therapeutic choices (sum of first- through fourth-line therapies). Phlebotomy plus hydroxyurea was selected almost as frequently (76.4%). Hydroxyurea alone (48.7%), interferon (24.5%), aspirin (16.5%), 32P (16.4%), and busulfan (9.5%) were used less often. Few significant variations in treatment approach to erythrocytosis were noted among respondents. Use of hydroxyurea as a first-line agent was greater among physicians in academic practice (26.8% vs 17% in private practice, P = .01). There was a trend for physicians with more years of posttraining clinical experience to use phlebotomy as first-line therapy for erythrocytosis (87%, > 10 years experience; vs 81%, 6-10 years; and 79%, 1-5 years; P = .02 for > 10 years group and 1-5 years group comparison). Busulfan (76.4%), 32P (68.9%), and interferon (40.5%) were the agents most often avoided in the treatment of erythrocytosis. These opinions were invariant among respondents by practice type, specialty, and the number of PV patients in their practice. However, some regional variation in the reluctance to employ interferon for erythrocytosis was noted (Southwest, 48%; West, 49%; vs 35%, 38%, and 38% for Northeast, Southeast, and Midwest, respectively, χ2P = .03). Clinicians with more than 5 years of clinical experience appeared to be less likely to use busulfan than physicians who had more recently completed subspecialty training (6-10 years, 81%; vs 1-5 years, 67%;P = .005; and > 10 years, 78%; vs 67%, 1-5 years;P = .006).
Preferred therapy for the erythrocytosis of polycythemia vera.
The percentage of respondents who selected each therapeutic modality as their first choice is indicated.
Preferred therapy for the erythrocytosis of polycythemia vera.
The percentage of respondents who selected each therapeutic modality as their first choice is indicated.
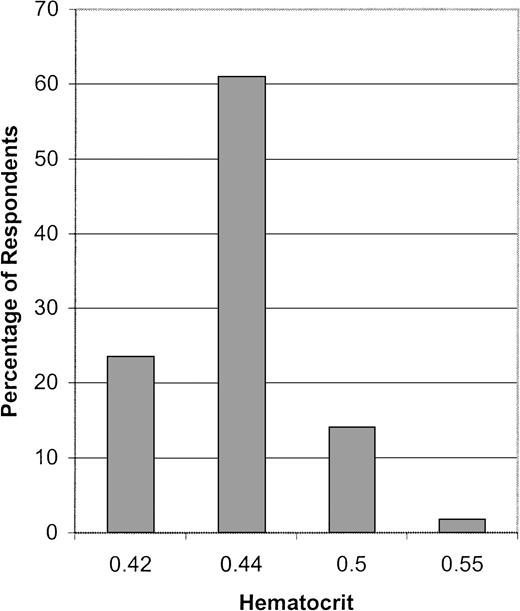
Previous studies have shown that a hematocrit above 0.44 (44%) is associated with a steep increase in the number of thromboembolic complications suffered by patients with PV.7 Accordingly, most respondents used a target hematocrit of 0.44 (44%) or less for phlebotomy therapy. Nevertheless, a significant minority used a higher target hematocrit (Figure 4). Although most respondents regardless of their subgroup classification used a hematocrit below 0.44 (44%) as a phlebotomy target, there was a trend for physicians in private practice (17% vs 12% in academic practice,P = .03) and those with more than 5 years of posttraining clinical experience (> 10 years group, 17%; and 6-10 years group, 15.6%; vs 1-5 years group, 8.7%; P = .01 for > 10 years and 1-5 years group comparison) to use a hematocrit higher than 0.44 (44%) as a target for phlebotomy therapy.
The target hematocrit used for phlebotomy therapy.
The percentage of respondents who use each target hematocrit as their goal for phlebotomy therapy is indicated.
The target hematocrit used for phlebotomy therapy.
The percentage of respondents who use each target hematocrit as their goal for phlebotomy therapy is indicated.
Therapy for thrombocytosis in polycythemia vera
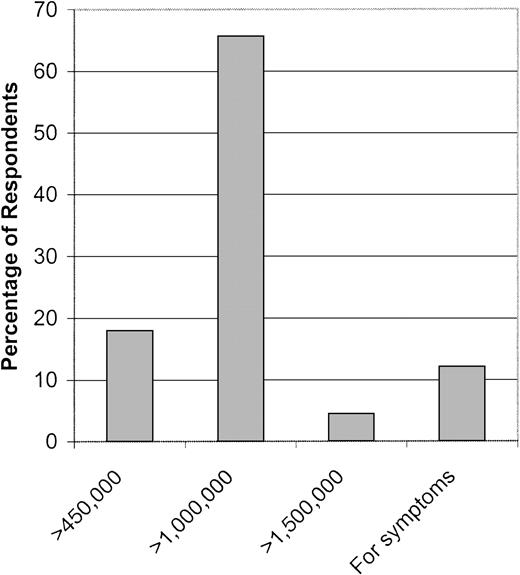
Considerably less uniformity was noted among physicians regarding treatment of thrombocytosis. Although a majority instituted treatment for platelet counts in excess of 1000 × 109/L (1 000 000/μL), substantial numbers of respondents selected a lower threshold or instituted treatment only for symptomatic thrombocytosis (Figure 5). Subgroup analysis revealed a relatively uniform approach among physicians to the treatment of thrombocytosis except for a trend among hematologists compared with hematologist/oncologists to treat only symptomatic thrombocytosis (hematologists, 15%; vs hematologist/oncologists, 6.7%;P = .004).
The platelet count threshold at which respondents initiate therapy for the thrombocytosis of polycythemia vera.
The percentage of respondent who used each platelet count threshold is indicated.
The platelet count threshold at which respondents initiate therapy for the thrombocytosis of polycythemia vera.
The percentage of respondent who used each platelet count threshold is indicated.
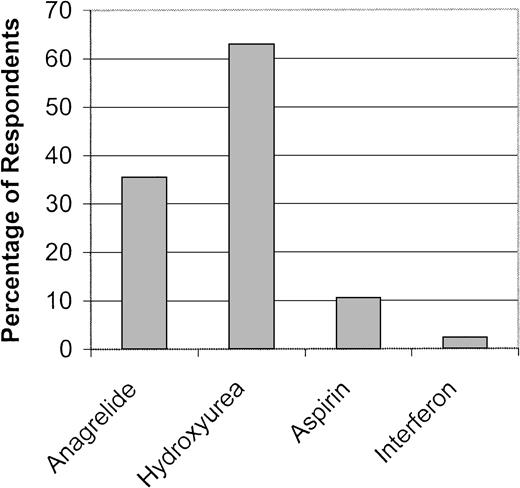
Hydroxyurea was the agent of choice for treatment of thrombocytosis. Anagrelide, aspirin, and interferon were used less often (Figure6). Aspirin (67.3%) and interferon (70.2%) were not ranked as a therapeutic alternative by a majority of respondents. While no regional differences in therapy for thrombocytosis were identified, differences were noted by practice type, specialty, experience, and number of PV patients. Hydroxyurea was favored by physicians in academic practice (71.5% vs 64.3% in private practice, P = .02) and those with PV patients (1-5 patients, 71%; vs no patients, 45.5%; P = .003; > 5 patients, 66.3%; vs no patients, 45.5%; P = .02). In contrast, anagrelide was preferred by physicians in private practice (44.6% vs 36.3% in academic practice, P = .02), with a trend toward greater use among physicians who had more recently completed their training (1-5 years, 51%; vs 6-10 years, 44%; and > 10 years, 39%; P = .01 for comparison between 1-5 years and > 10 years groups) and those with fewer PV patients (no patients, 70%; vs 1-5 patients, 44%; P = .007; and no patients, 70%; vs > 5 patients, 39%; P = .001).
Preferred therapy for the thrombocytosis of polycythemia vera.
The percentage of respondents who selected each agent as their first choice for control of thrombocytosis is indicated.
Preferred therapy for the thrombocytosis of polycythemia vera.
The percentage of respondents who selected each agent as their first choice for control of thrombocytosis is indicated.
Fifty-five percent of physicians preferred to avoid using interferon for thrombocytosis. Fifteen percent preferred not to use aspirin, while 9.5% and 4.5% avoided use of anagrelide and hydroxyurea, respectively, for thrombocytosis. The practice type and clinical experience of respondents influenced negative attitudes toward agents for thrombocytosis. Physicians in academic practice were more likely to have a negative opinion of anagrelide (13.4% vs 7.2% in private practice, P = .001). A trend for physicians with a longer duration of clinical experience to be more reluctant to use anagrelide also existed (> 10 years, 11%; vs 6-10 years, 6%; and 1-5 years, 5.3%; P = 0.03 for comparison of > 10 years and 1-5 years group).
Discussion
This report presents the results of the first nationwide survey of practice patterns among US ASH members on the diagnosis and treatment of PV. At the time of the survey, there were 6269 ASH members in the US (unpublished data, courtesy of Michelle Moody, ASH, 1999). Our survey was sent to 3000 randomly selected members (approximately 50% of the total US membership) who were practicing adult hematologists, oncologists, or hematologist/oncologists. Thirty-three percent of surveys were returned, representing data on the practice patterns of 16% of the ASH membership, making this the largest survey of practice patterns ever conducted among the ASH membership. Because the regional distribution of our sample of survey respondents was similar to the United States ASH membership as a whole, we believe these results do represent a reasonably accurate assessment of the approach of US ASH members to the diagnosis and treatment of PV.
The survey focused on 3 aspects of PV care: diagnosis, treatment of erythrocytosis, and treatment of thrombocytosis. Given the level of experience among respondents, it is not surprising that utilization of the most informative tests (RCV, EPO level, ABG) in the diagnosis of PV was common. Somewhat surprising was the frequent use of less essential diagnostic studies, such as the LAP score, serum vitamin B12 level, bone marrow aspiration/biopsy, cytogenetics, abdominal CT scan, and chest x-ray. While the LAP score and serum vitamin B12 level were used in the PVSG studies as diagnostic criteria, their contemporary importance has lessened considerably (Table 7). Bone marrow aspiration/biopsy, cytogenetics, an abdominal CT scan, and a chest x-ray all can provide useful information in selected cases but probably are not necessary in the routine evaluation of a patient with suspected PV. Appropriately, only a small number of respondents used the CBC alone. Erythroid progenitor cell assays were used least frequently, perhaps due to their limited availability (M.B.S. and J.L.S., unpublished data, 2001).
PVSG diagnostic criteria for PV
| Category A | A1 | Increased red cell mass |
| M ≥ 36 mL/kg | ||
| F ≥ 32 mL/kg | ||
| A2 | Oxygen saturation ≥ 92% | |
| A3 | Splenomegaly | |
| Category B | B1 | Platelets ≥ 400 × 109/L (400 000/μL) |
| B2 | White blood count ≥ 12 × 109/L (12 000/μL)7-150 | |
| B3 | LAP score > 1007-150 | |
| B4 | Serum B12 > 900 pg/mL (660 pM) | |
| U B12 BC > 2200 pg/mL (1620 pM) |
U B12 BC indicates unbound vitamin B12binding capacity.
In absence of fever or infection.
Adapted from Peterson P, Wasserman LR. The natural history of polycythemia vera. In: Wasserman LR, Berk PD, Berlin NI, eds. Polycythemia Vera and the Myeloproliferative Disorders. Philadelphia, PA: WB Saunders; 1995:14-21.
Considerable regional variation in diagnostic test utilization was identified in the survey. Except for erythroid progenitor cell assays, physicians from the West appeared to utilize common tests in the diagnosis of PV at a lower frequency than physicians in other regions. Unfortunately, given the inherent limitations of our survey, we can only speculate as to whether these findings reflect the influence of regional market forces on physician practice or represent differences in diagnostic approach acquired during specialty training.
Practice category also influenced diagnostic test utilization. Physicians at academic medical centers were more likely to use the RCV and erythroid progenitor cell assay, tests to which all physicians may not have equal access. Private practitioners relied more upon vitamin B12 levels and LAP scores, CT scans, and chest x-rays. Because the vitamin B12 level and LAP score were part of the original diagnostic criteria for PV used by the PVSG, employment of these tests attests to the continued influence of the PVSG on the clinical diagnosis of PV (Table 7).8 The greater utilization of radiology studies by private hematologist/oncologists may represent the more ready availability of these procedures than RCV measurements and perhaps a greater need to efficiently document the presence or absence of abnormalities such as splenomegaly or pulmonary arteriovenous malformations in a busy private practice setting.
Diagnostic approach was also influenced by self-reported specialty and years of clinical experience. Because hematologists practiced predominantly in an academic setting and oncologists and hematologist/oncologists predominantly in a private practice setting, the diagnostic approach of these specialties resembled their practice setting. Oncologists used vitamin B12 levels, LAP scores, and chest x-rays more frequently, while hematologist/oncologists used CT scans more frequently in the diagnosis of PV. Hematologists employed erythroid progenitor cell assays more often. Physicians who completed subspecialty training more than 10 years ago tended to use bone marrow cytogenetics less frequently but ordered chest x-rays more often than their colleagues who had completed their training more recently, perhaps reflecting a diagnostic emphasis on identification of correctable causes of erythrocytosis.
Little disagreement was evident among respondents regarding first-line therapy for erythrocytosis. Phlebotomy was preferred by more than two thirds of respondents. This result did not differ by region, practice type, or specialty. On the other hand, a trend for increasing use of phlebotomy as first-line therapy for erythrocytosis was evident because the duration of time after completion of training increased among respondents. Among alternative treatments for erythrocytosis, academic physicians and those with PV patients in their practice used hydroxyurea more frequently. Physicians from the Northeast, Midwest, and Southeast appeared to be less reluctant to employ interferon, perhaps reflecting the investigational use of interferon performed at academic institutions in these regions.
Clearly, the most striking finding in the treatment of erythrocytosis was that almost 16% of physicians used a hematocrit of 0.50 (50%) or higher as target for phlebotomy therapy. Although a hematocrit of 0.52 (52%) was originally specified by the PVSG,5 subsequent research has clearly demonstrated that the frequency of thrombosis in PV patients increases dramatically at a hematocrit above 0.44 (44%).7 In women, treatment to a hematocrit of 0.44 (44%) may still represent undertreatment.9 Therefore, a substantial percentage of responding US ASH members appear to continue to use an inappropriately high target hematocrit for phlebotomy therapy in patients with PV.
Distinctly different approaches to the treatment of thrombocytosis were also evident. Although most respondents felt that platelet counts in excess of 1000 × 109/L (1 000 000/μL) required therapeutic intervention, substantial numbers chose alternative platelet thresholds, including 12% who felt that intervention was only necessary in the setting of symptomatic thrombocytosis. Similar disparities were noted in therapeutic choice. Physicians in academic settings and those with PV patients in their practice preferred hydroxyurea, while those in private practice, hematologist/oncologists, and physicians who had more recently completed their training considered anagrelide the first choice for therapy of thrombocytosis. Few physicians used interferon or aspirin for thrombocytosis.
Several limitations of our survey deserve mention. Although it represents the largest clinical practice survey of ASH members ever performed, our response rate was only 33%. Therefore, although the distribution of respondents resembles that of the entire US ASH membership, these results are derived from a select group of members, who may or may not reflect the attitudes of the entire membership or hematologist/oncologists in general. Compared with the recently published ASH member-needs survey, a greater percentage of our respondents were in private practice.10 The reason for the higher response rate among this group of ASH members is unknown, but caution is warranted against generalizing these findings. While use of additional participation incentives might have increased our response rate, the large size and wide distribution of the study population made these strategies infeasible. In addition, our survey only focused on a select number of topics in the management of PV. Although a more comprehensive survey instrument may have been preferable, we felt strongly that a longer questionnaire would adversely affect our response rate, limiting the applicability of our results to the ASH membership as a whole. For a similar reason, our survey only included a finite number of potential responses to each query. It is possible that this structure may not have provided the necessary flexibility required by some physicians to completely characterize their approach to PV and therefore served as a disincentive to respond. In addition, our survey shares the limitation of any survey in that these data represent the practice of responding physicians at the time the survey was completed, and therefore the results may not be entirely representative of current practice.
Despite these limitations, our survey, the first nationwide assessment of PV practice patterns, convincingly demonstrates that there exists considerable variation in the diagnosis and treatment of PV among US ASH members. These data demonstrate that despite much progress, the most effective approach to diagnosis and treatment remains to be defined. As previously demonstrated by the PVSG, further refinement of PV care will require randomized assessments of diagnostic and therapeutic modalities. Application of this principle will be an essential element in the continued efforts to optimize management of PV.
The authors acknowledge the assistance of Jeannette L. Fanning and Patricia E. Rusche in mailing the survey, Lauren Dundes for her advice on statistical analysis, and Michelle Moody for US ASH membership data.
Supported by the Myeloproliferative Disorders Research Fund, Division of Hematology, Johns Hopkins University School of Medicine, Baltimore, MD.
The publication costs of this article were defrayed in part by page charge payment. Therefore, and solely to indicate this fact, this article is hereby marked “advertisement” in accordance with 18 U.S.C. section 1734.
References
Author notes
Michael B. Streiff, Asst Prof of Medicine, 1025 Ross Bldg, 720 Rutland Ave, Baltimore, MD 21205; e-mail:mstreif@jhmi.edu.

This feature is available to Subscribers Only
Sign In or Create an Account Close Modal