Phospholipid scramblase 1 (PLSCR1) is an endofacial plasma membrane protein proposed to participate in transbilayer movement of phosphatidylserine and other phospholipids. In addition to its putative role in the reorganization of plasma membrane phospholipids, PLSCR1 is a substrate of intracellular kinases that imply its possible participation in diverse signaling pathways underlying proliferation, differentiation, or apoptosis. Because PLSCR1 is prominently expressed in a variety of blood cells, we evaluated PLSCR activity in platelets and erythrocytes, and cytokine-dependent growth of hematopoietic precursor cells, of PLSCR1 knock-out mice. Adult PLSCR1−/− mice showed no obvious hematologic or hemostatic abnormality, and blood cells from these animals normally mobilized phosphatidylserine to the cell surface upon stimulation. Whereas blood cell counts in adult PLSCR1−/− mice were normal, in both fetus and newborn animals neutrophil counts were significantly depressed relative to age-matched wild type (WT). Furthermore, when compared with WT, hematopoietic precursor cells from PLSCR1−/− mice showed defective colony formation and impaired differentiation to mature granulocytes as stimulated by stem cell factor and granulocyte colony-stimulating factor (G-CSF). By contrast, PLSCR1−/− cells showed normal colony formation stimulated by interleukin-3 or granulocyte-macrophage CSF, and expansion of megakaryocytic and erythroid progenitors by thrombopoietin or erythropoietin was unaffected. Stem cell factor and G-CSF were also found to induce marked increases in PLSCR1 levels in WT cells. Consistent with in vitro assays, PLSCR1−/− mice treated with G-CSF showed less than 50% of the granulocytosis observed in identically treated WT mice. These data provide direct evidence that PLSCR1 functionally contributes to cytokine-regulated cell proliferation and differentiation and suggest it is required for normal myelopoiesis.
Introduction
Phospholipid scramblase 1 (PLSCR1) is a member of a recently identified family of membrane proteins that has been proposed to contribute to the reorganization of plasma membrane phospholipids (PLs) in activated platelets and in injured or apoptotic cells exposed to elevated intracellular Ca++.1-3 In addition to a putative role in promoting transbilayer redistribution of plasma membrane PLs through this Ca++-activated PL scramblase pathway, PLSCR1 has also been reported to be a substrate of several kinases that participate in cell proliferative, differentiation, or apoptotic responses, including protein kinase Cδ, c-Abl, and both immunoglobulin E (IgE) and EGF receptor–coupled kinase(s).4-7
Although suggested to play a role in the redistribution of plasma membrane PLs through the PL scramblase pathway, the actual cellular function(s) of PLSCR1 and related members of this gene family remains largely unresolved. The putative role of PLSCR1 in mediating Ca++-dependent accelerated transbilayer migration of plasma membrane PLs derived from its capacity to mediate this function in reconstituted membrane systems and the apparent correlation between levels of endogenous expression of cellular PLSCR1 and the propensity of various cells to expose phosphatidylserine (PS) in response to influx of Ca++.1,2,8 Subsequently, it was reported that the Thr phosphorylation of PLSCR1 by cellular protein kinase Cδ served to promote surface exposure of plasma membrane PS in Jurkat cells induced to apoptosis, implicating a role for protein phosphorylation in activation of PLSCR1's PL-scrambling function.4 Nevertheless, elevation of PLSCR1 expression by transfection was variably found to increase plasma membrane PL scramblase activity,4,8,9 whereas no increase in such plasma membrane PL scramblase activity was detected upon interferon-induced expression of PLSCR110 or following Tyr phosphorylation of PLSCR1 by activated c-Abl kinase.6
The biologic significance of the phosphorylation of PLSCR1 by multiple cellular kinases also remains unclear. De novo expression of a mutant messenger RNA (mRNA) encoding a truncated form of murine PLSCR1 (deleting the proline-rich segment contained between codons 1-128) was identified in a monocytic leukemia cell line, and this mutation was found to correlate with the ability of these cells to proliferate in vivo. By contrast, expression of full-length PLSCR1 increased upon induced differentiation of these tumor cells to macrophages, suggesting that PLSCR1 might normally play some role in regulated cell growth and/or differentiation.11 Furthermore, ectopic expression of recombinant human PLSCR1 in the HEY1B carcinoma cell line was found to markedly inhibit growth of solid tumors from these cells after subcutaneous transplantation.12 Finally, in yeast there is evidence that the single apparent PLSCR ortholog (YJR100C) is a stress-induced gene,13 whereas human PLSCR1 expression is highly induced by the interferons, suggesting possible roles in immune/stress responses, cell cycle regulation, or apoptosis.10 14
To gain additional insight into what role PLSCR1 might play in the PL scramblase pathway and in cytokine-dependent cell growth and differentiation in vivo, we have investigated hematopoietic cell growth and differentiation in mice that are deficient in PLSCR1 due to homozygous disruption of the PLSCR1 gene locus. Whereas these mice display no apparent hematologic or hemostatic abnormality at steady state and their blood cells show normal PL scramblase activity, our results suggest that PLSCR1−/− hematopoietic precursor cells exhibit impaired proliferative and differentiation responses to select growth factors, in particular, stem cell factor (SCF) and granulocyte colony-stimulating factor (G-CSF).
Materials and methods
Cytokines, antibodies, and other reagents
SCF, G-CSF, granulocyte-macrophage CSF (GM-CSF), interleukin-3 (IL-3), IL-6, IL-7, erythropoietin (Epo), and thrombopoietin (Tpo) were all from R&D Systems (Minneapolis, MN). Human recombinant G-CSF (Neupogen) was from Amgen (Thousand Oaks, CA). MethoCult 3234 and 3434 media were from Stem Cell Technology (Vancouver, BC), and Iscoves modified Dulbecco medium (IMDM) was from Gibco (Grand Island, NY). Fetal bovine serum (FBS) was from Sigma (St Louis, MO), and protease inhibitor cocktail tablets (containing inhibitors of serine and cysteine proteases) were from Roche Molecular Biochemicals (Indianapolis, IN). Rat antimurine Mac-1, Gr-1, Ter-119, CD45R/B220, CD3, CD4, CD8, and CD41 and rat IgG isotype–matched controls were from PharMingen (San Diego, CA), as was anti-CD62p (P-selectin). Murine monoclonal antibody (mab) 219.1 was raised against human erythrocyte PLSCR1 and found to cross-react with recombinant and purified murine PLSCR1. Antisera specific for N-terminal peptide Met1-Tyr16 and C-terminal peptide Glu315-Asp328 of murine PLSCR1 were raised in rabbit by immunization with the keyhole limpet hemocyanin conjugates, and the IgG fractions were then affinity-purified on the respective immunizing peptide conjugated to Affigel 10 (BioRad, Hercules, CA). The antibodies were found to be specific for murine PLSCR1 without detectable cross-reactivities with PLSCR2-4 as determined by Western blotting against the recombinant proteins purified from Escherichia coli using expression vector pMal. Adenosine diphosphate (ADP), epinephrine, and collagen were from Chrono-Log (Havertown, PA), fibrinogen was from Enzyme Research Labs (South Bend, IN) and conjugated with fluorescein isothiocyanate (FITC), and phycoerythrin-streptavidin from Jackson ImmunoResearch Lab (West Grove, PA).
PLSCR1 knock-out mice
Wild-type (WT) (PLSCR1+/+), heterozygote (PLSCR1−/+), and PLSCR1 knock-out mice (PLSCR1−/−) in the genetic background 129/SvEvBrd were produced and obtained from Lexicon Genetics (The Woodlands, TX). Targeting was performed using a genomic DNA fragment containing exons 4 to 8 of murine PLSCR1 (representing amino acid sequence Pro33 to Asp310 [Genbank accession no. AF159593]) inserted in the vector pKOS, using 129/SvEvBrd embryonic stem cells. Targeted clones with confirmed deletion of the PLSCR1 gene locus were injected into 129/SvEvBrd blastocysts, and germ-line transmission was confirmed. All experiments reported here were performed using mice and cells derived from the inbred 129/SvEvBrd strain. Genotyping was performed by both Southern blotting and PCR of tail genomic DNA, and the absence of expressed protein in various cells and tissues of PLSCR1−/− mice was confirmed by Western blotting using mab 219.1 (reactive with murine and human PLSCR1) and affinity-purified rabbit antibody raised against murine PLSCR1 C-terminal and N-terminal peptides.
Southern blotting
Purified tail genomic DNA was digested with XbaI, separated on a 0.9% agarose gel, and transferred to a nylon membrane. PLSCR1 genomic DNA was detected by hybridization with a32P-labeled PLSCR1 DNA probe consisting of a 408–base pair PLSCR1 genomic DNA fragment within the targeted region. Insertion of the targeting vector into the PLSCR1 locus shifts the detectedXbaI-derived fragment of genomic DNA from 2.9 kilobases (WT) to 7.5 kilobases (knock-out).
Northern blotting
Northern blotting was performed as previously described.2 15 In brief, total RNA from mouse kidney was resolved on a 1% denatured agarose gel and transferred to a nylon membrane. PLSCR1 mRNA was detected by hybridization with a32P-labeled mouse PLSCR1 complementary DNA fragment (nucleotides 1086-1465 of GenBank accession no. AF159593).
Western blotting
Cell lysates were mixed with sample buffer (50 mM Tris [pH 6.8], 4% sodium dodecyl sulfate, 10% glycerol, 50 mM dithiothreitol, and 0.1% bromophenol blue) and heated at 100°C for 5 minutes. Proteins were resolved on 10% sodium dodecyl sulfate–polyacryamide gel and transferred to nitrocellulose membrane. The membrane was blocked in 5% nonfat milk in 20 mM Tris-HCl, 150 mM NaCl, and 0.05% Tween 20 and incubated sequentially with 2 μg/mL anti-PLSCR1 mab 219.16 and horseradish peroxidase–conjugated goat antimouse IgG (Sigma). Bound antibodies were detected by SuperSignal chemiluminescence substrate (Pierce, Rockford, IL) and exposure to x-ray film.
Blood collection and hematologic profiles
For cell lineage analysis, red blood cell (RBC) and platelet studies, and apoptosis assay, blood was collected by heart puncture and mixed 9:1 with 500 U/mL heparin. For analysis of G-CSF–induced granulocytosis, blood was collected by eye puncture using heparinized capillaries. Newborn mouse blood for blood cell counts was collected from a tail cut. Platelets and RBCs were counted in a Coulter particle counter, and total white blood cell (WBC) counts were determined by hemacytometer. WBC differential counts were performed on a blood smear stained by Wright-Giemsa (Thermo Shandon, Pittsburgh, PA) or Hema 3 stain set (Biochemical Science, Swedesboro, NJ).
Tail bleeding times
Mouse tail bleeding time was performed as described.16 In brief, the tail was cut 2 mm from the end and immediately immersed into saline at 37°C, and time to cessation of bleeding was recorded.
Surface exposure of PS in RBCs
Blood was collected by heart puncture, buffy coat was removed by centrifugation, and the cells were washed and suspended at 108/mL in Hanks balanced salt solution, 0.1% bovine serum albumin (BSA), 1 mM Ca++ at 37°C. Ca++ionophore A23187 (1 μM) was added, and at times indicated the reaction was stopped by addition of 10 mM ethyleneglycotetraacetic acid. Cell surface–exposed PS was detected by the specific binding of factor Va.17 At each time point, 10 μg/mL bovine factor Va (Haematologic Technologies, Essex Junction, VT) was added to a 50-μL aliquot of the cell suspension, followed by incubation with 10 μg/mL FITC-labeled mab V237 specific for the light chain of factor Va (Dr Charles Esmon, Oklahoma Medical Research Foundation, Oklahoma City, OK). All samples were additionally stained with 0.1 μM DiIC16(3) (Molecular Probes, Eugene, OR). Cell-associated factor Va was quantified by flow cytometry on a FACSCalibur cytometer (Becton Dickinson, San Jose, CA), with acquisition gated on DiIC16(3)-positive particles.
Platelet activation
Blood was collected by heart puncture. Platelets were isolated by centrifugation as described18 and suspended to 2 × 10⁷/mL in HEPES buffer (137 mM NaCl, 4 mM KCl, 0.5 mM MgCl2, 1 mM CaCl2, 20 mM HEPES, pH 7.4) at 37°C. For measurement of cell surface–exposed PS or P-selectin, platelets (100 μL per tube) were incubated for 5 minutes in the presence of ADP (10 μM) plus epinephrine (10 μM), collagen (10 μg/mL), α-thrombin (0.5 U/mL), α-thrombin (0.5 U/mL) plus collagen (10 μg/mL), or A23187 (1 μM). PS exposure was detected by the binding of factor Va as described for RBCs above and cell surface P-selectin with a FITC-labeled antibody specific for CD62p. For quantification of fibrinogen binding to platelets, FITC-labeled fibrinogen (20 μg/mL) was added prior to the addition of the agonists, except in the case of thrombin, which was first reacted with platelets followed by inhibition of the enzyme with hirudin (2.5 U/mL). Fibrinogen-containing samples were fixed with 1% formaldehyde. All samples were additionally stained with biotinylated antimouse CD41 as a platelet-specific marker, detected with phycoerythrin-labeled streptavidin (2.5 μg/mL). Single-cell fluorescence was analyzed on a FACSCalibur, with acquisition gated on CD41+ particles.
Cell isolation and culture
Mouse fetal livers were aseptically removed from embryos at day 15 and mechanically disrupted. The cells were suspended in RPMI, 10% FBS complete medium and passed through a 40-μm cell strainer (Becton Dickinson, Franklin Lakes, NJ) to remove aggregated cells. Spleens and thymuses were isolated from 6- to 8-week-old mice, and cells were prepared as described for fetal liver. For bone marrow, femurs and tibia were removed from 6- to 8-week-old mice. Bone marrow cells were flushed out and suspended in RPMI complete medium and passed through a cell strainer.
Bone marrow cells (105/mL) were first cultured for 6 days in T75 flasks in MethoCult 3234 (1% methylcellulose, 15% FBS, 1% BSA, 10 μg/mL bovine pancreatic insulin, 200 μg/mL human transferrin, 100 μM β-mercaptoethanol, 2 mM glutamine in IMDM) supplemented with 10 ng/mL mouse IL-3 at the beginning of the culture. Thirty milliliters of IMDM, 15% FBS complete medium without cytokines were added to the flask, and the cells were cultured for another 4 days. Bone marrow progenitors formed large colonies, and all of the colonies were collected. The cells were harvested, washed with Hanks balanced salt solution, and used in subsequent culture in the presence of various cytokines.
Induction of PLSCR1 expression by cytokines
One million cultured bone marrow progenitor cells were mixed with 2 mL MethoCult 3234, and either mouse SCF (20 ng/mL) or G-CSF (60 ng/mL) was added. The cells were incubated at 37°C, 5% CO2 for 3 days, harvested at different times during this period, washed twice with phosphate-buffered saline (PBS), and lysed at 4°C for 1 hour with cell lysis buffer (50 mM Tris-HCl, 150 mM NaCl, 5 mM ethylenediaminetetraacetic acid, 1% Triton X-100, and protease inhibitor cocktail). Cell lysates were centrifuged at 14 000 rpm for 10 minutes at 4°C, and protein was measured using the bicinchonic acid method (Pierce).
Colony-forming assays
For the committed progenitor colony-forming assay, fetal liver cells (105), adult mouse spleen cells (2 × 10⁵), or bone marrow cells (5 × 10⁴) were added to 1.5 mL MethoCult 3434 (1% methylcellulose, 50 ng/mL mouse SCF, 10 ng/mL IL-3, 20 ng/mL IL-6, and 3 U/mL Epo, 15% FBS, 1% BSA, 10 μg/mL bovine pancreatic insulin, 200 μg/mL human transferrin, 100 μM β-mercaptoethanol in IMDM). For single cytokine-mediated colony assays, the cells were mixed with 1.5 mL MethoCult 3234 supplemented with either 20 ng/mL mouse SCF, 60 ng/mL G-CSF, 20 ng/mL GM-CSF, 10 ng/mL mouse IL-3, or 20 ng/mL IL-7. To promote committed progenitor colonies, G-CSF and SCF were used for progenitors of granulocyte, Epo, and SCF for erythrocytes, and Tpo, IL-3, and IL-6 for megakaryocytes. Assays were performed in 35-mm Petri dishes. The cells were cultured at 37°C in a humidified atmosphere of 5% CO2 in air. Colonies were scored as clusters containing more than 50 cells. Cells were then stained in the dish overnight at 37°C, 5% CO2 with 2 mL of 0.05% nitroblue tetrazolium in PBS, followed by fixing with 4% formaldehyde. The colony size was recorded by digital camera.
Cell proliferation assay
Thymus T-cell proliferation was performed using BrdU Cell Proliferation Assay Kit (Roche Molecular Biochemicals) as directed by the manufacturer. Briefly, thymus T cells were suspended in RPMI 1640, 10% FBS with 5 μg/mL concanavalin A, or both IL-2 (2 ng/mL) and concanavalin A (5 μg/mL), or RPMI complete medium without cytokine and mitogen, respectively. A total of 100 μL of the cell suspension (106 cells per milliliter) was grown in a 96-well tissue culture plate in triplicate at 37°C, 5% CO2. Two days later, 10 μL 5-bromo-2-deoxyuridine (BrdU) (100 μM) was added to each well and incubated for 4 hours. The plates were centrifuged at 1200 rpm for 10 minutes and heated at 60°C for 60 minutes. Cells were fixed with FixDenat for 30 minutes. Incorporated BrdU was detected using HRP-conjugated anti-BrdU specific antibody and HRP substrate, and OD 370 nm was measured in an ELISA reader.
Apoptosis assay
Apoptosis of neutrophils was detected by the TUNEL method using the ApoAlert DNA fragmentation assay kit (Clontech, Palo Alto, CA). Neutrophils were isolated from mouse blood (collected by heart puncture) by treatment with dextran and centrifugation through Ficoll-Hypaque.19 The cells were incubated in RPMI complete medium supplemented with 60 ng/mL mouse G-CSF and harvested after 20 and 44 hours. Cells were fixed with 4% formaldehyde, permeabilized with 0.2% Triton X-100, and transferred to glass slides by cytospin. Neutrophils were stained with biotin-labeled anti–Gr-1 and rhodamine-labeled streptavidin and then reacted with terminal deoxynucleotidyl transferase enzyme and nucleotide mix. Apoptotic neutrophils were counted under the fluorescent microscope (total of 1000 Gr-1+ cells per slide).
Cell lineage analysis by flow cytometry
Blood, bone marrow, spleen, and fetal liver cells were collected as described above. RBCs in samples were lysed with 0.15 M ammonium chloride solution. Cells were washed and resuspended in PBS, 2% BSA. Nonspecific binding to cell surface Fc receptors was blocked by incubating cells with CD16/CD32 Fc Block (PharMingen) for 10 minutes on ice. Cells were stained using phycoerythrin- or FITC-labeled rat antibodies directed against the cell lineage–specific cell surface markers Mac-1, Gr-1 (myeloid); CD45R/B220, CD3, CD4, CD8 (lymphoid); Ter-119 (erythroid); CD41 (platelet); or IgG isotype as control. Fluorescence-activated cell sorter (FACS) analysis was performed on a FACSCalibur flow cytometer.
Induced granulocytosis by G-CSF treatment
Male 9- to 10-week-old mice were used in the reported study. Human recombinant G-CSF was injected subcutaneously into both PLSCR1−/− (n = 5) and WT mice (n = 5) at doses of 120 μg/kg/d in approximately 230 μL saline. G-CSF was administered daily for 5 consecutive days. Blood samples were collected by eye puncture before and 18, 66, and 114 hours after the initial G-CSF injection. WBCs were counted, blood smears prepared, and differential counts performed (see above).
Statistics
Statistical comparisons were made using the unpaired bilateral Student t test. Results are expressed as mean ± SD.
Results
Mice deficient in PLSCR1
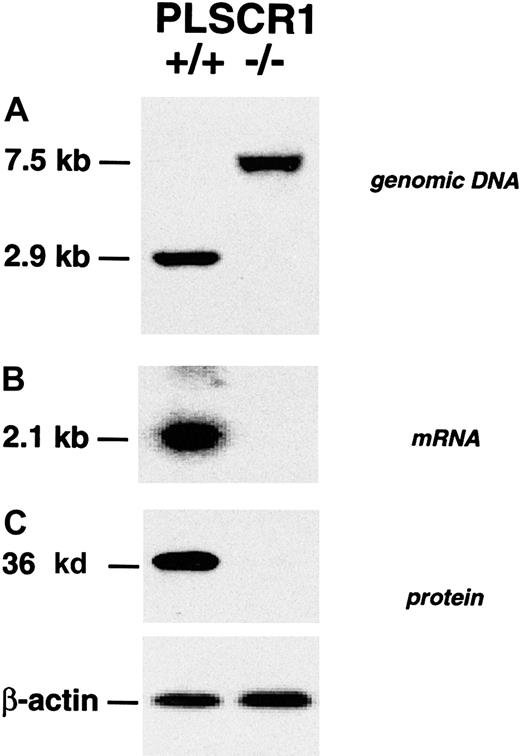
Targeted disruption of the PLSCR1 gene locus and elimination of PLSCR1 protein expression in bone marrow cells of the targeted PLSCR1−/− mice was confirmed by Southern, Northern, and Western blotting (Figure 1).
Absence of PLSCR1 in tissues from PLSCR1−/− mice.
(A) Successful targeting of the PLSCR1 gene as confirmed by Southern blot of tail genomic DNA. (B) Northern blot of kidney mRNA. (C) Western blot shows absence of PLSCR1 antigen in bone marrow cells of homozygous PLSCR1−/− mice. Blotting was performed as detailed in “Materials and methods.”
Similar results were obtained in Northern and Western blots of embryonic fibroblasts, peripheral blood cells, and various tissues derived from these animals using the murine PLSCR1-reactive mab 219.1 and rabbit antibody specific for either N-terminal or C-terminal peptides of murine PLSCR1 (data not shown). The PLSCR1−/−mice exhibited normal fecundity and litter sizes, normal longevity, and exhibited no obvious phenotypic abnormality (data not shown). Evaluation of peripheral blood cell counts revealed no significant differences between WT and PLSCR1−/− animals (Table1). Similarly, cell surface marker analysis of the hematologic cells recovered from peripheral blood, bone marrow, spleen, liver, and thymus revealed no differences between PLSCR1−/− and WT in the numbers of cells committed to myeloid (Gr-1, Mac-1), erythroid (Ter-119), platelet (CD41), and lymphoid (CD45R/B220, CD3, CD4, CD8) lineages (data not shown).
Adult mouse blood cell counts
| Genotype . | RBCs, × 1012/L . | Platelets, × 109/L . | WBCs, × 109/L . | Neutrophils, % . | Lymphocytes, % . | Other,* % . |
|---|---|---|---|---|---|---|
| PLSCR1+/+ | 6.8 ± 1.0 | 590 ± 110 | 7.8 ± 1.8 | 28.3 ± 7.2 | 69.3 ± 8.0 | 2.4 ± 0.9 |
| PLSCR1−/− | 6.1 ± 0.7 | 510 ± 60 | 8.3 ± 1.7 | 29.2 ± 2.3 | 68.9 ± 2.8 | 1.9 ± 0.8 |
Blood of 5 mice of each genotype was analyzed. Cell percentages were derived from WBC differential counts. All data represent mean ± SD.
Includes monocytes, eosinophils, and basophils.
Normal PL scramblase activity in PLSCR1−/− platelets and erythrocytes and normal tail bleeding times in PLSCR1−/− mice
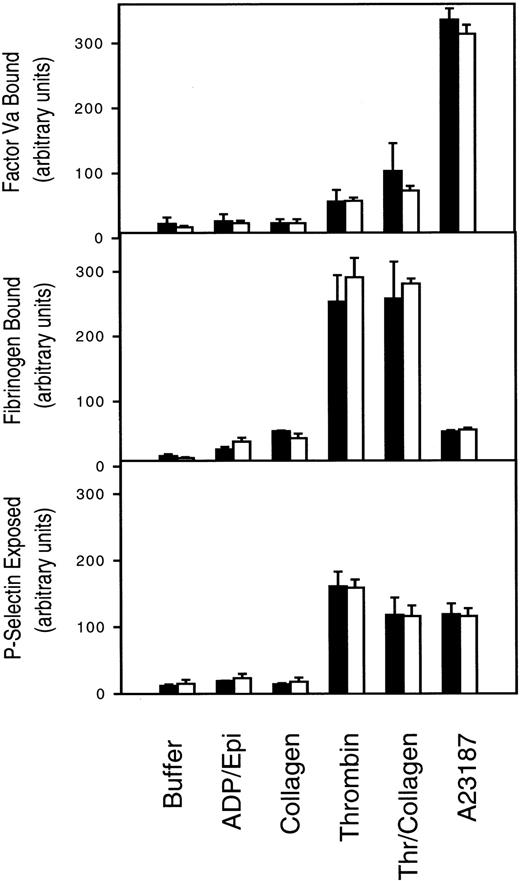
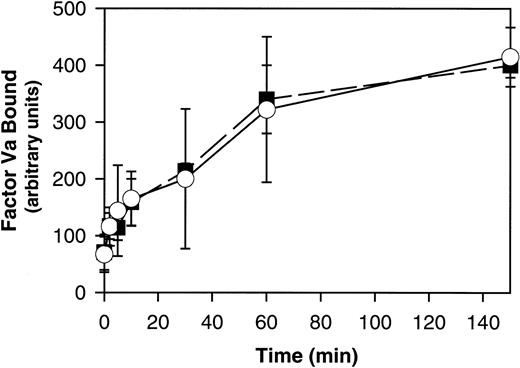
PLSCR1 was originally identified based on its capacity to mediate a Ca++-dependent transbilayer movement of PLs in proteoliposomes reconstituted with the protein, mimicking the effects of intracellular Ca++ on transbilayer distribution of plasma membrane PLs.1,20 This transbilayer “scrambling” of plasma membrane PLs is believed to be responsible for the de novo exposure of PS and other inner leaflet aminophospholipids on the surface of activated platelets and injured or apoptotic cells and thereby promotes thrombin generation, fibrin clotting, and cell clearance.21,22 A selective defect in this plasma membrane PL scramblase pathway is associated with Scott syndrome, an autosomal recessive bleeding disorder.23 We therefore evaluated the capacity of PLSCR1−/− platelets and erythrocytes to mobilize cell surface PS and to promote hemostasis. We detected no evidence of defective platelet function or impaired mobilization of cell surface PS in platelets or erythrocytes obtained from PLSCR1−/− animals (Figures2 and3).
Platelet activation is normal in cells from PLSCR−/− mice.
Platelets isolated from 3 each WT (■) and PLSCR1−/−(□) mice were incubated with the agonists indicated on the abscissa and processed for flow cytometry as described in “Materials and methods.” ADP/Epi indicates ADP plus epinephrine; Thr/collagen, α-thrombin plus collagen. Data shown are representative of 2 experiments so performed.
Ca++-induced PS exposure is normal in RBCs from PLSCR1−/− cells.
RBCs isolated from 3 each WT (■) and PLSCR1−/− (○) mice were incubated in the presence of 1 μM A23178, and PS exposure at the times indicated was detected by the specific binding of factor Va as detailed in “Materials and methods.” Data shown are representative of 3 experiments so performed.
These mice also showed no apparent hemostatic abnormality, with tail bleeding times of 98 ± 30 seconds in PLSCR−/− mice versus 82 ± 36 seconds in WT mice, respectively (mean ± SD determined in 13 mice of each genotype). Whereas these data suggest that PLSCR1 plays no role in the redistribution of plasma membrane PLs leading to PS exposure in circumstances of platelet activation or under conditions of elevated intracellular Ca++, we cannot exclude the possibility that these negative results for the PLSCR1 knock-out are related to the redundancy of expression of PLSCR3, a homologous protein that is also highly expressed in these and other blood cells.3 22
Evidence for reduced granulocyte production in newborn PLSCR1−/− mice
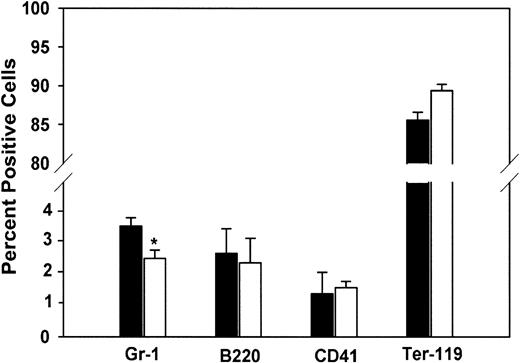
As previously noted, PLSCR1 is a highly interferon-induced gene that has recently been shown to be a substrate of several protein kinases implicated in regulating cell proliferative, differentiation, and apoptotic responses.4-6,10,14 Furthermore, it has been reported in yeast that whereas knock-out of the orthologous gene (YJR100C) yields viable cells, expression of YJR100C in WT yeast cells is up-regulated under several conditions of environmental stress.13 24 We therefore considered the possibility that the deletion of PLSCR1 might give rise to phenotypic changes that only become apparent under conditions of stimulated cell proliferation and might not be manifested in the unchallenged adult animal. To explore this possibility, we evaluated hematopoiesis in fetal and newborn animals, a period of rapid clonal expansion under cytokine stimulation. As shown in Table 2, neutrophil counts in the peripheral blood of newborn PLSCR1−/− and PLSCR1+/− mice were distinctly reduced relative to matched WT animals. This decrease in blood leukocytes at birth was accompanied by a comparable decrease in the relative number of Gr-1+cells detected in livers of 2-week-old fetuses (Figure4).
Newborn mouse WBC differential counts
| Genotype . | WBCs, × 109/L . | Neutrophils, % . | Lymphocytes, % . | Other,* % . |
|---|---|---|---|---|
| Group A† | ||||
| PLSCR1+/+ (n = 14) | 8.9 ± 1.7 | 90.2 ± 2.6 | 8.3 ± 2.4 | 1.4 ± 1.0 |
| PLSCR1−/− (n = 15) | 7.2 ± 1.5 | 72.4 ± 5.82-153 | 25.4 ± 5.92-153 | 2.2 ± 1.7 |
| Group B‡ | ||||
| PLSCR1+/+ (n = 5) | 5.8 ± 2.3 | 87.0 ± 2.3 | 9.6 ± 2.3 | 3.4 ± 1.6 |
| PLSCR1+/− (n = 13) | 6.0 ± 1.6 | 77.2 ± 2.82-153 | 19.0 ± 3.12-153 | 3.8 ± 2.0 |
| PLSCR1−/− (n = 5) | 4.9 ± 0.6 | 70.7 ± 1.22-153 | 26.6 ± 2.22-153 | 2.7 ± 2.0 |
All data represent mean ± SD.
Includes monocytes, eosinophils, and basophils.
Offspring of independent matings of either WT or PLSCR−/− parents.
Represents pooled data obtained from littermates of 3 independent matings of PLSCR1+/− × PLSCR1+/− heterozygotes.
P < .01 compared with PLSCR1+/+.
Cell lineage analysis of mouse fetal liver.
Fetal liver cells were stained using antibodies specific for the following lineage markers: Gr-1 (granulocytes), B220 (B lymphocytes), CD41 (megakaryocytes and platelets), and Ter-119 (erythrocytes). FACS analysis was performed on a FACSCalibur. Data are derived from 5 each WT (■) and PLSCR1−/− (□) day 15 fetuses. *P < .05 compared with WT.
Defective response to SCF and G-CSF in cultured PLSCR1−/− hematopoietic precursor cells
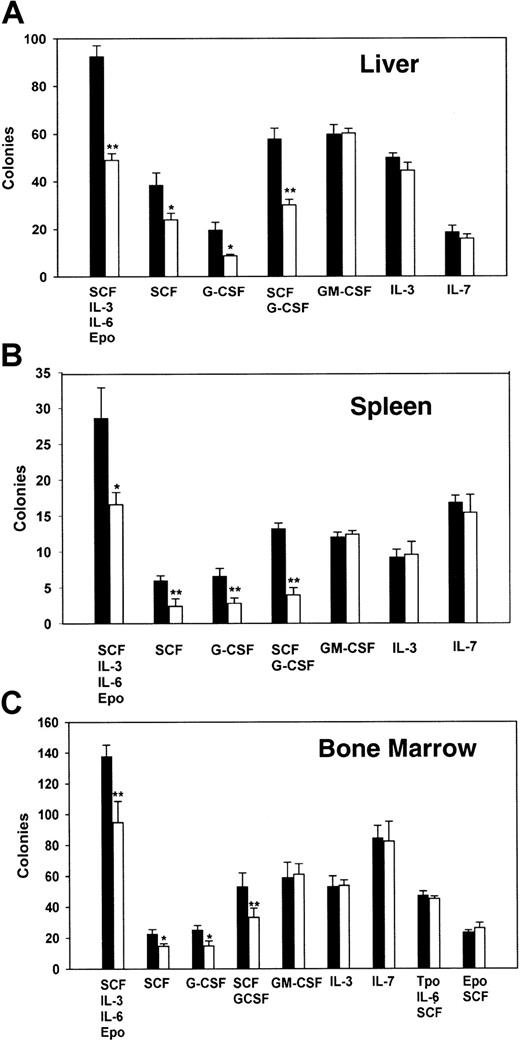
To gain further insight into the origin of this small but significant myeloid deficiency detected in the fetal and newborn PLSCR1−/− animals, we next evaluated cytokine-supported colony formation using hematopoietic precursor cells derived from fetal liver and from the spleens or bone marrows of age-matched adult animals (Figure 5).
Analysis of hematopoietic cell colony formation of cells from fetal liver, adult spleen, and adult bone marrow.
A total of 105 fetal liver cells (A), 2 × 10⁵ adult spleen cells (B), or 5 × 10⁴ adult bone marrow cells (C) were cultured in 1% methylcellulose supplemented with either a single cytokine or multiple cytokines as detailed in “Materials and methods.” Colonies were scored as clusters containing more than 50 cells at 6 to 9 days. Data are from 2 experiments, each performed with cells derived from 5 WT (■) and 5 PLSCR1−/− (□). *P < .05 and **P < .01 compared with WT.
As these data indicate, the hematopoietic precursor cells derived from PLSCR1−/− animals showed a consistent and selective defect in colony formation under stimulation by G-CSF or SCF, an effect that was reproduced using cells derived from all 3 hematopoietic compartments. In all cases, we observed both a decrease in detectable colony number and in colony size arising from the PLSCR1−/− cells in response to stimulation by G-CSF or SCF, implying both reduced numbers of responsive hematopoietic precursors and reduced cell proliferation under stimulation by these cytokines. By contrast, no obvious differences in cell colony formation from PLSCR1−/− versus WT cells were detected under stimulation by IL-3, IL-7, or GM-CSF; nor were any differences detected when Tpo or Epo was used to promote expansion of megakaryocytic or erythroid colonies.
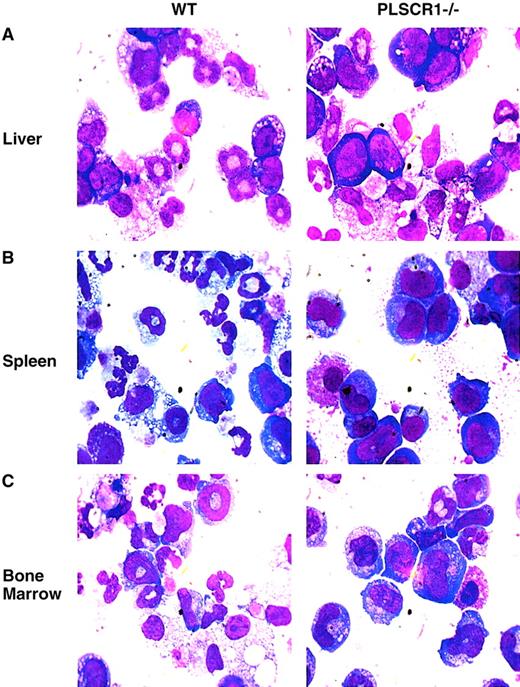
When cultured in the presence of G-CSF and SCF, hematopoietic precursor cells derived from PLSCR1−/− animals showed distinctly fewer resulting mature granulocytes and a higher proportion of immature cells than identically treated cultures of WT cells (Figure6; Table3).
Impaired myeloid differentiation of PLSCR1−/−hematopoietic precursor cells.
Newborn (day 1) liver cells (A), adult spleen cells (B), and adult bone marrow cells (C), were cultured in MethoCult 3234 supplemented with 20 ng/mL SCF and 60 ng/mL G-CSF for either 8 (liver), 10 (spleen), or 7 (bone marrow) days, respectively. The cells were washed and transferred to glass slides by cytospin and stained with Wright-Giemsa solution. Slides were examined at × 1000 magnification.
Maturation of WT and PLSCR1−/− hematopoietic cells during culture in G-CSF and SCF
| . | PLSCR1+/+, % . | PLSCR1−/−, % . |
|---|---|---|
| Newborn liver | ||
| Promyelocytes | 4 | 14 |
| Myelocytes | 21 | 48 |
| Bands | 45 | 27 |
| Segmented neutrophils | 28 | 9 |
| Other cells3-150 | 2 | 2 |
| Adult spleen | ||
| Promyelocytes | 10 | 13 |
| Myelocytes | 30 | 52 |
| Bands | 20 | 30 |
| Segmented neutrophils | 38 | 4 |
| Other cells3-150 | 3 | 3 |
| Adult bone marrow | ||
| Promyelocytes | 5 | 15 |
| Myelocytes | 35 | 54 |
| Bands | 33 | 20 |
| Segmented neutrophils | 23 | 9 |
| Other cells3-150 | 4 | 2 |
Differential cell counts were obtained on Wright-Giemsa smears described in Figure 6. A total of 500 cells were evaluated in each slide and percent of each cell type determined.
Includes monocytes, plasma cells, and lymphocytes.
PLSCR1−/− mice show reduced granulocytosis when treated with G-CSF
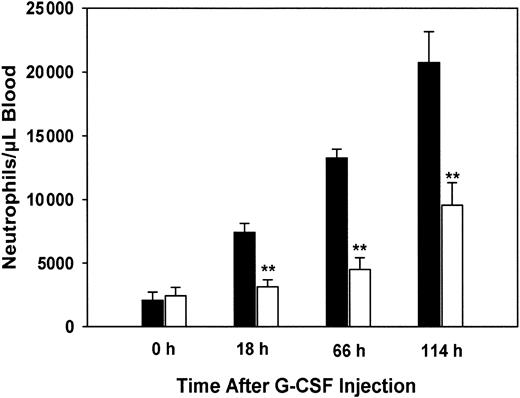
We next determined whether the aberrant response to G-CSF stimulation observed for PLSCR1−/− hematopoietic precursor cells when cultured in vitro was also reflected in the myeloproliferative response of the PLSCR1−/− mice to in vivo challenge with this cytokine. Age- and sex-matched WT and PLSCR1−/− animals were injected daily with recombinant human G-CSF, and blood neutrophil counts were determined (Figure7).
Reduced granulocytosis in PLSCR−/− mice treated with G-CSF.
Human recombinant G-CSF was injected subcutaneously into 5 each age-matched WT (■) and PLSCR1−/− (□) male mice at doses of 120 μg/kg at time 0 and daily thereafter. Blood samples were collected before and 18, 66, and 114 hours after the initial G-CSF injection. Neutrophil counts were derived from whole blood WBC counts and WBC differential counts. **P < .01 compared with WT.
WT mice responded to G-CSF with a rapid increase in blood neutrophils, reaching 10-fold basal levels at 114 hours. By contrast, in the PLSCR1−/− mice the response to G-CSF was distinctly delayed and depressed, with blood neutrophils increasing to less than 4-fold basal levels at 114 hours. Examination of the leukocytes in peripheral blood smears obtained from the mice after G-CSF administration revealed a small increase in the percentage of immature myeloid precursors (myelocytes, predominantly, and bands) in the PLSCR1−/− mice compared with WT (data not shown). This is consistent with the impaired maturation of granulocytes that was observed upon in vitro culture of the PLSCR1−/−hematopoietic precursors under G-CSF stimulation (Figure 6; Table 3). To determine whether the decreased granulocytosis observed in the PLSCR1−/− mice was related to an inherently depressed proliferative response to cytokine stimulation or to increased tendency of the PLSCR1−/− cells to subsequently undergo apoptosis, we evaluated the spontaneous apoptosis of neutrophils derived from these animals during short-term culture in the presence of G-CSF. We observed no difference in either the rate or extent of apoptosis of PLSCR1−/− neutrophils relative to WT under these conditions. Similarly, no difference in the rate or extent of apoptosis was observed when we compared WT and PLSCR1−/− T lymphocytes cultured in concanavalin A and IL-2 (data not shown). These results suggest that cellular PLSCR1 promotes neutrophil production by augmenting the proliferative and differentiation responses of myeloid hematopoietic progenitors to stimulation by G-CSF.
PLSCR1 expression is induced by select hematopoietic growth factors
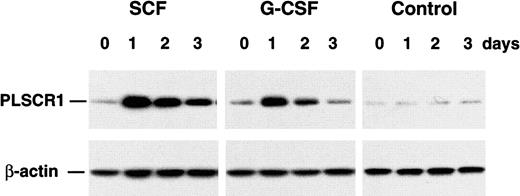
Expression of PLSCR1 is known to be highly induced by both type I and II interferons, a response dependent upon Stat-1 and a single interferon-stimulated response element located in the first untranslated exon of the PLSCR1 gene.10 14 The depressed response to certain hematopoietic growth factors observed for cells derived from the PLSCR1−/− mice raised the possibility that PLSCR1 itself normally participates in the cascade of events underlying growth factor–stimulated cellular proliferation and differentiation and led us to consider whether this response might also include a cytokine-induced increase in PLSCR1 expression. As shown in Figure 8, G-CSF and SCF each induced a marked increase in the cellular content of PLSCR1. These results are consistent with a role for newly synthesized PLSCR1 in an effector pathway mediating the cellular response to these cytokines. By contrast to the increased expression of PLSCR1 in WT bone marrow cells observed in response to G-CSF and SCF, there was no apparent change in PLSCR1 levels in response to culture in either TPO or EPO (data not shown).
Cytokine-induced expression of PLSCR1.
Cultured bone marrow progenitors from 5 age-matched adult mice were incubated for 3 days in MethoCult 3234 supplemented with either 20 ng/mL SCF or 60 ng/mL G-CSF. Cells were harvested at indicated times, and cell lysates (6 μg total protein per lane) were analyzed by Western blotting for PLSCR1 antigen (see “Materials and methods”).
Discussion
The results of these experiments provide the first direct evidence that the expression of PLSCR1, and potentially other members of the PLSCR gene family, can influence the proliferative and differentiation response of cells to cytokine stimulation, which in the case of murine hematopoietic precursors selectively affects granulocyte production as stimulated by SCF and G-CSF. These data add to the growing body of evidence that PLSCR1 functions in signaling or effector pathways potentially involved with cell proliferation, differentiation, or apoptosis, presumably through its interaction with the various intracellular kinases that have been reported to phosphorylate this protein.4-6 Interestingly, despite the attenuated myeloid colony growth in response to both SCF and G-CSF observed for PLSCR1−/− cells, the untreated adult PLSCR1−/− mice show no evidence of a relative granulocytopenia, implying complete compensation under normal conditions. Presumably, such compensation in vivo reflects the normal proliferative responses we observed when the PLSCR1−/−hematopoietic precursor cells were stimulated by other cytokines promoting myeloid expansion, particularly IL-3 and GM-CSF.
Our data also indicate that PLSCR1, despite its putative identification as plasma membrane PL scramblase, is not required for normal movement of PS from the inner to outer leaflet of the plasma membrane under conditions of either receptor-initiated platelet activation or direct elevation of intracellular Ca++. As previously reported, we also found that both the mRNA sequence and level of protein expression of PLSCR1 in blood cells obtained from a patient with Scott syndrome were identical to that of normal controls, implying that this bleeding disorder that was shown to reflect diminished function of the PL scramblase pathway in platelets and other blood cells does not reflect either deficiency or defect in PLSCR1.15 Together with the results of the current experiments, these data imply that PLSCR1 may not function in the plasma membrane PL scramblase pathway as was presumed, although we cannot exclude the possibility that PLSCR1 provides redundant function with another member of the PLSCR gene family in mediating this activity. Of the 4 PLSCR genes that have been identified in human beings and mice, only PLSCR1 and PLSCR3 are readily detected in blood and bone marrow. PLSCR3 shares 47% identity with PLSCR1.3 Of interest in this context, examination of blood, bone marrow, spleen, and thymus of PLSCR1−/− mice did not reveal any difference in the level of expression of PLSCR3 antigen from that detected in WT, implying that there is no compensatory up-regulation of PLSCR3 gene expression in the PLSCR1−/− knock-out (Q.Z., J.Z., T.W., P.J.S., unpublished data, January 2002). Like the other members of this gene family, the biologic function of PLSCR3 remains unresolved.
The mechanism by which PLSCR1 affects cell proliferative and differentiation responses to select growth factors remains to be determined. Of particular interest are previous observations that PLSCR1 is the substrate of kinases implicated in participating in regulation of growth, differentiation, and apoptosis, including protein kinase Cδ, c-Abl, and unknown kinase(s) activated through cell surface IgE receptors and EGF receptors.4-7 In the case of c-Abl, it is known that this interaction with PLSCR1 entails binding of the c-Abl SH3 domain to a proline-rich segment within the N-terminal portion of PLSCR1 and that phosphorylation occurs at 2 residues (Tyr69, Tyr74 in human PLSCR1) also found within this segment of the polypeptide.6 As noted above, a spontaneous deletion of the corresponding portion of murine PLSCR1 that was identified in clones derived from the mouse monocytic cell line has been implicated in their leukemogenic transformation, which also suggests a possible role of PLSCR1 in the normal regulation of cytokine-dependent proliferation and differentiation responses.11
The defective proliferation and differentiation of PLSCR1−/− hematopoietic precursors when stimulated by SCF or G-CSF, but not the other cytokines tested, implies that PLSCR1 plays a selective role in either the signaling or effector pathways initiated through the c-kit and G-CSF receptors (G-CSFRs). Stimulation of c-kit or G-CSFRs initiates multiple intracellular signaling events leading to nuclear transcription, which utilize enzymes, adaptor proteins, and transcription factors that are both common to and divergent from those recruited by other activated growth factor receptors.25-27Comparison of the known downstream signaling events that are common to both c-kit and G-CSFR, to those initiated by the other growth factor receptors that appear to normally function in PLSCR1−/−cells (eg, IL-3R and GM-CSFR), does not provide an obvious explanation for why the response to SCF and G-CSF might be selectively impaired in cells genetically deficient in PLSCR1. On the other hand, the observation that the expression of PLSCR1 is also markedly induced following stimulation by SCF and G-CSF in the WT cells suggests that PLSCR1 contributes to the cellular response to these cytokines through a posttranscriptional effector pathway(s) underlying subsequent colony expansion and differentiation. Insight into how increased cellular content of PLSCR1 might serve to promote proliferation and differentiation of myeloid-committed cells as stimulated by SCF and G-CSF, and its potential contribution to other growth factor receptor–regulated responses, awaits further clarification of the precise intracellular function(s) of PLSCR1 and other members of this unique gene family.
The authors acknowledge the superb technical assistance of Ms Hongfan Peng and Ms Lilin Li. We are most grateful to Dr Robert McMillan for generously providing recombinant G-CSF. We also wish to acknowledge the advice, comments, suggestions, and generous assistance of Drs Dong-Er Zhang, Bruce Torbett, Yuzhong Yuan, and Ming Yan. This is manuscript no. 14654-MEM from the Scripps Research Institute.
Prepublished online as Blood First Edition Paper, April 17, 2002; DOI 10.1182/blood- 2001-12-0271.
Supported in part by National Institutes of Health grants HL36946, HL63819, and HL61200.
The publication costs of this article were defrayed in part by page charge payment. Therefore, and solely to indicate this fact, this article is hereby marked “advertisement” in accordance with 18 U.S.C. section 1734.
References
Author notes
Peter J. Sims, Dept of Molecular and Experimental Medicine, MEM-275, The Scripps Research Institute, 10550 North Torrey Pines Rd, La Jolla, CA 92037; e-mail: psims@scripps.edu.

This feature is available to Subscribers Only
Sign In or Create an Account Close Modal