Abstract
In this study, flow cytometry was used to evaluate interleukin-6 (IL-6) production by bone marrow mononuclear cells from 47 patients with multiple myeloma (MM) in different clinical stages and 15 patients with monoclonal gammopathy of undetermined significance. In patients with MM, autocrine IL-6 production paralleled the clinical disease stage. The largest proportion of syndecan-1+/IL-6+ cells was detected in patients with resistant relapse or primary refractory disease, suggesting that tumor progression involves expansion of myeloma cells producing IL-6. The authors assessed autocrine IL-6 production and in vitro proliferation and apoptosis of myeloma cells in 6 myeloma cell clones (MCCs) and in 2 myeloma cell lines, namely IM-9 and U-266-1970, which showed different sensitivities to the addition of exogenous IL-6. Autocrine IL-6 production was observed in IL-6–independent MCC-2, MCC-3, and MCC-5 cloned from patients with aggressive disease and in the IM-9 cell line. In contrast, IL-6–dependent MCC-1, MCC-4, and MCC-6 were syndecan-1+ and IL-6−. Blocking experiments with anti–IL-6 monoclonal antibody from clone AH65, which binds IL-6–IL-6Rα complexes, prevented cell proliferation of IL-6+ MCCs. Flow cytometry evaluations after propidium iodide staining revealed different susceptibilities of MCCs to cell death. IL-6–producing MCCs showed minimal spontaneous and dexamethasone-induced apoptosis, whereas a regular amplitude of apoptosis occurred in the IL-6− MCCs. These data provide evidence that autocrine IL-6 reflects a highly malignant phenotype of myeloma cells. In fact, autocrine IL-6 production and deregulated apoptosis may induce expansion of selective IL-6+ myeloma cells resistant to spontaneous and drug-induced cell death.
Introduction
Interleukin 6 (IL-6), a pleiotropic cytokine produced by a variety of cells, is the most important growth factor for human multiple myeloma (MM).1-3 Several findings support in vivo and in vitro roles for IL-6 in the disease: specifically, (1) serum IL-6 and IL-6R levels were found to correlate with disease activity4-6; (2) therapy with anti–IL-6 monoclonal antibody (mAb) transiently reversed disease manifestations7; (3) in vitro proliferation of myeloma cells was suppressed by neutralizing mAbs to either IL-6 or its cellular receptors8,9; and (4) inactivation of IL-6 messenger RNA by antisense oligonucleotides inhibited proliferation of plasma cells.10 Furthermore, other cytokines, such as IL-1, IL-3, and granulocyte-macrophage colony-stimulating factor, regulate myeloma cell proliferation in synergy with IL-611or by inducing IL-6 production in myeloma cells or the tumor environment.12,13
The cellular origin of IL-6 is controversial. Several authors13-16 showed that it is produced by the myeloma cells themselves (autocrine hypothesis). Other studies,17-19 however, point to its paracrine production by cells in the bone marrow (BM) and suggest that proliferation of myeloma cells depends on close contact with stromal cells.20,21 The major criticism of the autocrine hypothesis is based on the facts that marrow IL-6–producing cells other than myeloma cells may occur in the enriched myeloma cell population1 and that sorting of malignant plasma cells using CD38 or CD45 antigen expression can activate IL-6 production.1
More recent studies22,23 demonstrated that IL-6 is an antiapoptotic factor for myeloma cells in that it prevents spontaneous,22,24 drug-induced,22,23,25 and Fas-induced26 apoptosis and thereby modulates MM cell growth and survival. Experimental evidence suggests that these 2 effects are dissociable and mediated by distinct signaling pathways.27 Interaction of IL-6 with its α-chain receptor, gp80, induces homodimerization of gp130, the signal-transducing receptor component, as well as activation of different downstream pathways, such as activation of Stat-1, Stat-3, or Ras proteins, with subsequent activation of the kinase cascade that includes the mitogen-activated protein kinases (MAPK).28,29 Activation of the MAPK cascade induces cell growth, whereas the Stat-3 pathway has an antiapoptotic effect.30 On the other hand, IL-6 induces MM cell growth by means of phosphorylation of retinoblastoma protein (pRB),31 the function of which is regulated by its phosphorylation status: dephosphorylated pRB binds E2F and induces arrest of G1 cell growth, whereas phosphorylated pRB drives cell proliferation. Exogenous IL-6, by down-regulating dephosphorylated pRB, decreases E2F-pRB complexes and promotes cell proliferation.31
Dexamethasone (Dex) alone or in combination with cytotoxic drugs is frequently used in the treatment of MM.32 Its mechanism of action is unclear: it has been shown that the binding of glucocorticoids to specific receptors alters the gene transcription in a positive or negative manner. In particular, Dex (10−6-10−7 M) induces cell apoptosis by inhibiting IL-6 gene expression and, at higher concentrations, reducing cellular IL-6R expression.33 Exogenous IL-6 prevents Dex-mediated apoptosis through down-regulation of p21WAF1 (p21) expression, which is related to CDK2, CDK4, and CDK6 kinase activities and phosphorylation of pRB.34
Because of the central role of IL-6 in MM, it is important to define its cellular source precisely. Therefore, in this study, we evaluated autocrine and paracrine IL-6 production in bone marrow mononuclear cells (BMMC) from patients with MM by using flow cytometry to identify directly the phenotype of cells producing IL-6. We also analyzed the relation between autocrine IL-6 production and susceptibility of myeloma cells to spontaneous and drug-induced apoptosis.
Patients, materials, and methods
Patients
Sixty-two patients who fulfilled the Southwest Oncology Group (SWOG) diagnostic criteria35 for MM (47 patients) or monoclonal gammopathy of undetermined significance (MGUS) (15 patients) were enrolled in the study. According to the Durie and Salmon staging system36 and SWOG myeloma response criteria,37 the MM group comprised 7 patients with a recent diagnosis (2 patients with stage I disease and 5 patients with stage II-III disease), 4 with primary refractory disease, 13 with relapsing disease, 7 with resistant relapse, and 16 in complete or partial remission. Patients with resistant relapse or primary refractory disease were considered to have aggressive disease. The study was approved by the Ethics Committee of the University of Bari, Italy, and all patients gave informed consent to participation.
BMMC and cell cultures
Mononuclear cells were isolated from BM samples by means of Ficoll-Hypaque gradient centrifugation, washed, and resuspended at 1 × 10⁶ cells/mL in RPMI 1640 culture medium containing 10% fetal-calf serum, 2 mM glutamine, 100 U/mL penicillin, and 100 μg/mL streptomycin (all from Biochrom, Berlin, Germany). Six myeloma cell clones (MCCs) and 2 myeloma cell lines, namely IM-9 and U-266-1970 (American Type Culture Collection, Rockville, MD), were included in the study. MCCs were obtained from the BM of patients with MM in different clinical stages, as described previously.24 Cryopreserved samples were thawed and cultured in the medium described above or the presence of 500 U/mL IL-6 (Genzyme, Cambridge, MA), according to their particular proliferative features.24 The MCCs included at least 98% plasma cells and were used at early passages; thus, they had biologic characteristics resembling those of freshly expanded myeloma cells. The 2 myeloma cell lines, IM-9 and U-266-1970 (early passage),27,38 were used as controls for IL-6–independent and IL-6–dependent myeloma cell lines, respectively.8
Flow cytometry identification of myeloma cells
Flow cytometry was used to phenotype fresh plasma cells and established MCCs by comparing their cytoplasmic immunoglobulin (Ig) content with their membrane expression of CD38 and syndecan-1 (CD138) antigens. Briefly, 1 × 10⁶ cells were incubated with the unconjugated mAb to CD38 (Becton Dickinson, Mountain View, CA) and with the second antibody conjugated to peridinin chlorophyll protein (Becton Dickinson). Cells were then treated with a fluorescein isothiocyanate (FITC)–conjugated mAb to syndecan-1 (Serotec Limited Ltd, Oxford, United Kingdom), fixed, permeabilized, and incubated with a polyclonal phycoercythrin (PE)-conjugated antihuman κ-chain or λ-chain antiserum (Jackson Immunoresearch, West Grove, PA). Cytometric analysis was done with the Cell Quest program in a fluorescence-activated cell-sorter scanner (FACScan; Becton Dickinson).
Intracellular IL-6 production
Immunofluorescence staining of intracellular IL-6 was done according to the method described by Prussin and Metcalfe,39 with slight modifications. Briefly, in accordance with the procedure suggested by the manufacturer (Biosource, Camarillo, CA), cell samples (1 × 10⁶) were stimulated for 6 hours with 1 μg/mL lipopolysaccharide (LPS; Sigma, St Louis, MO) in round-bottomed tissue culture tubes and in the presence of 2 μM monensin (Sigma) to prevent extracellular transport of the cytokine. LPS is a nonspecific immunostimulatory treatment used to elicit cytokine production.40 Cultures without monensin or exogenous stimuli were included as controls. In preliminary experiments, we found that the optimal incubation time for cells to express IL-6 in short-term cultures was 6 hours. After incubation, cells were washed with phosphate-buffered saline (PBS) and fixed with 4% paraformaldehyde for 15 minutes at room temperature. After 2 additional washings in PBS, samples were resuspended in permeabilization buffer (PBS containing 0.5% bovine serum albumin and 0.5% saponin) and incubated for 30 minutes at 4°C with PE–conjugated anti–IL-6 mAb (Biosource). To ensure the specificity of IL-6 staining, the binding of anti–IL-6 mAb was blocked with an excess of cytokine (500 U/mL) before staining. As a last step, myeloma cells were identified by using an FITC-conjugated mAb specific to syndecan-1. The negative controls included isotype-matched irrelevant antibodies. Samples were analyzed with a FACScan.
Proliferation assay
The proliferative rate of each MCC and myeloma cell line was evaluated by assessing tritium-thymidine uptake. Briefly, cells (104/well) were incubated overnight in culture medium or the presence of 500 U/ml IL-6 (Genzyme) and pulsed overnight with tritium-thymidine (7400 Bq/well; Du Pont NEN, Bad Homburg, Germany). Uptake was measured in a β-counter (Beckman, Palo Alto, CA). The sensitivity of MCCs to exogenous IL-6 was evaluated on the basis of their tritium-thymidine uptake and expressed as a stimulation index (SI) calculated as follows: counts per million per sample plus IL-6 divided by counts per million per sample. SI values below 3 and greater than 3 indicated IL-6–independent and IL-6–dependent cell proliferation, respectively.
Inhibition assay
To verify the effect of IL-6 on myeloma cell growth, an inhibition assay of the proliferative rate of MCCs was done by using an anti–IL-6 mAb (clone AH65; Immunotech, Marseilles, France). Preliminary experiments showed that this mAb inhibited the in vitro growth of IL-6–dependent MCCs in the presence of 25 pg/mL exogenous IL-6. Complete blocking was obtained with a mAb concentration of 10 ng/mL. The inhibitory effect of the same mAb on IL-6–independent MCCs was evaluated by using bromodeoxyuridine (BrdU)–propidium iodide (PI) staining.41 Briefly, washed MCCs were cultured in 96-well plates at a density of 1 × 10⁶ cells/mL for 20 hours at 37°C in culture medium or the presence of anti–IL-6 mAb (100 ng/mL). Cells were then incubated for 3 hours in the presence of 15 μM BrdU (Sigma), fixed with 70% cold ethanol, and treated with 2N hydrochloric acid to partly denature the DNA. After washing with 0.1 M sodium borate to neutralize the acid, the cell suspensions were incubated with FITC-conjugated mAb to BrdU (Becton Dickinson), resuspended in 5 μg/mL PI solution (Sigma), and analyzed by using flow cytometry. The uptake of BrdU (a thymidine analog) into DNA identifies cells undergoing DNA synthesis. The inhibitory effect was calculated as follows: (percentage of BrdU+ cells in the presence of anti–IL-6 mAb divided by the percentage of BrdU+ cells in culture medium) times 100.
Assessment of apoptosis
The susceptibility of MCCs and myeloma cell lines to spontaneous and Dex-induced apoptosis was evaluated by using cytofluorometric analysis of PI cell staining.42 Cells (1 × 10⁶) incubated in complete medium or with 10−6 M Dex (Sigma) for 24 hours at 37°C were fixed with 70% cold ethanol for 3 hours at 4°C, incubated overnight with PI isotonic solution (50 μg/mL), and evaluated by using flow cytometry. The extent of the subdiploid DNA peak reflected the percentage of apoptotic cells.
Statistical analysis
The Student t test and, in several instances, the Wilcoxon nonparametric method were used to compare the mean values of specific phenotype expression and in vitro variables.
Results
Autocrine and paracrine IL-6 production
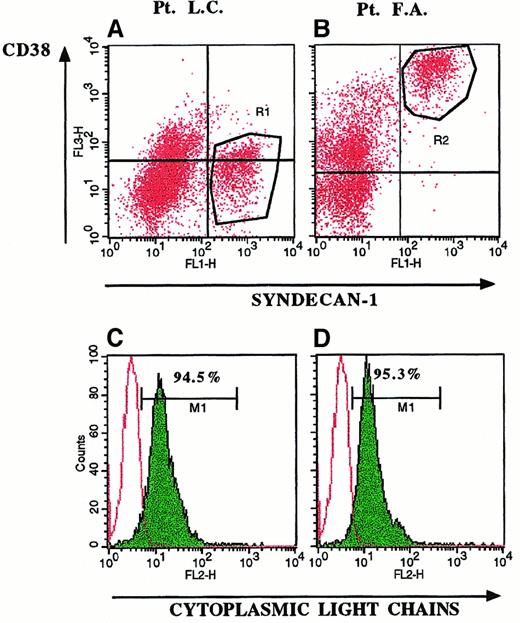
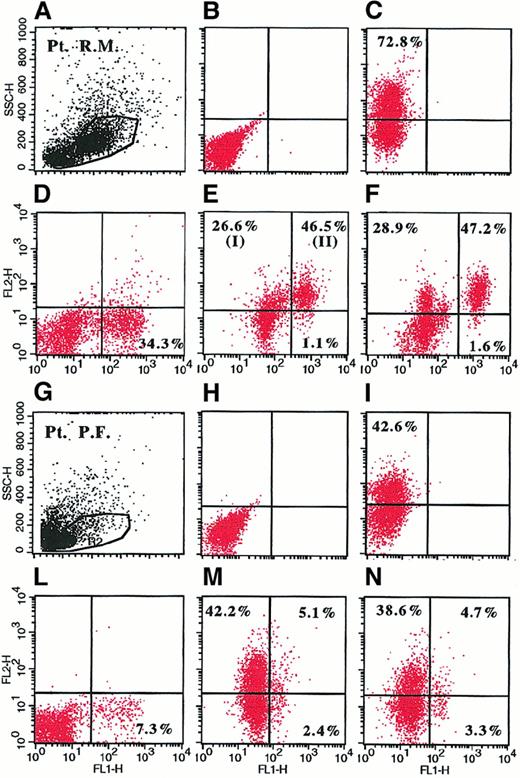
Detection of cytoplasmic IL-6 in BMMC by double-fluorescence staining directly identifies the phenotype of IL-6–producing cells and consequently distinguishes autocrine from paracrine cytokine secretion. Myeloma cells were identified using an FITC-conjugated mAb to syndecan-1, which is specifically expressed by myeloma tumor cells among BMMC (Figure 1). Usually, myeloma cells are identified by the phenotype CD38bright(Figure 1B, R2 region). However, CD38 is an activation antigen that is also expressed by other cells and is sometimes not expressed on myeloma cells (Figure 1A, R1 region). Gating of BMMC on syndecan-1+populations (R1 and R2 regions) demonstrated expression of monoclonal cytoplasmic Ig on 95% of syndecan-1+ cells (Figure 1C and1D) and suggested that syndecan-1+ populations were indeed myeloma cells.43 Therefore, the presence of syndecan-1+/IL-6+ cells and syndecan-1−/IL-6+ cells indicates autocrine and paracrine cytokine production, respectively (Figure2). In particular, IL-6 staining was detected only in the saponin-permeabilized samples (Figure 2C compared with Figure 2B and Figure 2I compared with Figure 2H) and was blocked by the addition of an excess of IL-6 (Figure 2D and 2L), indicating that cell staining was due to intracellular cytokine, not false staining. In addition, because the percentages of syndecan-1+/IL-6+ cells in short-term cultures of LPS-stimulated BMMC (Figure 2E,M) were similar to those in unstimulated cells (Figure 2F,N), they indicated the in vivo capacity of cells to produce the cytokine.44 LPS stimulation increased the fluorescence intensity of positive cells (Figure 2M compared with Figure 2N and Figure 2E compared with Figure 2F) and allowed a clear definition of the cut-off point at which a cytokine-specific signal was considered positive.
Selective expression of syndecan-1 on myeloma cells.
Three-color fluorescence staining of BMMC in 2 representative patients with MM (Patient LC, panels A and C; and Patient FA, panels B and D) demonstrated expression of syndecan-1 on CD38− (A, R1 region) and CD38bright cells (B, R2 region). Gating of BMMC on syndecan-1+ cells (R1 and R2 regions) yielded the histograms shown in C and D. Expression of cytoplasmic monoclonal Ig (C,D) demonstrated that 95% of syndecan-1+/CD38− (R1 region) and syndecan-1+/CD38+ (R2 region) BMMC were myeloma cells.
Representative dot plots derived from analysis of intracellular IL-6 in BMMC by flow cytometry in 2 representative patients with MM.
BMMC were stimulated for 6 hours with 1 μ/mL LPS (A-E, G-M) or culture medium (F,N) in the presence of 2 μM monensin. Cells were fixed, permeabilized (C-F, I-N), and stained with PE-conjugated anti–IL-6 mAb (Y axis) and FITC-conjugated anti-syndecan-1 mAb (X axis). Shown are BMMC gate (A,G); unpermeabilized (B,H) and permeabilized (C,I) LPS-stimulated BMMC (B-C and H-I) stained with PE-conjugated anti–IL-6 mAb and isotype control; LPS-stimulated BMMC incubated with 500 U/mL recombinant IL-6 before staining and stained with PE-conjugated anti–IL-6 mAb and FITC-conjugated anti-syndecan-1 mAb (D,L); and LPS-stimulated (E,M) and unstimulated (F,N) BMMC (E,F and M,N) stained with PE-conjugated anti–IL-6 mAb and FITC-conjugated anti-syndecan-1 mAb. In panel E, I shows syndecan-1−/IL-6+ cells corresponding to paracrine IL-6 production; and II shows syndecan-1+/IL-6+ cells corresponding to autocrine IL-6 production.
Cytofluorometric analysis of cytoplasmic IL-6 in BMMC showed the presence of both autocrine and paracrine IL-6 production in patients with MM and MGUS (Table 1). However, whereas elevated percentages of syndecan-1−/IL-6+ BMMC were observed in patients with active MM (40.5% ± 12.9%), as well as in those in remission (43.2% ± 12.3%) and those with MGUS (39.8% ± 9.3%), IL-6 production by myeloma cells was related to tumor progression: syndecan-1+/IL-6+ BMMC percentages were significantly (P < .01) higher in patients with active disease (42.4% ± 18.6%) than in those in remission (3.7% ± 1.8%) and those with MGUS (6.8% ± 4.1%).
IL-6 production by BMMC from patients with MGUS and MM
| Disease status . | BMMC (%) . | |
|---|---|---|
| Syndecan-1−/IL-6+ . | Syndecan-1+/IL-6+ . | |
| Active MM (n = 31) | 40.5 ± 12.9 | 42.4 ± 18.6* |
| Primary refractory/resistant relapse (n = 11) | 33.1 ± 10.6 | 52.8 ± 13.5* |
| Recent diagnosis (n = 7) | 44.8 ± 12.2 | 31.3 ± 16.6* |
| Relapse (n = 13) | 44.3 ± 13.3 | 39.5 ± 13.4* |
| Remission MM (n = 16) | 43.2 ± 12.3 | 3.7 ± 1.8 |
| MGUS (n = 15) | 39.8 ± 9.3 | 6.8 ± 4.1 |
IL-6 indicates interleukin 6; BMMC, bone marrow mononuclear cells; MGUS, monoclonal gammopathy of undetermined significance; and MM, multiple myeloma.
P < .01.
Heterogeneous IL-6 production by myeloma cells
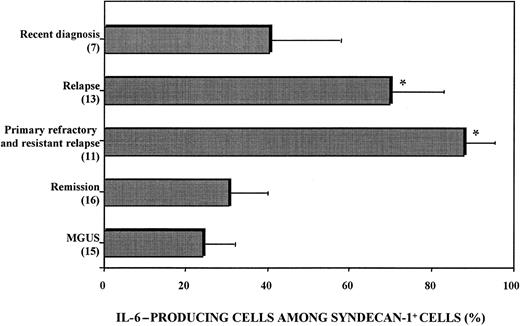
Flow cytometry analysis showed that IL-6 production by malignant plasma cells was heterogeneous (Figure3). The proportion of syndecan-1+ cells expressing cytoplasmic IL-6 ranged from 16% to 99% of total syndecan-1+ cells and was higher in patients with relapse (70.1% ± 12.2%) or aggressive disease (resistant relapse and primary refractory disease, 88.0% ± 7.8%) than in patients with a recent diagnosis (41.3% ± 16.2%) or patients in remission (30.9% ± 10.1%; Figure 3).
Heterogeneous IL-6 production by myeloma cells.
BMMC were stimulated with 1 μg/mL LPS and 2 μM monensin. Cells were fixed, permeabilized, stained with PE-conjugated anti–IL-6 mAb and FITC-conjugated anti–syndecan-1 mAb, and analyzed with use of flow cytometry. The proportion of IL-6–producing cells among syndecan-1+ BMMC was calculated as follows: (percentage of IL-6–producing syndecan-1+ BMMC divided by percentage of syndecan-1+ BMMC) times 100. Patients with primary refractory disease and resistant relapse had the highest proportion values. P < .005 compared with patients with MGUS.
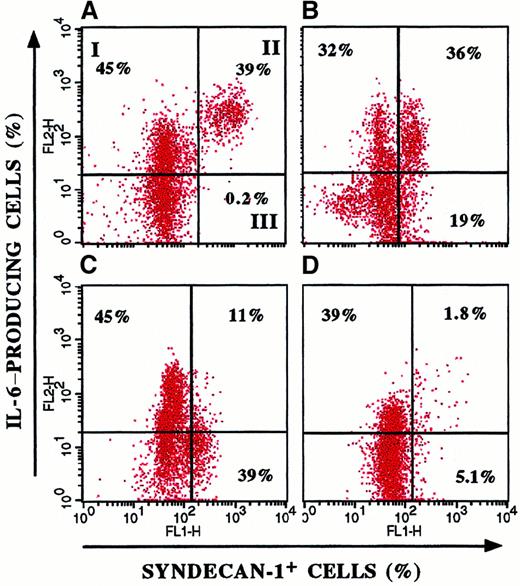
Figure 4 shows the heterogeneous IL-6 production and its parallelism to clinical stage in 4 representative patients. In particular, patients with a recent diagnosis (Figure 4B,C) had a wide distribution of ratio values (21%-65%), whereas in patients with aggressive disease (Figure 4A), the entire myeloma cell population produced IL-6. These data suggest that selection and expansion of syndecan-1+/IL-6+ cells occur during tumor progression.
Heterogeneous IL-6 production by myeloma cells.
Double-fluorescence staining of BMMC from 4 representative patients with MM for syndecan-1 and cytoplasmic IL-6 expression showed variable IL-6 production by myeloma cells. I indicates syndecan-1−/IL-6+ BMMC; II, syndecan-1+/IL-6+ BMMC; and III, syndecan-1+/IL-6− BMMC. The proportion of IL-6–producing cells among syndecan-1+ cells was evaluated as follows: (percentage of syndecan-1+/IL-6+BMMC divided by percentage syndecan-1+/IL-6−BMMC) times 100. The patient with resistant relapse (A) showed the largest proportion (99%) compared with patients with a recent diagnosis (B, 65%; and C, 22%) and patients in remission (D, 26%).
Autocrine IL-6 production and IL-6–independent cell growth
Because the in vitro proliferation of some myeloma cell lines is independent of IL-6, the relation between IL-6 insensitivity and autocrine IL-6 secretion was investigated by determining cytoplasmic cytokine production in 6 MCCs and 2 myeloma cell lines. In vitro growth of the cell line U-266-1970 is dependent on exogenous IL-6, whereas that of IM-9 is independent of exogenous IL-6.8
The in vitro sensitivity to IL-6 of the MCCs paralleled their heterogeneous IL-6 production (Table 2). IL-6 expression was minimal in MCC-1, MCC-4, and MCC-6, which showed the highest proliferative response to exogenous IL-6, whereas MCC-2, MCC-3, and MCC-5, the proliferative rates of which were insensitive to IL-6, expressed cytoplasmic IL-6 in 77% to 100% of cells. Two groups of myeloma cell clones were thus distinguished. IL-6+ MCCs (MCC-2, MCC-3, and MCC-5) and the IM-9 myeloma cell line showed great spontaneous proliferation not influenced by exogenous IL-6 (SI < 3), whereas in vitro growth of IL-6− myeloma cells was strictly dependent on IL-6 (SI > 3).
Results of experiments indicating that autocrine IL-6 production parallels IL-6–independent myeloma cell growth
| Myeloma cell clone/line . | Tritium-thymidine uptake . | Stimulation index . | IL-6+ myeloma cells (%) . | |
|---|---|---|---|---|
| Baseline . | With IL-6 . | |||
| MCC-1 | 6250 | 29 800 | 4.8 | 27 |
| MCC-2 | 52 136 | 59 358 | < 3 | 100 |
| MCC-3 | 7598 | 12 516 | < 3 | 80 |
| MCC-4 | 2635 | 28 419 | 10.1 | 10 |
| MCC-5 | 11841 | 22 317 | < 3 | 77 |
| MCC-6 | 1861 | 43 816 | 22.4 | 5 |
| U-266 | 8563 | 42 815 | 5.0 | 43 |
| IM-9 | 53 693 | 67 079 | < 3 | 100 |
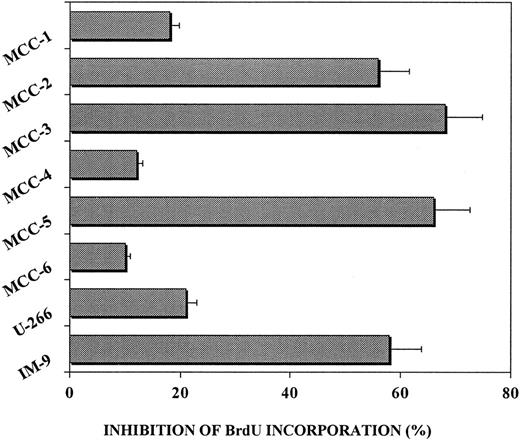
Furthermore, blocking experiments using anti–IL-6 mAb, which inhibits IL-6/IL-6Rα complexes, were done to determine whether cytoplasmic IL-6 was functionally active on IL-6+ MCCs. The effect of agonist mAb was evaluated by cytofluorometric analysis of proliferating cells after BrdU-PI staining. The 2 groups of MCCs showed a different response pattern (Figure 5). Addition of anti–IL-6 mAb prevented spontaneous cell proliferation of IL-6+ MCC-2, MCC-3, MCC-5, and the IM-9 cell line. Preliminary studies showed that this mAb inhibited proliferation of IL-6–dependent MCCs in the presence of exogenous IL-6 (results not shown). Therefore, we hypothesize that in the absence of exogenous cytokine, anti–IL-6 mAb neutralizes endogenous IL-6 and inhibits proliferation of IL-6–producing myeloma cells.
Inhibitory effect of anti–IL-6 mAb on the proliferative rate of IL-6–producing MCCs.
MCCs were incubated in culture medium or the presence of 100 ng/mL anti–IL-6 mAb. Myeloma cell proliferation was evaluated by using BrdU-PI cell incorporation. The inhibitory effect of anti–IL-6 mAb was calculated as follows: (percentage of BrdU+ cells plus anti–IL-6 mAb divided by percentage of BrdU+ cells) times 100. Addition of the anti–IL-6 mAb inhibited proliferation of IL-6+ MCC-2, MCC-3, MCC-5, and the IM-9 cell line, whereas IL-6− MCCs and the U-266-1970 cell line were only slightly affected.
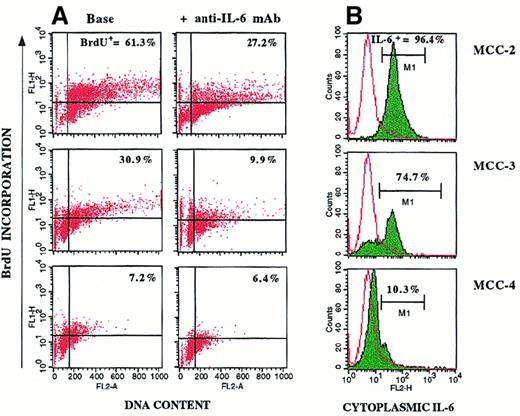
Specific results obtained with 3 representative MCCs are shown in Figure 6. The elevated percentages of spontaneously proliferating cells observed in the IL-6–insensitive MCC-2 and MCC-3 (BrdU+ cells, 61.3% and 30.9%, respectively; Figure 6A) paralleled the positivity of the clones for cytoplasmic IL-6 (Figure 6B). Addition of anti–IL-6 mAb inhibited proliferation of IL-6+ MCCs (BrdU+ cells, 27.2% and 9.9%, respectively), but it had no effective on IL-6− MCC-4, the in vitro growth of which depended on the presence of exogenous IL-6. These data suggest that autocrine IL-6 provides an endogenous proliferative stimulus that makes myeloma cell growth independent of IL-6 produced by nontumor cells.
Cytofluorometric profiles for 3 representative MCCs.
Shown are profiles for cell proliferation (A) and cytoplasmic IL-6 production (B). Cells were incubated in culture medium or the presence of 100 ng/mL anti–IL-6 mAb. Myeloma cell proliferation was evaluated by BrdU-PI cell incorporation. IL-6+ MCC-2 and MCC-3 (B) showed high percentages of spontaneous BrdU+ cells (A). Addition of anti–IL-6 mAb inhibited proliferation of MCC-2 and MCC-3, but had no effect on IL-6− MCC-4.
Autocrine production of IL-6 and susceptibility of MCCs to apoptosis
Because IL-6 rescues cells from spontaneous22,24 and drug-induced apoptosis,22,23 25 our next experiments compared the apoptotic susceptibility of MCCs to IL-6 production by using cytofluorometric analysis of DNA content after PI staining. As expected, 2 profiles of response were obtained (Table3). Spontaneous and Dex-induced apoptosis was observed only in the IL-6− MCCs, the growth of which, in the absence of exogenous IL-6, was characterized by a high susceptibility to spontaneous apoptosis. This also was increased significantly by the addition of Dex (10−6 M). In contrast, IL-6+ MCC-2, MCC-3, and MCC-5 were completely insusceptible to apoptosis. Addition of exogenous IL-6 promptly rescued IL-6−/IL-6–dependent MCC-1, MCC-4, and MCC-6 from apoptosis and stimulated their proliferation (SI > 3), whereas it had no effect on IL-6+/IL-6–independent MCCs.
Autocrine IL-6 production and resistance of myeloma cells to spontaneous and dexamethasone-induced apoptosis
| Myeloma cell clone/line . | Apoptotic cells (%) . | |||
|---|---|---|---|---|
| Spontaneous . | With dexamethasone . | |||
| Without IL-6 . | With IL-6 . | Without IL-6 . | With IL-6 . | |
| MCC-1 | 25.8 | 9.4 | 45.9 | 13.2 |
| MCC-2 | 5.4 | 3.6 | 7.3 | 6.9 |
| MCC-3 | 8.6 | 5.8 | 14.7 | 10.3 |
| MCC-4 | 47.3 | 8.2 | 85.6 | 12.7 |
| MCC-5 | 7.3 | 5.4 | 13.1 | 15.9 |
| MCC-6 | 35.4 | 5.9 | 68.4 | 8.5 |
| U-266 | 15.4 | 6.7 | 58.6 | 4.7 |
| IM-9 | 4.1 | 3.9 | 4.5 | 5.1 |
These data demonstrate the close relation between IL-6 production and apoptotic susceptibility of MCCs. They also imply that autocrine IL-6 production offers protection against spontaneous and drug-induced apoptosis.
Discussion
In this study, flow cytometric detection of intracellular IL-6 and the correlation of its expression with cell-surface phenotype in fresh BMMC, without sorting of cell subpopulations, revealed that autocrine IL-6 production occurs in MM and parallels its clinical stages. Although several studies support the idea that IL-6 is produced by myeloma cells,14-16,45 its origin remains controversial. The major criticism of these studies is based on the methods used to evaluate autocrine IL-6 production.1 In the current study, primary myeloma cells were identified by assessing the expression of syndecan-1 on viable cells.43 46-48 We showed that 95% of these syndecan-1+ cells secreted monoclonal Ig, but could not rule out the possibility that a small percentage of them were not tumor cells. However, compared with other techniques, which are based on sorting of myeloma cells from BMMC, cytoplasmic cytokine staining provides a simple method for directly evaluating IL-6 production by tumor cells.
We found that autocrine IL-6 production was heterogeneous and that the highest proportion of IL-6–producing cells among syndecan-1+ cells was observed in samples from patients with active disease. These findings probably reflect the heterogeneity of myeloma cells49 related to differences in their degree of maturation.15,16 We speculate that the IL-6+ phenotype could be a feature of immature cells15,16 (an idea supported by the presence of the relative defect of CD38 expression24) and may reflect clinically aggressive disease. In this study, patients with primary refractory disease and resistant relapse had the largest proportions (almost 100%) of IL-6–producing syndecan-1+ myeloma cells, a result suggesting that aggressive MM involves in vivo expansion of IL-6–producing malignant plasma cells.
In vitro functional studies revealed a close correlation between autocrine IL-6 production and IL-6–independent cell proliferation. The proliferative rate (SI ≤ 3 or > 3) of each MCC paralleled the IL-6+ phenotype, and proliferation was specifically inhibited by an anti–IL-6 mAb. In addition, the spontaneous proliferative capacity of IL-6+ MCCs was higher than that of IL-6− MCCs, which had a low percentage of BrdU+ proliferating cells in the absence of stimuli. Previously, IL-6 signaling cascades were observed in fresh myeloma cells and MM-derived cell lines.29,50,51 Activation of Stat-1, Stat-3, or both occurs in IL-6–independent cells,50 whereas activation of the Ras-dependent MAPK cascade, as indicated by phosphorylation of Shc and coimmunoprecipitation of phosphorylated Shc-Sos1, was observed in IL-6–dependent myeloma cell lines.52 On the other hand, the constitutive Shc-Sos1 binding observed in MM cells not responsive to IL-6 was not affected by exogenous IL-6.50 52 These findings indicate that autocrine IL-6 provides a proliferative stimulus to IL-6–independent cell growth and that an autocrine IL-6 loop is functioning in these myeloma cells.
Our investigation of defective apoptosis observed in myeloma cells24 in relation to autocrine IL-6 production and the proliferative response to IL-6 showed that IL-6+ MCCs resist both spontaneous and Dex-mediated apoptosis,53whereas IL-6− MCCs are highly sensitive to the apoptotic effect of IL-6 deprivation and Dex. Addition of exogenous IL-6 rescued IL-6− MCCs from cell death and confirmed its preventive effect.23,24
Urashima et al31 demonstrated that changes in the myeloma cell cycle triggered by Dex and IL-6 are related to changes in p21 protein expression. Increased p21 protein expression inhibited cyclin D-CDK4, cyclin D-CDK6, and cyclin E-CDK2 complexes and increased dephosphorylation of pRb, resulting in growth suppression.54 p21 was constitutively expressed in IL-6–responsive myeloma cell lines and its expression was down-regulated and up-regulated by IL-6 and Dex, respectively.34 IL-6 prevented Dex-induced G1 growth arrest by overcoming p21 up-regulation. In contrast, Dex and IL-6 had no effect on p21 expression of myeloma cell lines not responsive to IL-6, whereas p21 was not detected in Dex-resistant MM-derived cell lines.34 It can thus be speculated that autocrine IL-6 prevents Dex-mediated apoptosis and drives cell proliferation of IL-6+/IL-6–insensitive myeloma cells by down-modulating p21 expression.
Another intriguing hypothesis is related to Ras oncogene mutations. Ras-dependent mitogenic signals regulate cell-cycle progression by pRb. It was shown that Ras inactivation induces dephosphorylation of pRb and G1 cell arrest.55 Several studies56 found that N-Ras and K-Ras mutations are common in MM and that their frequency increases with disease progression. The association of Ras mutations with the disease stages described by Durie and Salmon suggests that they are progression events.56 On the other hand, transfection of activated Ras complementary DNA into the IL-6–dependent ANBL6 myeloma cell line resulted in IL-6–independent cell growth and cell protection from glucocorticoid-induced apoptosis, similar to that observed with the addition of IL-6.57 Activating Ras mutations may thus be supposed to induce myeloma cell growth independent of paracrine IL-6 and resistance to glucocorticoid apoptosis. Studies assessing whether Ras mutations are related to autocrine IL-6 production are currently being conducted in our laboratory.
In conclusion, our results indicate that autocrine IL-6 production reflects a highly malignant phenotype of myeloma cells. MM is a multistep transformation process56 in which several oncogenic events result in the selection and malignant expansion of a single IL-6+ clone. IL-6+ myeloma cells have a high proliferative capacity and are refractory to drug-induced apoptosis. Because Dex is used to treat MM, our results may have clinical implications. Selection and expansion of IL-6+Dex-resistant myeloma cells could explain Dex resistance and MM progression.
Acknowledgments
We thank Mr Vito Iacovizzi and Miss Simona Squicciarini for secretarial and technical assistance.
Supported by grants from Associazione Italiana della Ricerca sul Cancro, Milan, Italy; and the Ministry of University and Scientific and Technological Research, Rome, Italy.
The publication costs of this article were defrayed in part by page charge payment. Therefore, and solely to indicate this fact, this article is hereby marked “advertisement” in accordance with 18 U.S.C. section 1734.
References
Author notes
Franco Dammacco, DIMO—Section of Internal Medicine and Clinical Oncology, 11 Plaza G Cesare, 70124, Bari, Italy; e-mail: dimoclin@cimedoc.uniba.it.

This feature is available to Subscribers Only
Sign In or Create an Account Close Modal