Abstract
Hematopoietic stem cells (HSCs) are characterized by their dual abilities to undergo differentiation into multiple hematopoietic cell lineages or to undergo self-renewal. The molecular basis of these properties remains poorly understood. Recently the piwigene was found in the embryonic germline stem cells (GSCs) ofDrosophila melanogaster and has been shown to be important in GSC self-renewal. This study demonstrated that hiwi, a novel human homologue of piwi, is also present in human CD34+ hematopoietic progenitor cells but not in more differentiated cell populations. Placing CD34+ cells into culture conditions that supported differentiation and rapid exit from the stem cell compartment resulted in a loss of hiwiexpression by day 5 of a 14-day culture period. Expression of thehiwi gene was detected in many developing fetal and adult tissues. By means of 5′ RACE cloning methodology, a novel putative full-length hiwi complementary DNA was cloned from human CD34+ marrow cells. At the amino acid level, the human HIWI protein was 52% homologous to the Drosophilaprotein. The transient expression of hiwi in the human leukemia cell line KG1 resulted in a dramatic reduction in cellular proliferation. Overexpression of hiwi led to programmed cell death of KG1 cells as demonstrated by the Annexin V assay system. These studies suggest that hiwi maybe an important negative developmental regulator, which, in part, underlies the unique biologic properties associated with hematopoietic stem and progenitor cells.
Introduction
Hematopoietic stem cells (HSCs) have the unique ability to undergo self-renewal and to differentiate into cells belonging to multiple hematopoietic lineages.1,2 These properties allow stem cells to maintain hematopoiesis throughout the life span of an organism. The knowledge of the behavior of HSCs is limited due to their rarity, difficulty of efficient isolation, and sensitivity to manipulation.1,2 The self-renewal capacity of several classes of stem cells is thought to be controlled by external signals and intrinsic cellular processes.1-4 Over the last 2 decades, a variety of external stimuli (cytokines, matrix proteins) that alter HSC self-renewal have been the subject of intense investigation. Although a number of such external signals that interact with specific receptors on HSC have been identified, the signaling mechanisms that govern HSC self-renewal have eluded investigation. Intrinsic cellular mechanisms that regulate stem cell self-renewal have been explored in a variety of model systems including germline stem cells (GSCs) in several lower species.Drosophila has been a particularly useful model for studying biologic processes that are conserved in higher developmental systems.5-12 Therefore, in an attempt to define candidate genes that are responsible for human HSC self-renewal, we have explored the expression of genes in humans that have recently been demonstrated to play a role in Drosophila GSC self-renewal.
The GSCs provide a continuous source of totipotent cells for the production of gametes needed for fertilization.8 They are similar to HSCs in their ability to not only self-renew but also to remain capable of generating large numbers of differentiated daughter cells.8,9 The intracellular mechanisms that serve as the determinants of asymmetric-segregating cell fates of GSCs depend not only on the basic cell cycle machinery but also on a family of recently identified genes, some of which are evolutionarily conserved.7 9
A group of somatic cells in Drosophila, termed terminal filament cells, which lie distal and immediately adjacent to the GSCs, have been shown to regulate GSC division.8,10,11 Laser ablation of the terminal filament increases the rate of oogenesis by 40%.12 Loss of function mutations in a gene found in the terminal filament, termed piwi, leads to a failure of stem cell maintenance7,10; piwi is expressed not only in the terminal filament but also in the germline. Loss of piwifunction in the germline, however, is not known to affect GSC division. The protein encoded by piwi is extraordinarily well conserved along the evolutionary tree, being found in bothCaenorhabditis elegans and primates.7Our laboratory has attempted to determine if such genes were present in primitive hematopoietic cells and if they might play a role in HSC development. We report here the presence of a human homologue of thepiwi gene, termed hiwi, in a variety of primitive hematopoietic cells. The hiwi gene represents a candidate gene that may play a role in determining or regulating HSC development.
Materials and methods
Isolation of human and baboon CD34+cells
Adult human bone marrow (BM) samples (15-30 mL) were aspirated from the posterior iliac crests of healthy donors after informed consent was obtained according to guidelines established and approved by the University of Illinois at Chicago Institutional Review Board. Heparinized marrow aspirates were diluted with Dulbecco phosphate-buffered saline (DPBS) Ca++- and Mg++-free (Biowhittaker, Walkersville, MD). Diluted marrow was then underlaid with Ficoll-Paque (Pharmacia AB, Uppsala, Sweden), and centrifuged at 800g for 30 minutes at 20°C. The mononuclear cell fraction was collected and the CD34+ cells were immunomagnetically enriched using the MACS CD34 Isolation Kit (Miltenyi Biotec, Auburn, CA). Briefly, cells were incubated with hapten-labeled anti-CD34 antibody (QBEND-10, Becton Dickinson) in the presence of blocking reagent, human IgG (Bayer, Elkhart, IN), and then with antihapten coupled to MACS microbeads. Labeled cells were filtered through a 30 μm nylon mesh and separated using a high-gradient magnetic separation column. Magnetically retained cells were eluted and stained with monoclonal antibodies (MoAb) and analyzed using flow cytometric methods. The flow-through population was identified as CD34− cells. The purity of the CD34+population was routinely more than 90% (data not shown).
The BM aspirates were obtained from the humeri and iliac crests of juvenile baboons (Papio anubis) after ketamine (10 mg/kg) and xylazine (1 mg/kg) anesthesia according to the guidelines established and approved by the University of Illinois at Chicago Animal Care Committee. Heparinized marrow was diluted 1:15 in phosphate-buffered saline (PBS) and the mononuclear cell fraction obtained by centrifugation over 60% Percoll (Pharmacia AB) at 500g for 30 minutes at 20°C. The antihuman CD34 MoAb K6.1 (a gift from the Naval Medical Research Institute, Bethesda, MD), a murine IgG2a, which cross-reacts with baboon CD34 antigen, was used for the selection of the CD34+ fraction of marrow cells.13 The mononuclear cells were suspended in PBS containing 0.2% bovine serum albumin (BSA; Sigma Chemical, St Louis, MO) and stained first with biotin-conjugated K6.1 (20 μg/mL), washed, and labeled with Miltenyi streptavidin-conjugated iron microbeads (Miltenyi Biotec) and selected as described above according to manufacturer's instructions.
Flow cytometric analysis and sorting
Isolated human CD34+ cells were further fractionated based on the expression of CD38 antigen.14 Nonspecific staining was blocked using 0.1% heat-inactivated human gamma globulin (Bayer). Cells were stained with anti-CD34 MoAb conjugated to fluorescein isothiocyanate (FITC) (Becton Dickinson) and anti–CD38-phycoerythrin (PE) (Becton Dickinson). Control cells were incubated with fluorochrome-conjugated isotype-matched IgG1-FITC (Becton Dickinson) and IgG1-PE (Becton Dickinson). Immediately prior to sorting 1 μg/mL propidium iodide (PI) was added for the identification and exclusion of nonviable cells. Cells were sorted and analyzed on a FACSVantage cell sorter (Becton Dickinson). FITC, PE, and PI were excited at a wavelength of 488 nm using an argon ion laser. The CD34+ cells were sorted into CD38−, CD38lo, and CD38hi subpopulations. Positive fluorescence for each of the markers was established as fluorescence more than 99% of isotype-matched irrelevant murine IgG1 controls. Cell aggregates or debris were excluded by forward and 90° light scatter. All staining for analysis and sorting was done in the presence of 0.2% BSA in PBS on ice.
Stroma-free expansion cultures
To promote differentiation of human CD34+ cells, a stroma-free suspension culture was established as previously described.15 Tissue culture dishes (35 mm; Corning, Corning, NY) were seeded with 1 × 10⁶ CD34+cells/ well in 3 mL Iscove modified Dulbecco medium (IMDM) (BioWhittaker) containing 10% fetal bovine serum (FBS; Hyclone, Logan, UT). Cultures were placed at 37°C in 100% humidified atmosphere of 5% CO2 in air. At initiation of cultures and at 72- to 96-hour intervals, cultures received a combination of recombinant cytokines: stem cell factor (SCF), interleukin (IL)-3, and granulocyte colony-stimulating factor (G-CSF) all at 100 ng/mL (R&D Systems, Minneapolis, MN). Cultures were maintained at a cell concentration of 5 × 10⁵ to 2 × 10⁶ viable cells/mL.
Leukemia cell lines
The TF-1 lymphoblast cell line; Jurkat, a T-lymphocyte cell line; CEM, an acute T lymphoblast cell line; BV-173, a B-cell precursor cell line; K-562, a chronic myeloid cell line; KG1 and KG1a, acute myeloid cell lines; and SUPB13, an acute B lymphoblastic cell line were obtained through the American Type Culture Collection (ATCC; Rockville, MD; SUPB13, a gift from Steve Smith at the University of Chicago, Chicago, IL). The lines were maintained in RPMI 1640 (Biowhittaker) supplemented with 10% heat-inactivated FBS (except for KG1 and KG1a, which required the presence of 20% FBS), 2 mM l-glutamine, 100 U/mL penicillin, 1 mg/mL streptomycin (Biowhittaker). Granulocyte/macrophage CSF (GM-CSF; 5 ng/mL; Peprotech, Rocky Hill, NJ) was added to TF-1 culture. Cell density was maintained at 1 × 10⁵ to 1 × 10⁶ viable cells/mL.
Mesenchymal stem cells
Mesenchymal stem cells were isolated and expanded from normal human BM aspirates as described by Pittenger and coworkers.16 These purified cells were kindly provided by Osiris Therapeutics (Baltimore, MD).
Stromal cells
Bone marrow stroma was grown by seeding 1 × 10⁶low-density BM cells/162 cm2 (Corning) flask in low-glucose Dulbecco modified Eagle medium (DMEM; Mediatech, Herndon, VA) supplemented with 10% heat-inactivated FBS and 2 mMl-glutamine, 100 U/mL penicillin, 1 mg/mL streptomycin.17,18 Adherent cells were split at confluency and the nonadherent cells were discarded. Adherent cells were passaged 4 times and were then termed marrow stroma.17 18
RNA isolation
Total RNA was isolated from hematopoietic, stromal, and mesenchymal cells using Trizol (Life Technologies, Gaithersburg, MD) according to the manufacturer's instructions. Cells were pelleted and then resuspended in 1 mL Trizol per 5 × 10⁶ cells by repeated pipetting. The cell lysate was then incubated for 5 minutes at room temperature and extracted with 0.2 volumes chloroform by vortexing for 1 minute. The sample was then centrifuged for 30 minutes at 13 000 rpm (12 000g), 4°C in a microcentrifuge. The RNA was precipitated using 2 volumes isopropanol, mixed and allowed to sit at room temperature for 10 minutes. The RNA was centrifuged for 45 minutes at 13 000 rpm (12 000 g). The RNA was washed with 75% ethanol, briefly dried, and resuspended in RNase-free water or diethyl pyrocarbonate–treated (DEPC; Sigma Chemical) water (0.1%). RNA was then quantitated using a DU 650 spectrophotometer (Beckman Instruments, Palo Alto, CA). RNA was DNase treated using DNase I enzyme (Life Technologies) according to the manufacturer's instructions.
Cloning of hiwi complementary DNA from human testis
Polymerase chain reaction (PCR) amplification was performed on RNA samples using either a RNA PCR Core Kit (PerkinElmer, Foster City, CA), according to the manufacturer's instruction, except that High Fidelity Platinum Taq DNA Polymerase (Life Technologies) was substituted for AmpliTaq or a Stratagene ProSTAR First-Strand RT-PCR Kit (Stratagene, La Jolla, CA). One microgram of total RNA was used for complementary DNA (cDNA) synthesis using random hexamers to prime first-strand synthesis. The synthesized CD34+ cell cDNA was divided and used for PCR amplification. As a control, duplicate cDNA synthesis reactions were performed for each experiment without the addition of reverse transcriptase. Control PCR amplification reactions were performed using primers for glyceraldehyde phosphate dehydrogenase cDNA (GAPD; forward, 5′-ggctgagaacgggaagcttgtcat-3′; reverse, 5′-cagccttctccatggtggtgaaga-3′) for 1 cycle at 94°C/2 minutes; 5 cycles at 94°C/10 seconds, 70°C/2 minutes; 5 cycles at 94°C/10 seconds, 68°C/2 minutes; 25 cycles at 94°C/10 seconds, 66°C/2 minutes, and 1 cycle at 72°C/10 minutes, which produced a 142-base pair (bp) product. β2-Microglobulin primers were also used as an internal control (β2-microglobulin: forward, 5′-ctcgcgctactctctctttc-3; reverse, 5′-catgtctcgatcccacttaac-3′) producing a 329-bp product. PCR amplification primers were designed based on the partial publishedhiwi DNA sequence found in the Genbank database (accession number AF104260). Detection of hiwi in CD34+DNase treated RNA was performed using the primer pair hiwiF269 5′-gaagcagcctgtcttggtcagc-3′ and hiwiR269 5′-gaatcaaagctcaaaccccagtctc-3′ producing a 269-bp product. Two primer pairs were initially designed to be used in 5′ Rapid Amplification of cDNA Ends (5′ RACE) PCR strategy cloning19 AKSrev1 (reverse primer #1; 5′-cgctgtatgtggtctggcttcaggc-3′) and AKSrev2 (reverse primer #2; 5′-gggagaaacactaccacttctcacagcctg-3′). AKSrev2 is 32 nucleotides upstream from AKSrev1 and serves as a nested internal control for secondary PCR amplification. Marathon Ready Human Testis cDNA Kit (Clontech Laboratories, Palo Alto, CA) was used for primary amplification, according to manufacturer's instructions. First round PCR amplification consisted of AKSrev1 and AP-1 (5′-ccatcctaatacgactcactatagggc-3′), supplied within the cDNA Kit, under the following conditions: 1 cycle at 94°C/2 minutes; 5 cycles at 94°C/10 seconds, 71°C/2 minutes; 5 cycles at 94°C/10 seconds, 69°C/2 minutes; 25 cycles at 94°C/10 seconds, 67°C/2 minutes, and 1 cycle at 72°C /10 minutes. A single PCR product was separated on a 1% SeaPlaque Agarose (FMC, Rockland, ME) 1 × TAE gel stained with ethidium bromide and purified from the agarose using a Wizard PCR Prep Kit (Promega, Madison, WI). The isolated PCR fragment was then used in a second round of PCR amplification that used the same PCR amplification conditions listed above except that AKSrev2 was substituted for AKSrev1 and AP-2 (5′-actcactatagggctcgagcggc-3′) replaced AP-1. All PCR reactions were performed in a PerkinElmer Thermal Cycler 9700 (PerkinElmer) or Stratagene Robocycler Gradient 96 Thermal Cycler.
Cloning of hiwi cDNA from human CD34+cells
Human CD34+ cells were purified and total RNA isolated as previously described. Based on a sequence obtained from the human testis clone, primers were designed to amplify a putative full-length cDNA clone, FLhiwifor1 (forward, 5′-atgatctttggtgtgaacacaaggcagaa-3′) and FLhiwirev1 (reverse 5′-gaggtagtaaaggcggtttgacagtgacaga-3′). PCR amplification conditions were as follows: 1 cycle at 94°C/2 minutes; 5 cycles at 94°C/10 seconds, 72°C/2 minutes; 5 cycles at 94°C/10 seconds, 70°C/2 minutes; 25 cycles at 94°C/10 seconds, 68°C/2 minutes, and 1 cycle at 72°C/10 minutes.
DNA sequencing
Direct DNA sequencing of the PCR product was performed using an ABI Prism Dye Terminator Cycle Sequencing Reaction Kit (PerkinElmer) according to the manufacturer's instructions. Additional primers (Integrated DNA Technologies, Coralville, IA) were synthesized based on analyzed sequence to obtain the complete cDNA sequence.
Tissue distribution analysis
The PCR amplification was performed on 3 different multiple tissue cDNA panels: human I, human II, and human fetal (Clontech Laboratories). The following PCR conditions were used for amplification with primer pair GSP2F4(forward, 5′-ccttgccagtacgcccacaagctg-3′) and GSP1R1966(reverse, 5′-ccccacctatggttgtagtgagcatcc-3′): 1 cycle at 94°C/2 minutes; 35 cycles at 94°C/10 seconds, 70°C/15 seconds, 72°C/45 seconds; and 1 cycle at 72°C/10 minutes, which produced a 557-bp product. Positive samples were separated on a 1% SeaPlaque Agarose (FMC) 1 × TAE gel stained with ethidium bromide and purified from the agarose using the Wizard PCR Prep Kit according to the manufacturer's instructions. Asymmetric restriction endonuclease digestion was performed to determine the identity of the PCR products (data not shown).
Subcloning of hiwi into expression vector
After obtaining the putative full-length hiwi cDNA, the fragment was then subcloned into the XhoI/NotI sites of the pCIneo Mammalian Expression Vector (Promega) and used for expression studies.
Transfection and G418 selection of transfected KG1 cells
Transfection of KG1 cells was accomplished using electroporation. Electroporation of plasmid DNA into KG1 cells was performed using a Bio-Rad Gene Pulser II System (Bio-rad Laboratories, Hercules, CA). Fifty micrograms of pCIneo or pCIneo-hiwi was electroporated per 1 × 10⁵ KG1 cells accompanied with 2 μg linearized vector for each respective condition as well as a mock control that consisted of KG1 cells alone. All cells were washed with and then resuspended in DPBS prior to electroporation. The electroporation conditions were as follows: 300 V, 950 μF, using a 0.4-cm gapped cuvette (Bio-rad Laboratories) for each condition. Cells were then centrifuged and washed twice with DPBS and resuspended in IMDM supplemented with 20% heat inactivated FBS, 100 U/mL penicillin, 1 mg/mL streptomycin, and 2 mM l-glutamine and incubated overnight at 37°C in a 100% humidified incubator containing 5% CO2 in air. Cells were then counted and stained for viability using a 0.4% trypan blue solution (Sigma) on the following day. Cells were then plated at a density of 2 × 10⁴viable cells per well in a flat-bottom 96-well plate (Corning) in IMDM supplemented with 5% heat inactivated FBS, 100 U/mL penicillin, 1 mg/mL streptomycin, and 2 mM l-glutamine. Cells exposed to each experimental condition were plated in 6 separate cultures for 7 days. Several sets of transfected cells were plated under similar conditions for detection of the hiwi gene by PCR and for antibiotic selection. Similar populations of cells (pCIneo vector alone, the pCIneo-hiwi, or cells alone) were then incubated in IMDM supplemented with 20% FBS, 100 U/mL penicillin, 1 mg/mL streptomycin, and 2 mM l-glutamine containing 1 mg/mL Geneticin Selective Antibiotic (G418 sulfate; Life Technologies) for 3 weeks.
Cell proliferation assay
Cell proliferation and survival were measured by cellular uptake of MTT (3,-[4,5-dimethylthiazol-2-yl]-2,5-diphenyltetrazolium bromide; Sigma-Aldrich), which measures living cells.15Fifty microliters of a 1 mg/mL solution of filter sterilized MTT in DPBS was added to each culture volume of 200 μL containing 2 × 10⁴ viable cells per well and then incubated for 4 hours at 37°C in a 100% humidified incubator, 5% CO2 in air. Approximately half of the volume was then carefully removed (without disrupting the solubilized complex) and replaced with developing reagent that consisted of 40 mM hydrochloric acid in isopropanol. After thoroughly homogenizing the solubilized complex with the developing reagent, the plate was then read on a ELX-800 ELISA plate reader (Bio-tek Instruments, Winooski, VT) at wavelength of 570 nm with a reference wavelength of 630 nm as previously described.15 This procedure was performed on days 1 to 6 and then on day 9.
PCR detection of hiwi in transfected KG1 cells
The KG1 cells (5 × 10⁵) that were transfected with either the pCIneo vector alone, the pCIneo-hiwi, or cells alone were then harvested. Total RNA was isolated and cDNA was synthesized as previously described. PCR amplification conditions were similar to those described previously.
Apoptosisassay
The KG1 cells were transfected under the 3 separate conditions as previously described. Condition 1 consisted of a mock transfection, condition 2 consisted of an empty vector control transfection, and condition 3 consisted of the vector containing hiwi. An additional sample of KG1 cells was also serum-starved for 24 hours in IMDM, 2 mM l-glutamine, 100 U/mL penicillin, and 1 mg/mL streptomycin (Biowhittaker). Incubation conditions are similar to those described above. Transfected cells were maintained in culture for up to 32 hours and then assayed for programmed cell death by the Annexin V assay system (Pharmingen, San Diego, CA) according to the manufacturer's instructions. Briefly, cells were washed with DPBS, collected, and then resuspended in binding buffer containing Annexin V–FITC and PI at room temperature. Acquisition and analysis of data were performed on a FACSCalibur (Becton Dickinson) using the CellQuest Analysis Software (Becton Dickinson).
Chromosome localization of hiwi gene by computer-based mapping
Fluorescence in situ hybridization (FISH)
Metaphase spreads were prepared from phytohemagglutinin (PHA)-stimulated peripheral blood lymphocytes of a healthy human male, according to standard protocols. Cells were treated with 5-bromodeoxyuridine (BrdU) at an early replicating phase to induce banding pattern.22 Slides were stained with Hoechst 33258 (1 mg/mL) for 10 minutes and exposed to UV light (302 nm) for 30 minutes. Before hybridization, metaphase slides were pretreated with RNase (100 mg/mL) and pepsin (20 mg/mL) to avoid nonspecific hybridization. An approximate 80 kilobase (kb) genomic DNA fragment was cloned into the pBELObac 11 vector after screening a human BAC library (Human Genome Systems, St. Louis. MO) with the original hiwicDNA clone and was labeled with biotin 11-dUTP (Sigma Chemical) by nick translation according to standard protocols. The FISH procedure was carried out in 50% formamide and 10% dextran sulfate in 2 × standard sodium citrate (SSC) as described earlier.23,24Repetitive sequences were suppressed with a 10-fold excess of human Cot-1 DNA (Life Technologies). After overnight incubation, nonspecific hybridization and background signals were eliminated by washing the slides 3 times with 50% formamide/2 × SSC and 3 times with 2 × SSC at 42°C. Specific hybridization signals were visualized using FITC-conjugated avidin (Vector Laboratories) and counterstained with DAPI (4′-6′-diamino-2-phenylindole; Sigma; 0.025 mg/mL).25A multicolor image analysis system was used for acquisition and display of hybridization signals of metaphase chromosomes. The system consists of a Zeiss Axioplan Imaging fluorescence microscope (Zeiss, Stuttgart, Germany) attached to a PC workstation.
Results
hiwi is expressed in CD34+hematopoietic cells but not in CD34−cells
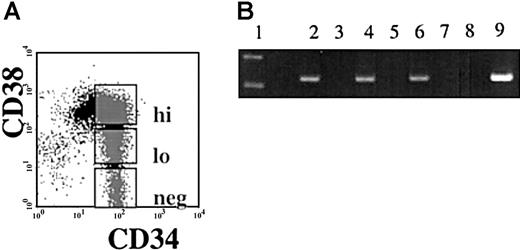
Semiquantitative reverse transcriptase PCR (RT-PCR) was performed using RNA isolated from immunomagnetically separated CD34+and CD34− cells from nonhuman primates (Papio anubis), and from humans. A 269-bp band correlating to the same size as seen in the human testis positive control was viewed in the CD34+ population and not in the CD34−population of both human and baboon. Sequence analysis confirmed that the PCR product obtained was the hiwi cDNA (Figure1). To examine if hiwiexpression was restricted to the most primitive subpopulation of human CD34+ cells, CD34+ cells were sorted according to CD38 expression into 3 subpopulations: CD34+CD38− , CD34+CD38lo, CD34+CD38hi (Figure2A). Semiquantitative RT-PCR on DNase-treated RNA isolated from each population showed that each of the 3 subpopulations expressed hiwi. These data indicate thehiwi expression is not limited to the most primitive progenitor cell population (Figure 2B).
hiwi is expressed in human CD34+ cells but not in CD34− hematopoietic cells.
Electrophoretic gel shows positive signal for hiwi in CD34+ sample and no signal in CD34− sample by semiquantitative RT-PCR. Lane 1, 123-bp DNA ladder; lane 2, CD34+ sample; lane 3, CD34− sample; lane 4, negative control (water) PCR reactions; lane 5, positive control (human testis, 269 bp).
Expression of
hiwi in subpopulations of CD34+ cells.Immunomagnetically selected CD34+ human adult BM cells were sorted based on the CD38 expression. (A) Gates were established for the flow cytometric isolation of CD34+CD38hi, CD34+CD38lo, and CD34+CD38neg. (B) Semiquantitative RT-PCR ofhiwi in CD34+ subpopulations. Lane 1, 123-bp DNA ladder; lane 2, CD34+CD38neg sample; lane 3, CD34+CD38neg (−RT) sample; lane 4, CD34+CD38lo sample; lane 5, CD34+CD38lo (−RT) sample; lane 6, CD34+CD38hi sample; lane 7, CD34+CD38hi (−RT) sample; lane 8, negative control (water); lane 9, positive control (human testis, 269 bp).
Expression of hiwi diminishes as CD34+cells differentiate
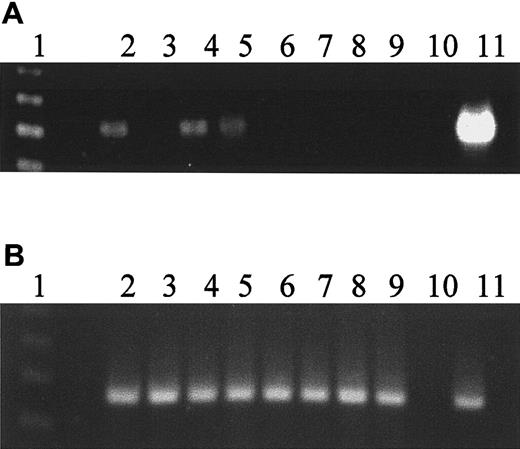
The CD34+ cell differentiation was promoted in a suspension culture system to which SCF, IL-3, and G-CSF were added each at 100 ng/mL every 3 to 4 days. Bazil and colleagues15have previously shown these conditions allow for rapid proliferation and differentiation causing the cells to leave the CD34+compartment. Aliquots of cells were harvested on days 0, 1, 3, 5, 7, 10, and 14 and analyzed by flow cytometry for CD34+expression and by semiquantitative RT-PCR for the hiwimessenger RNA (mRNA) (Figure 3A). On day 0, the starting cell population was composed of 99% CD34+ cells. Day 5 CD34+ content diminished to 20% of the expanded cell population; by day 7, fewer than 0.1% of the cells were CD34+, and by day 10 there were no detectable CD34+ cells present. By day 3, hiwi expression was markedly reduced and no longer detectable by semiquantitative RT-PCR by day 5. Concurrently β2-microglobulin gene expression was used as an internal control. The levels of β2-microglobulin remained constant throughout the 14 days of culture (Figure 3B).
Loss of
hiwi expression during differentiation of CD34+ marrow cells. CD34+ cells were placed in suspension culture with G-CSF, IL-3, and SCF at 100 ng/mL added every 3 to 4 days. (A) Expression of hiwi as detected by semiquantitative RT-PCR. Lane 1, 123-bp DNA ladder; lane 2, day 0 CD34+ cells; lane 3, day 0 CD34−cells; lane 4, day 1 culture sample; lane 5, day 3 culture sample; lane 6, day 5 culture sample; lane 7, day 7 culture sample; lane 8, day 10 culture sample; lane 9, day 14 culture sample; lane 10, negative control (water); lane 11, positive control (human testis, 269 bp). (B) Internal control of β2-microglobulin gene expression throughout 14 days of culture (330 bp). Lane numberings correspond to the same samples as in panel A.
Expressionof hiwi in leukemia cell lines
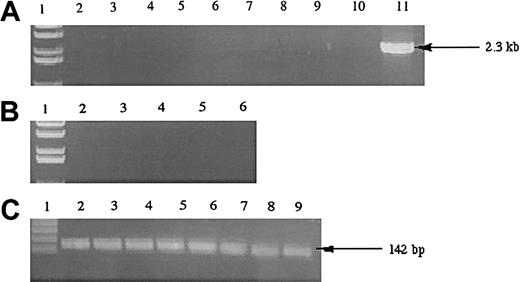
To examine whether the hiwi gene was expressed in leukemia cells, we analyzed a variety of immortalized human leukemia cell lines belonging to various lineages (Figure4). Analysis of 8 immortalized leukemia cell lines showed that the hiwi mRNA transcript was not detectable by RT-PCR.
Expression of
hiwi in human leukemia cell lines. (A) Lane 1, 1-kb ladder; lane 2, TF-1; lane 3, Jurkat; lane 4, KG1a; lane 5, KG1; lane 6, K562; lane 7, CEM; lane 8, BV173; lane 9,SUPB13; lane 10, negative control (water); lane 11, human testis positive control (2.3 kb). (B) Samples without reverse transcriptase; same setup as panel A, excluding lanes 7 through 11 (samples 7-9 were donated cDNAs and total RNA samples were not available to perform the −RT control). (C) GAPD internal control (142 bp); lane numberings correspond to the same samples as in panel A, excluding lanes 10 and 11.
Expression analysis of hiwi
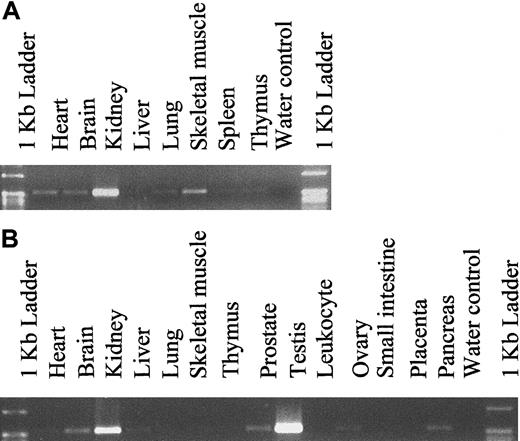
To determine the expression pattern of hiwi in various adult and fetal tissues other than CD34+ marrow cells, PCR amplification was performed using hiwi-specific primers on cDNA samples (Clontech Laboratories). Fetal cDNA samples ranged from 18 to 36 weeks of gestation. The expression level was determined through semiquantitative PCR amplification and revealed a wide distribution ofhiwi through most fetal and adult tissues (Figure5). The highest level of expression in fetal tissues was found in the kidney. Analysis of adult samples showed that hiwi was also expressed in a wide range of tissues such as the prostate, ovary, small intestine, heart, brain, liver, skeletal muscle, kidney, and pancreas. The highest level of expression was seen in the testis followed by the kidney. Expression of hiwi was not detected in mesenchymal stem cells or marrow stroma.
Tissue distribution of hiwi mRNA.
(A) Human fetal tissues. (B) Human adult tissues (557 bp for both panels).
Tissue distribution of hiwi mRNA.
(A) Human fetal tissues. (B) Human adult tissues (557 bp for both panels).
Cloning of hiwi from human marrow CD34+cells
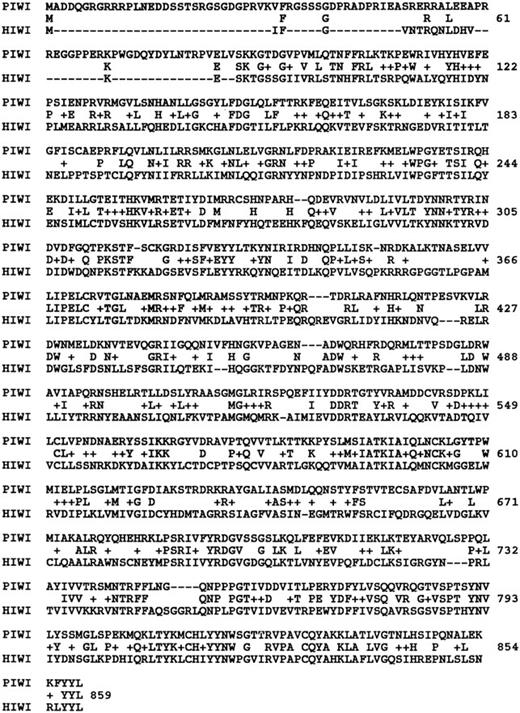
The presence of hiwi in CD34+ hematopoietic cells was determined through PCR amplification by designing a primer pair that spanned from amino acid 364 to 524 of the published partial coding sequence generating a 480-bp fragment that corresponds to the C-terminal end of the protein. After positively identifying the PCR product to be that of hiwi through dye terminator cycle sequencing, primers were then designed to amplify the potential full-length gene from human testis cDNA by using a 5′RACE cloning methodology that allows the PCR amplification of a given gene of interest by using a small region of a known sequence. AKSrev1 and AKSrev2 were also based on the published partial hiwi coding sequence and acted as a nested primer pair for primary and secondary PCR amplification reactions and correspond to base pairs 1391 to 1415 and 1330 to 1359, respectively. After using the 5′ RACE methodology on the human testis cDNA sequence and 2 rounds of PCR amplification (the second round consisting of a nested PCR amplification), a putative 2.3-kb full-length coding sequence was cloned. After several rounds of sequencing through primer walking, an open reading frame was determined. When compared to the Genbank database of nonredundant clones, the human HIWI protein showed a 52% homology to theDrosophila PIWI protein at the amino acid level (Figure6). Primer pairs were then designed to amplify the full-length coding sequence from CD34+hematopoietic cell cDNA through PCR amplification. A 2.3-kb band was detected in the CD34+ cDNA sample but not in the no-template control. No bands were detectable in the absence of reverse transcriptase (−RT) during the cDNA synthesis step. Control PCR amplification with primers to GAPD confirmed that the quantity and integrity of the RNA could be PCR amplified. The PCR product was sequenced and the identity was confirmed to be that of thehiwi gene by comparing it to the Genbank database.
HIWI protein alignment.
Amino acid alignment of the HIWI protein (Genbank accession numberAF264004) to the D. melanogaster PIWI protein (Genbank accession number AF104355). Amino acid identities are indicated by identical amino acid matches, whereas mismatches are indicated by a blank space. The + signs refer to positions in which the nature of the residue is conserved as reported by BLASTP homology alignment. Numbering begins at the initiation codon of the PIWI sequence.
Overexpression of hiwi leads to a diminished proliferative capacity of KG1 cells as measured by MTT
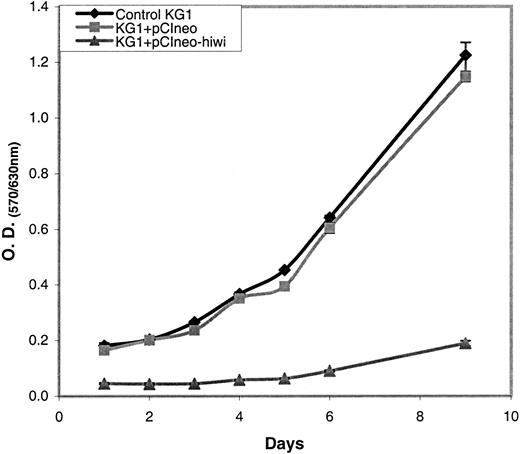
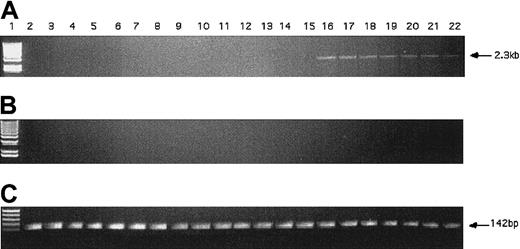
The KG1 cells were chosen for these studies due to their lack of expression of the hiwi mRNA as demonstrated by RT-PCR (Figure 4). Figure 7 shows that the proliferative capacity of the mock and pCIneo vector-treated cells was similar, whereas treatment with the pCIneo-hiwi construct led to a greatly diminished proliferation of KG1 cells. To determine whether or not the hiwi gene was actually expressed in the transfected cells, PCR was performed. Figure8 shows the presence of thehiwi transcript from day 1 (24 hours after transfection) until cultures were terminated (day 9). The declining levels of the expressed gene were likely due to the fact that the cells were not subjected to G418 antibiotic selection. To further assess the function and integrity of each construct, populations of cells that were simultaneously transfected were placed in the presence of 1 mg/mL active G418 for 3 weeks. After this period, the pCIneo-hiwiconstruct and the pCIneo empty vector contained similar numbers of viable cells. The pCIneo-hiwi construct further continued to express the hiwi gene (as determined by PCR, data not shown). The mock transfected cells were, however, characterized by a high degree of cell death at day 6 (> 96%, data not shown). These studies demonstrate that both the cytomegalovirus (CMV) promoter and the SV40 promoter (which was driving neomycin phosphotransferase gene) were actively driving transcription of their respective genes and thathiwi gene expression was present, but to an unknown level. This study indicates that hiwi inhibits KG1 cell proliferation and therefore suggests that this gene may play a role in the negative regulation of hematopoietic cells.
MTT assay of KG1 cells with or without hiwi.
KG1 cells were subjected to transfection under 3 different conditions (control KG1, KG1+pCIneo, KG1+pCIneo-hiwi) and were cultured for a 9-day period. An MTT assay was performed on each day to assess cell proliferation from days 1 through 6 and then on day 9.
PCR detection of hiwi DNA in transfected KG1 cells.
(A) PCR amplification of hiwi on mock transfected KG1 cells (d1-6, d9; lanes 2-8), empty vector transfected KG1 cells(d1-6, d9; lanes 9-15), and hiwi-containing vector-transfected KG1 cells (d1-6, d9; lanes 16-22). Lane 1 is a 1-kb DNA ladder. (B) Samples without reverse transcriptase; same setup as panel A. (C) GAPD internal control (142 bp), same setup as panel A.
Apoptosis of KG1 cells induced by hiwi
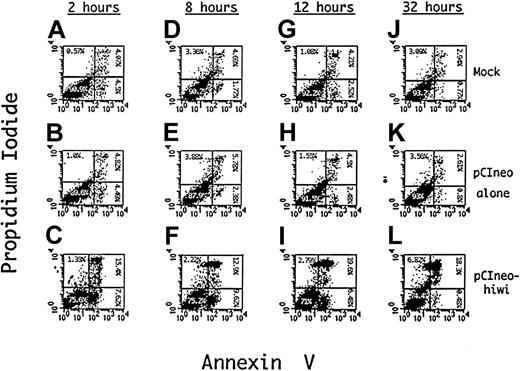
To determine a potential mechanism for the reduced proliferative capacity of KG1 cells that overexpress the hiwi gene product, apoptosis of these cells was evaluated using Annexin V as an indicator of programmed cell death and PI as a measure of cell viability. Figure 9D-F shows such an analysis after an 8 hours of incubation demonstrating an approximate 4.4-fold increase (9.6%) in the percentage of cells undergoing apoptosis, (positive for Annexin V but negative for PI) when compared to the mock (1.8%) and the empty vector control (2.4%). The degree of apoptosis after 12 hours of incubation is also greater in thehiwi overexpressing cells as compared to the control cells. Flow cytometric analysis at 32 hours of culture (Figure 9J-L) exhibited an increase in the number of cells that were PI and annnexin positive, suggesting that the cells had proceeded to a necrotic state. These data indicate that most of the cell population containing thehiwi gene underwent apoptosis and eventually entered a terminal state of cell death.
Induction of apoptosis in KG1 cells overexpressing thehiwi gene.
KG1 cells were transfected under mock, pCIneo empty vector, or pCIneo-hiwi conditions. Cells were harvested at 2, 8, 12, and 32 hours, washed with PBS, and resuspended in binding buffer containing Annexin V–FITC and PI. The X-axis represents log fluorescence intensity for Annexin V staining; the Y-axis represents log fluorescence intensity for PI staining. Panels A-C show flow cytometric analysis at a 2-hour time point that consists of a mock, a pCIneo empty vector, and the pCIneo-hiwi transfected KG1 cell populations. Panels D-F, G-I, and J-L show the same analysis but at 8,12, and 32 hours (respectively) after transfection.
Chromosomal localization of hiwi
The chromosomal location of hiwi was determined by STS computer-based mapping.20 21 Four different STS clones (Genbank accession numbers AA639672, AA904973, AA969660, and AI25224) were found to have significant homology to the hiwi gene. These 4 clones along with the partial published hiwisequence were then mapped to the reference interval of D12S340-D12S97 (147.5-160.9 cM) by radiation hybridization (Unigene cross-reference Hs. 128673). The physical position of hiwi was located at 489.71 cR3000 (P1.43, stSG53541) on the q arm of chromosome 12, specifically between 12q24.2 through 12q24.32 as represented by the cytogenetic ideogram. The physical locale of hiwi does not currently show an association with any hematologic disorders (as demonstrated by STS/EST homology comparisons).
Chromosomal localization of the human hiwigene by FISH analysis
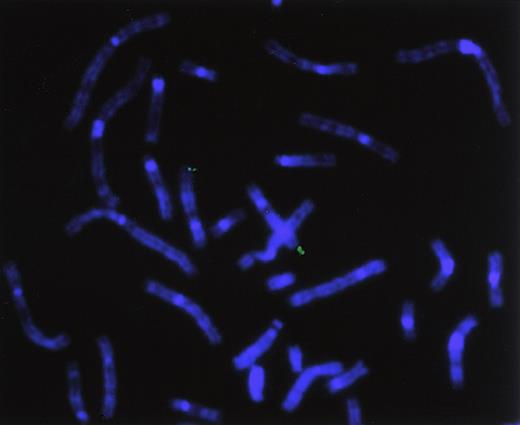
To directly determine the chromosomal location of hiwi, a hiwi genomic clone was hybridized on metaphase chromosomes derived from a human peripheral blood cell culture. Identification of the human chromosomes was based on their DAPI-banding pattern that resembles G-bands achieved by conventional trypsin-Giemsa treatment. Thirty-two metaphase spreads were analyzed showing specific localization to chromosome 12 as follows: specific hybridization signals were seen 9 times (28.1%) in 2 chromatids, 10 times (31.3%) in 3 chromatids, and 11 times (34.4%) in 4 chromatids; no hybridization signals were seen in 2 metaphases (6.2%). A very small number of nonspecific hybridization sites were seen (Figure10). Traditional FISH analysis confirmed the computer-based chromosomal localization ofhiwi.
Chromosomal localization by FISH analysis.
Chromosomal localization of hiwi using a hiwigenomic clone shows hybridization of the genomic probe to the q arm of chromosome 12, specifically between 12q24.2 through 12q24.32.
Chromosomal localization by FISH analysis.
Chromosomal localization of hiwi using a hiwigenomic clone shows hybridization of the genomic probe to the q arm of chromosome 12, specifically between 12q24.2 through 12q24.32.
Discussion
A stem cell can undergo self-renewal as well as generate differentiated progeny. The capacity of an HSC to remain undifferentiated and be capable of reconstituting a myeloablated host as well as its ability to generate multiple differentiated cell types is central to its pivotal role in normal hematopoiesis. Despite the improved ability of various laboratories to isolate and manipulate pure populations of murine and human HSCs,26,27 our understanding of mechanisms by which a stem cell divides and retains its unique biologic properties has eluded the efforts of a large number of investigators.28-33 Understanding the basis of these properties is required if progress in stem cell transplantation and gene therapy are to occur. Stem cell division is likely controlled by both intracellular mechanisms as well as cell to cell interactions. The intracellular mechanisms of a stem cell would include basic cell cycle machinery as well as machinery responsible for cell division.
Elucidation of the genetic program that underlies the unique biologic properties of HSCs has been the focus of a growing number of laboratory groups.33,34 These laboratories have attempted to approach this daunting objective by using a variety of approaches. Array technology, for instance, now permits one to monitor simultaneously the expression patterns of thousands of genes during cellular differentiation and response.35 36 The key to the successful implementation of such technology to the study of stem cell biology is the development of the means to assign priority to such genes and to determine their function.
Recently our laboratory and several others have taken a different approach to analyze the genetic organization of human HSCs.37-39 Genes that were originally shown to affect stem cell development in lower species have been shown subsequently to be expressed by human hematopoietic cells and to have profound regulatory effect on human hematopoieis. Lower organisms such as Drosophila, C. elegans and Danio rerio (zebra fish) have been used as effective models for studying mechanisms that are conserved among diverse developmental systems.5,39,40Studies from Xenopus, for instance, have revealed a multitude of genes involved in mesoderm induction including members of the transforming growth factor β superfamily, fibroblast growth factor, and at least 19 members of the Wnt gene family in diverse species ranging from roundworm and insects to humans.41 42 The Wnt gene family members have subsequently been shown to have profound effects on murine and human hematopoiesis. With this experience in mind, we attempted to extend this approach to identify genes of interest that might serve as candidate regulators of HSC self-renewal and development.
In Drosophila, stem cells exist in the germline at the apical tip of each ovariole, the germarium, which is the functional portion of the ovary.12,43 Each ovary consists of 10 to 17 ovarioles. Each germarium contains 2 to 3 GSCs that are in direct contact with specialized somatic cells, the basal terminal filament cells.8,11,43 GSCs undergo asymmetric divisions to produce daughter stem cells and a differentiated daughter cell, a cystoblast. Recently a number of genes including dpp, piwi, pumilio, andfs1Yb have been identified and shown to be essential for GSC maintenance.7,10,44 Among these genes,piwi has been of special interest. It has recently has been demonstrated to be an essential stem cell gene in Drosophilaand C. elegans and to be expressed in tissues belonging to many species including human. The Drosophila piwi gene is required for asymmetric division of GSCs but is not required for differentiation of committed daughter cells. Expression ofpiwi in adjacent somatic cells, terminal filament cells, regulates GSC division.7 We have therefore, embarked on studies of piwi homologue gene expression during human hematopoiesis with the hope of determining if this gene might regulate human HSC function.
Our laboratory has demonstrated that the human equivalent ofpiwi, termed hiwi, is expressed in a variety of human tissues including primitive hematopoietic cells. The gene was cloned from human marrow CD34+ cells and the HIWI protein was shown to have 52% homology with the Drosophila PIWI protein at the amino acid level. In addition, the gene was localized to the q arm of chromosome 12 between 12q24.2 through 12q24.32.
By using 2 different approaches, we have shown that hiwiexpression within the hematopoietic compartment is unique to the most primitive hematopoietic progenitors and is diminished or absent in more differentiated cells. CD34+ marrow cells contain hematopoietic stem and early progenitor cells, which expresshiwi, in contrast to CD34− cells, which are predominantly composed of more differentiated precursor cells. Although studies in the mouse have recently demonstrated the presence of quiescent stem cells within the CD34− subpopulation, the presence of such a CD34− stem cell in humans remains uncertain.27 45 Nevertheless, this CD34−stem cell population would potentially represent an extremely small fraction of the total HSC population. Furthermore, when CD34+ cells were placed in conditions that favored differentiation in vitro, hiwi gene expression declined synchronously with cellular differentiation. Both groups of studies indicate that hiwi expression is unique to the more primitive cellular compartment and that its expression might serve as a genetic marker of progenitor and stem cells.
Because leukemia is frequently accompanied by expansion of the hematopoietic compartment, we anticipated that leukemia cells would express hiwi, a gene that is associated with self-replication. To our surprise, when 8 immortalized leukemia cell lines were analyzed, hiwi mRNA transcripts were undetectable. These studies suggest that hiwi expression may not be a component of the genetic program that accompanies leukemogenesis. By contrast, hiwi expression appears to be limited within the hematopoietic compartment to normal CD34+ cells. These data indicate that the lack ofhiwi expression may be a consequence of the leukemic transformation event. Further testing of this potentially important finding will be pursued with primary leukemia cells.
To determine if hiwi plays a regulatory role in human hematopoiesis, we attempted to overexpress the hiwi gene in an immortalized acute myeloid leukemia cell line, KG1. The biologic activity of hiwi was assessed using a standard cell proliferation assay (MTT), which demonstrated that overexpression of the hiwi gene product actually caused a decrease in cell proliferation when compared with 2 separate controls. The magnitude ofhiwi activity was evaluated by direct comparison of cells exposed to the empty vector control and the mock transfection control. Under both of these conditions, KG1 cells were capable of proliferating normally without the presence of the hiwi gene or interference from the empty vector control. Comparing the optical density of both controls with the hiwi-expressing culture shows a dramatic functional decline in the metabolic machinery of the cells in this culture condition. The overexpression of thehiwi gene product promoted apoptosis in KG1 cells. The rapid progression of apoptosis can be seen at the 8-hour time point where a majority of the cells in the hiwi-containing population have undergone apoptosis and have started to proceed into the necrotic state. These studies suggest that hiwi overexpression causes programmed cell death. Lack of apoptosis in the cells transfected with the hiwi gene, which were maintained in selective media, may be due to the SV40 promoter (which drives the transcription of the neomycin phosphotransferase gene), outcompeting the CMV promoter (which directs the transcription of the hiwi gene) because of the selective pressure placed on the SV40 promoter by the G418 selection. This may account for diminished expression of the hiwi gene product while the transcription of the neomycin phosphotransferase gene continues. Emerman and coworkers have reported a state of gene suppression in cells genetically modified with a retrovirus in which one gene is shutdown while the second gene undergoes normal transcription due to promoter competition.46 Because the KG1 cells were electroporated and put into media that was lacking G418 for the apoptosis experiments, there would be no need for the activation of the SV40 promoter allowing the CMV to transcribe thehiwi gene unperturbed, thus allowing for the rapid induction of apoptosis resulting in eventual cell death.
During steady-state hematopoiesis, most stem cells are quiescent or cycling extremely slowly.47-52 Stem cell quiescence may be a passive process involving the absence of proliferation or an active process that occurs as a consequence of a variety of negative inhibitors of hematopoiesis.53-55 The observation thathiwi expression is associated with diminished proliferation of an immortalized leukemia cell line suggests that the expression of this gene might play a role in maintenance of stem cell quiescence or down-regulation of stem cell or progenitor cell cycling. This is somewhat surprising because it has been reported that piwicauses cellular division within a Drosphila-based model.56 Further studies to address the issue ofhiwi function will be conducted in primitive primary HSCs.
In Drosophila, piwi is expressed both in the terminal filament cells and the germline. The piwi gene in the terminal filament functions to affect stem cell self-replication, whereas piwi expression in the germline does not appear to be required for GSC self-replication.7 We attempted to determine if a similar relationship existed between marrow stroma cells and HSCs. Many of the regulatory signals that control stem cell development are dependent on cellular interactions between marrow stroma and HSCs.17,18 Although hiwi was expressed in marrow CD34+ cells, it was not expressed by marrow stroma or marrow mesenchymal stem cells, which are capable of differentiating into not only marrow stroma but also other components of the hematopoietic niche such as adipocytes, osteoblasts, tenoblasts and cartilage forming cells.16 These data indicate that the potential role of hiwi in human stem cell development is quite different from that which occurs in the Drosophilamodel. It remains possible that the hiwi present in CD34+ cells may play a role as an intrinsic regulator of stem cell self-replication. Testing of this hypothesis remains an objective of our ongoing investigations.
Acknowledgments
We would like to thank Dr W. Stock, Dorie Sher, and Scott Weissman for the generous donation of leukemic cell line cDNAs, Sonia Lottinville and Alvin Ayala for DNA sequencing, and Elen Rosler for donating cadaveric marrow, thoughtful discussion, and assistance with formatting figures.
Supported by grants from the Leukemia Society of America and the National Institutes of Health.
The publication costs of this article were defrayed in part by page charge payment. Therefore, and solely to indicate this fact, this article is hereby marked “advertisement” in accordance with 18 U.S.C. section 1734.
References
Author notes
Ronald Hoffman, University of Illinois at Chicago, College of Medicine, Hematology/Oncology Section, MBRB Room 3150, M/C 734, 900 South Ashland Avenue, Chicago, IL 60607; e-mail: ronhoff@uic.edu.


This feature is available to Subscribers Only
Sign In or Create an Account Close Modal