Abstract
All-trans retinoic acid (ATRA) is a potent inducer of terminal differentiation of immature leukemic cell lines in vitro and of acute promyelocytic leukemia (APL) cells in vivo. Recent reports have shown that ATRA induces the expression of several interferon-regulated genes, including signal transducer and activator of transcription (Stat)1. To investigate the role of Stat1 activation in ATRA signaling, sublines were established for the human monoblastic cell line U-937 constitutively expressing wild-type or phosphorylation-defective Stat1, mutated in the conserved tyrosine 701 required for dimerization and nuclear translocation. Results showed that ATRA induction leads to activation of Stat1 by the phosphorylation of tyrosine 701 and subsequent nuclear translocation. Consistent with a functional importance of this activation, ectopic expression of Stat1Y701F suppressed ATRA-induced morphologic differentiation and expression of the monocytic surface markers CD11c and the granulocyte colony-stimulating factor receptor. Moreover, ATRA-induced growth arrest in the G0/G1phase of the cell cycle was inhibited by phosphorylation-deficient Stat1. Taken together, these results indicate that Stat1 is a key mediator of ATRA-induced cell cycle arrest and differentiation of U-937 cells.
Introduction
All-trans retinoic acid (ATRA), a biologically active metabolite of vitamin A, is a strong cytodifferentiating agent that can induce terminal differentiation and cell cycle arrest of several hematopoietic cell lines in vitro. Clinically, ATRA has proven to be an effective agent in the treatment of acute promyelocytic leukemia (APL) by inducing differentiation of the leukemic blasts.1 ATRA acts through a subfamily of nuclear receptors, RARs and RXRs, which are ligand-induced transcription factors that bind to specific DNA binding sites, RAREs (retinoic acid response elements), and promote transcription of target genes when activated.2 The subsequent molecular mechanisms of ATRA-induced cell differentiation are, however, still not fully understood.
ATRA has shown synergistic antiproliferative and differentiation-inducing activity in combination with interferons (IFNs) in many studies.3,4 A possible mechanism for this synergy was recently suggested by the observation that ATRA up-regulates the levels of signal transducer and activator of transcription (STAT), that is, Stat1 and Stat2, and other IFN-responsive genes, for example, IRF-1, ISGF3γ/p48, PKR, and 2′-5′ OAS.5-8 Thus, by increasing the levels of components in the IFN-signaling network, ATRA may sensitize the cells to IFNs. However, it is also conceivable that up-regulation and/or activation of Stat and interferon regulatory transcription factors (IRFs) are essential and integral parts of ATRA signaling in mediating the process of differentiation. Notably, activation of Stat1 by ATRA stimulation has recently been demonstrated in APL cells, lending support to this hypothesis.8
Stat1 is important for transducing signals from IFNs and many interleukins (IL).9,10 When activated by IFN-γ, Stat1 is phosphorylated on both a conserved tyrosine residue (Y701) by janus kinases (JAKs) associated with the receptor, and on a serine residue (S727) by unknown kinases.9 The tyrosine phosphorylation is important for dimerization, translocation to the nucleus,11 DNA binding, and activation of transcription, whereas serine phosphorylation is required for full transcriptional activation.12 Tyrosine (Y701)-dependent Stat1 dimerization has been demonstrated for Stat1-Stat1 homodimers and Stat1-Stat3 heterodimers, induced by IFN-γ and IL-6, respectively.9Stat1 may also form higher order complexes by interacting with ISGF3γ/p48, a member of the IRF family, and Stat2 on IFN-α stimulation.13 Previous studies have shown that Stat1 mutants lacking the tyrosine 701 residue fail to activate transcription after IFN induction11 and that tyrosine-mutated Stat1 will act in a dominant negative manner in IFN-γ and epidermal growth factor (EGF) signaling.14-16
The U-937 cell line is an established model for monocytic differentiation and can be induced to differentiate along the monocytic pathway by several inducers, for example, ATRA, vitamin D3 (VitD3) and 12-O-tetradecanoylphorbol-13-acetate (TPA).17-19 To investigate the role of Stat1 activation in ATRA-induced differentiation we stably overexpressed wild-type Stat1 and dominant negative, Stat1 (Stat1Y701F) in U-937 cells and studied the effects on ATRA-induced differentiation and growth arrest.
Materials and methods
Cell culture and induction of differentiation
The human monoblast cell line U-937 cells and transfected clones were grown at 37°C in a humidified atmosphere with 5% CO2 in RPMI 1640 medium supplemented with 10% fetal bovine serum (Gibco, Paisley, England), glutamine, and antibiotics. Differentiation was induced by exposing 2 to 5 × 10⁵cells/mL to 1 μmol/L of ATRA (Sigma, St Louis, MO), 0.1 μmol/L 1α,25(OH)2-vitaminD3 (Hoffman-La Roche, Basel, Switzerland), 0.16 μmol/L TPA (Sigma), and 100 U/mL of IFN-γ (a kind gift from Dr G. R. Adolf, Bender & Co, Vienna, Austria) for the indicated time periods.
Transient transfection and luciferase reporter assay
Transient transfection of U-937 cells was performed by Effectene (Qiagen, Valencia, CA) according to the manufacturer's recommendations, using a luciferase reporter gene driven by a 238-bpHindIII-HgiAI fragment of the human guanylate binding protein promoter20 (a kind gift of Dr B. Lüscher, Hannover). In each transfection 0.2 μg of GBP-Luc and 0.75 μg of endotoxin-free pCI-Stat1, pCI-Stat1Y701F or empty pCIneo expression vectors were used. Cotransfection by 0.05 μg of a β-actin–LacZ reporter was used to correct luciferase values for differences in transfection efficiency. For kinetic studies a stably transfected U-937 subline with an integrated GBP-Luc reporter gene was induced by ATRA (1 μmol/L) or VitD3 (0.1 μmol/L) or left untreated for the indicated time periods, harvested, and washed once in phosphate-buffered saline (PBS). In assays with stable transfectants, luciferase activity was normalized to protein concentration for each sample. Extracts were prepared by lysing the cells in extraction buffer (25 mmol/L Tris, 2 mmol/L EDTA, 10% glycerol, 5% Triton X-100, 2 mmol/L DTT) for 10 minutes on ice. Luciferase activity was measured in a luminometer (Lumat LB9501, EG & G, Berthold, Bad Wildbad, Germany), using Luciferase Assay Reagent (Promega, Madison, WI) according to the manufacturer's specifications.
Mutagenesis and construction of expression vectors
Human Stat1 full-length complementary DNA (cDNA) (a kind gift from James E. Darnell Jr, Rockefeller University, New York) was subcloned into pBluescript II SK (Stratagene, La Jolla, CA). An oligonucleotide encoding the influenza virus hemagglutinin (HA) epitope-tag21 was inserted into Stat1 at the unique N-terminal NcoI site. Stat1HAY701F mutants were generated by the Stratagene Exsite polymerase chain reaction (PCR)-based site directed mutagenesis kit with Expand High Fidelity enzyme (Boehringer Mannheim, Mannheim, Germany). Point mutations converting tyrosine 701 to phenylalanine were introduced using phosphorylated mutagenesis primers (SGS, Sweden). Primers used for Stat1HAY701F were P1: 3′-TTC CTT GAC CTA AAT AGT TCT GA-5′ and P2: 5′-GAG TTG ATA TCT GTG TCT GAA GTT C-3′. Additionally, a diagnostic restriction site for EcoRV cleavage was introduced in Stat1HAY701F. The mutated Stat1 cDNA was subcloned into the expression vector pCIneo (Promega). The constructs were checked by restriction mapping and sequenced using the ABI PRISM 377 Automated Sequencer (Perkin Elmer Cetus, Foster City, CA).
PCR
Total RNA was isolated as described by Chomczynski and Sacchi (GITC).22 cDNA was synthesized using 1 μg of total RNA primed with oligo d(T) in 50-μL reactions. To test for contamination by genomic DNA, additional reactions were done without adding reverse transcriptase. PCR was performed using 4 μL cDNA and 30 cycles of amplification. Primers specific for human IFN-α1 and β-actin cDNA were purchased from Clontech (CA). Stat1 primers were ordered from Interactiva (Ulm, Germany) with the following sequences: 5′-GTG GAC GAG GTT TTG TAA GGA-3′ (upstream) and 5′-CAG ACA CAG AAA TCA ACT C-3′ (downstream). As negative controls, tubes without cDNA were included. The PCR products were checked on a 1.5% agarose gel with DNA molecular weight marker XIV (Boehringer Mannheim).
Establishment of stable sublines
Stable transfectants constitutively expressing Stat1HAY701F or Stat1HA were made by electroporation of U-937 cells (250V/960 μF). Selection with 1000 μg/mL of G418 (Life Technologies, Paisley, United Kingdom) started 48 hours after electroporation, and clones were collected about 3 weeks later. The protein levels of Stat1 were analyzed by Western blot with an α-Stat1 monoclonal antibody (Santa Cruz Biotechnology, Santa Cruz, CA). Two clones of each kind, U-937-Stat1(HA)Y701F.8, U-937-Stat1(HA)Y701F.11, U-937-Stat1(HA).3, and U-937-Stat1(HA).7 (for simplicity referred to as Y701F.8, Y701F.11, Stat1(HA).3, and Stat1(HA).7, respectively) were chosen and used throughout this work. Also, a clone overexpressing Stat1 without the HA-epitope (U-937-Stat1.2 referred to as Stat1.2) and a vector-transfected clone (U-937-pCIneo referred to as pCIneo) were produced and used as controls.
Immunoprecipitation and Western blot analysis
For whole cell protein extracts, cells were washed once with PBS and lysed in 1% NP-40, 0.1 mol/L Tris-HCl, pH 8.0, 0.15 mol/L NaCl, and 5 mmol/L EDTA with protease inhibitors at 4°C for 15 to 20 minutes followed by centrifugation for 10 minutes at 4°C, 14 000 rpm. The supernatant was collected and the protein concentration was measured using the Bio-Rad protein assay (Bio-Rad Laboratories, Hercules, CA) and a Titertek Multiscan. Nuclear and cytoplasmic extracts were prepared as described by Dignam.23 Extracts were fractionated on Novex NuPAGE 10% precast gels using the Novex electrophoresis and blotting system (Novex, San Diego, CA). Filters were blocked with 5% dry milk in 1 × TTBS for 1 hour at room temperature, incubated with primary antibody in blocking buffer for 2 hours at room temperature, washed 3 times with 1 × TTBS, and finally incubated with secondary horseradish peroxidase (HRP)-linked antibody (Amersham, UK) for 1 hour at room temperature. After washing with TTBS, protein detection with ECL-plus (Amersham Pharmacia Biotech, Uppsala, Sweden) was performed. Primary antibodies used were: α-Stat1 (C-111) mouse monoclonal (Santa Cruz Biotechnology) and α-pStat1 rabbit polyclonal (New England Biolabs, Beverly, MA).
For immunoprecipitation, equal aliquots of whole cell lysates were incubated for 4 hours at 4°C with α-HA antibodies (12CA5 Berkeley Antibody Co, Berkeley, CA); thereafter protein-A sepharose beads (Pharmacia Biotechnology, Sweden) were added, followed by 2 hours of incubation at 4°C. Precipitates were collected by centrifugation, washed 3 times in extraction buffer, and subjected to Western blot as described above.
Northern blot analysis
Total cellular RNA was isolated by the method of Chomczynski and Sacchi (GITC)22 and 10 μg/well was fractionated in an agarose gel containing 1% formaldehyde, and subsequently transferred onto a nitrocellulose filter (Hybond-C extra, Amersham).32P-labeled probes were prepared (Megaprime DNA labeling systems, Amersham) using a BamHI-EcoRV fragment of Stat1 cDNA, KpnI-PstI fragment of IRF-1 cDNA (a kind gift by Dr T. Taniguchi, Osaka, Japan), aHindIII-XbaI fragment of GAPDH and p21WAF1/CIP1 cDNA.24 Hybridization was performed at 42°C in a solution containing 50% formamide. The filter was finally washed in 15 mmol/L NaCl/15 mmol/L sodium citrate/0.1% sodium dodecyl sulfate at 53°C for 3 × 30 minutes before autoradiography.
Morphology
The U-937 sublines were cultured in the presence or absence of 1 μmol/L of ATRA for 5 days. Cells were harvested, washed once in PBS, spun down on glass slides by a cytospin, and subjected to May-Grünwald-Giemsa staining.
Immunofluorescence and cell cycle analysis
The surface antigen expression was analyzed by immunofluorescence using flow cytometry (FACScan; Becton and Dickinson, Mountain View, CA). Briefly, the cells were washed twice with PBS, incubated with phycoerythrin (PE)-conjugated antibodies on ice for 30 minutes and finally washed twice with PBS plus 0.5% fetal calf serum (FCS). The PE-conjugated antibodies used were Leu M5 (CD11c) and Leu M3 (CD14) (Becton and Dickinson) and granulocyte colony-stimulating factor receptor (G-CSFR) (CD114) (Pharmingen, San Diego). All values were correlated to the autofluorescence values of unlabeled cells.
Analysis of the cell cycle phase distribution of the cells was performed according to Vindelov.25 Briefly, cells were induced as indicated and washed once in cold PBS; then nuclei were prepared by treating the cells with 0.03 mg/mL of trypsin (Sigma) for 10 minutes at room temperature, thereafter RNase A (Sigma, 0.08 mg/mL) for 10 minutes at room temperature, and finally staining by propidium iodide (PI, Sigma, 0.2 mg/mL). The stained nuclei were subsequently analyzed by the CellQuest program using a FACScan (Becton Dickinson) and MacCycle software (Phoenix Flow Systems, San Diego, CA).
[3H-]thymidine incorporation assays
For analysis of DNA synthesis, triplicate cultures were induced as indicated. Aliquots of cells were labeled for 6 hours with 0.2 μCi [3H-]thymidine and harvested using a Titertek cell harvester (Skatron, Lier, Norway). Incorporated [3H-]thymidine was measured by liquid scintillation counting using a 1214 Rackbeta Liquid Scintillation Counter (LKB/Wallac, Turku, Finland).
Statistical analysis
Statistical analysis was done by analysis of variance (ANOVA) followed by multiple comparison by the Fisher method using the StatView computer program.
Results
ATRA up-regulates Stat1 and induces transcription of a GAS-regulated reporter gene
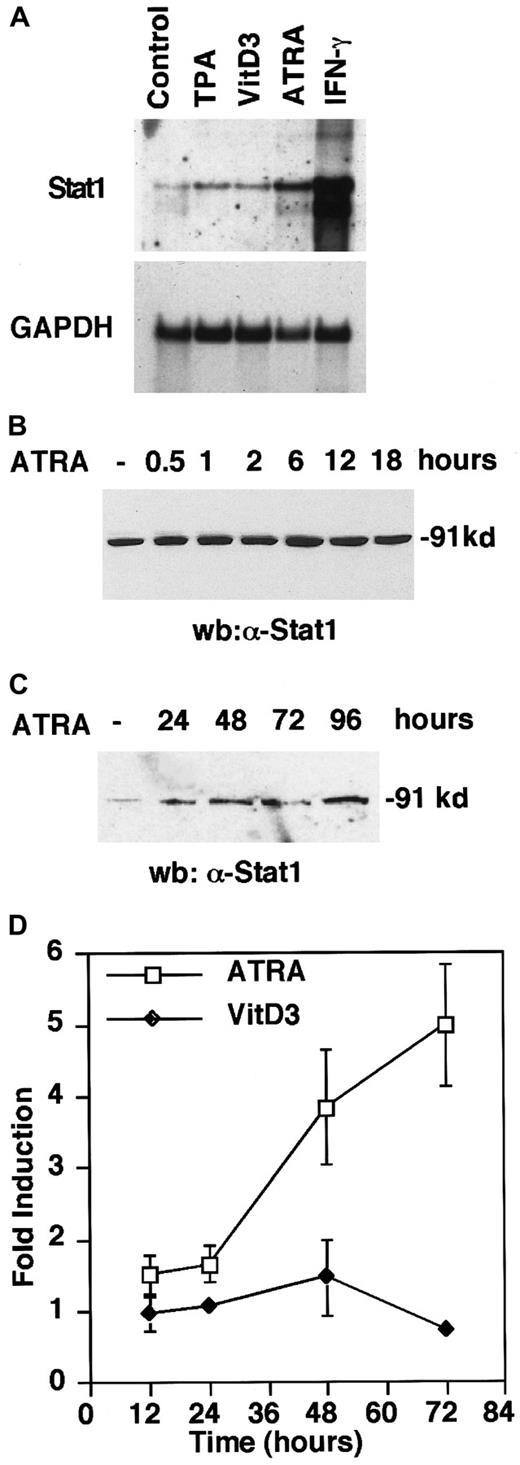
Previous work has shown that Stat1 messenger RNA (mRNA) and protein levels are elevated in response to treatment by ATRA6,8 and TPA26 in U-937 cells. To determine if this up-regulation is a general consequence of U-937 differentiation, cells were treated with inducers of U-937 differentiation, that is, ATRA, VitD3, and TPA17-19 and, as a positive control IFN-γ, which is known to strongly induce Stat1.27 Interestingly, Northern blot analysis showed that Stat1 was preferentially up-regulated during ATRA-induced differentiation and, in comparison, only marginally by VitD3 and TPA (Figure 1A), suggesting a specific role for Stat1 in ATRA-induced signaling. We also confirmed that Stat1 protein levels were induced within 6 hours by ATRA treatment, and that the high Stat1 levels were sustained for at least 96 hours after stimulation (Figure 1B,C).
ATRA induces Stat1 mRNA and protein expression and transcriptional activation of an interferon-responsive promoter in U-937 cells.
(A) Cells were induced for 72 hours by TPA (0.16 μmol/L), VitD3 (0.1 μmol/L), ATRA (1 μmol/L), or IFN-γ (100 U/mL). Stat1 and GAPDH mRNA levels were determined by Northern blot. (B, C) Cells were induced by ATRA and collected at the indicated times, and protein extracts were prepared and analyzed by Western blot using α-Stat1 antibodies. (D) U-937 cells stably transfected with a GBP promoter-driven luciferase reporter plasmid were stimulated with ATRA or VitD3. Cells were collected at the indicated times, and extracts were prepared, and luciferase activity was measured. The graph shows fold induction over untreated cells for RLU values correlated to protein concentration. Data are presented as mean ± SD (n = 3).
To investigate the effect of Stat1 up-regulation during differentiation, we tested if ATRA treatment was sufficient to induce transcription from an IFN-responsive promoter. We used a sequence from the guanylate-binding protein (GBP) promoter containing an IFN-γ activation site (GAS), which is predominantly activated by Stat1-Stat1 homodimers, overlapping with an IFN-stimulated response element (ISRE).20 U-937 cells with an integrated GBP-luciferase reporter plasmid were treated with ATRA or VitD3, and cells were collected at the indicated time points and assayed for luciferase activity (Figure 1D). An increased transcription from the GBP promoter was apparent between 24 and 48 hours of ATRA stimulation, and continued to increase during the time period studied. In contrast, VitD3-induced differentiation had no effect on luciferase activity. The transcriptional activation of the GBP-luc reporter gene suggests that Stat1 is activated in response to ATRA treatment.
ATRA induces Stat1 tyrosine phosphorylation and nuclear translocation
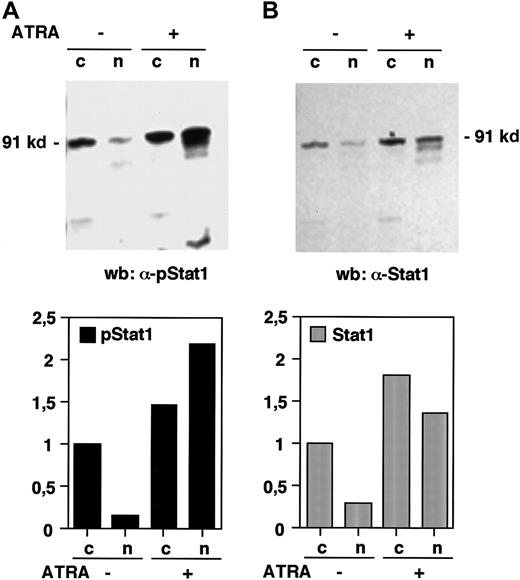
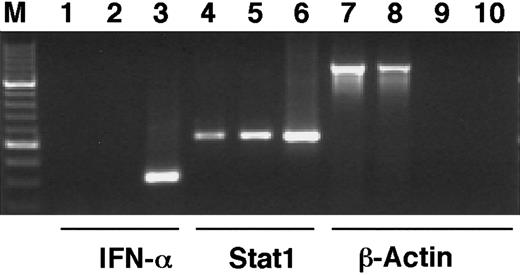
The phosphorylation of Stat1 on tyrosine 701 and the subsequent dimerization and translocation to the nucleus are known to be important events in the signal transduction by the IFN-γ receptor, leading to the transcriptional activation of IFN-induced target genes.11 To investigate if Stat1 is activated by ATRA in the same manner, the levels of tyrosine phosphorylated Stat1 in nuclear and cytoplasmic extracts of U-937 cells, before and after 36 hours of ATRA induction, were determined by Western blot. Immunoblotting with an antibody that specifically recognizes tyrosine 701 phosphorylated Stat1 showed that the nuclear levels of phosphorylated Stat1 were elevated more than 10-fold in response to ATRA (as determined by quantification of the bands), and that phosphorylated Stat1 was induced to translocate to the nucleus (Figure 2A). A low level of nuclear tyrosine phosphorylated Stat1 was present in untreated cells and remained detectable after serum starvation (data not shown). Translocation of Stat1 was confirmed by reblotting the membrane with α-Stat1 antibodies (Figure 2B). Stat1 is thus activated by ATRA by phosphorylation on tyrosine 701, leading to transcriptionally active Stat1 proteins in the nucleus. These results raised the question of the mechanism by which ATRA induces activation of Stat1. It has recently been reported that ATRA induces IFN-α production in NB4 and HL-60 cells. We therefore performed a reverse transcriptase-PCR (RT-PCR) on RNA prepared from U-937 cells treated with ATRA for 48 hours. As shown in Figure 3 we could not detect IFN-α mRNA in these cells, whereas an increase in Stat1 mRNA was clearly detected in the same preparation.
Stat1 is phosphorylated and translocated to the nucleus in response to ATRA treatment.
U-937 cells (pCIneo control cells) were stimulated with ATRA for 36 hours and nuclear (n) and cytoplasmic (c) extracts were prepared. (A) The level of tyrosine phosphorylated Stat1 was determined by Western blot using antibodies specific for tyrosine 701 phosphorylated Stat1 (α-pStat1). (B) To confirm the nuclear translocation of Stat1, the membrane was stripped and immunoblotted with α-Stat1 antibodies. Quantitation of the bands, normalized to the uninduced cytoplasmic level, is shown in the lower panels.
IFN-α1 mRNA cannot be detected after ATRA stimulation of U-937 cells.
U-937 cells were stimulated by ATRA for 48 hours, total RNA was prepared, and cDNA was synthesized by RT-PCR. PCR was run with cDNA preparations from untreated (lanes 1, 4, 7) or ATRA-stimulated cells (lanes 2, 5, 8) with primers specific for IFN-α1 (lanes 1-3), Stat1 (lanes 4-6), or β-actin (lanes 7, 8). To test for genomic contamination, PCR was also run with preparations of mRNA without reverse transcriptase, from untreated (lane 9) or ATRA-stimulated (lane 10) U-937 cells, using β-actin primers. Positive controls were lanes 3 and 6.
Establishment of U-937 sublines constitutively expressing phosphorylation-deficient Stat1
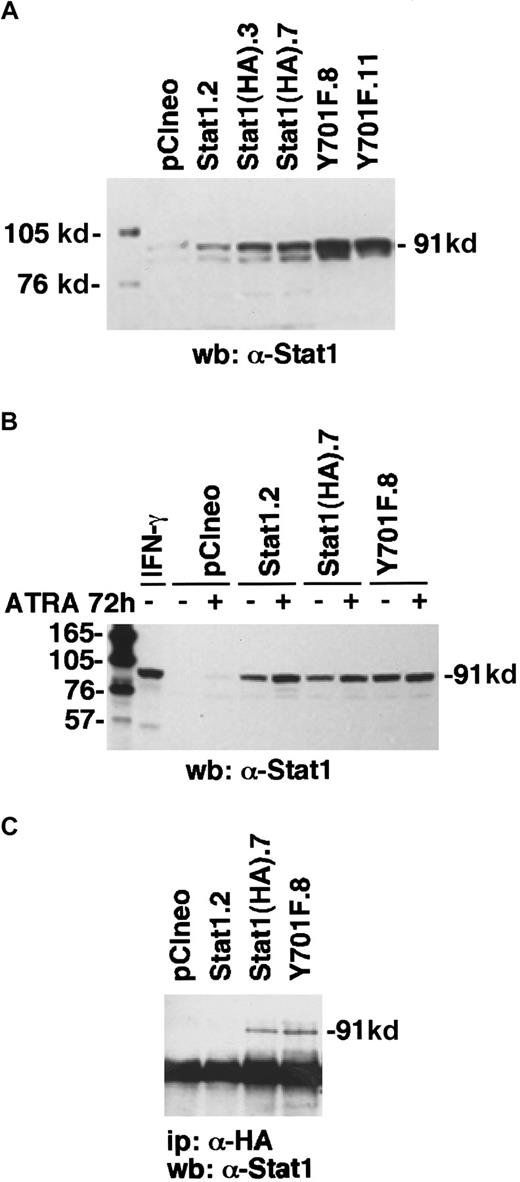
To determine the function of Stat1 and the role of tyrosine 701 in ATRA signaling, we constructed HA-epitope–tagged phosphorylation-deficient Stat1 (Stat1HAY701F) by PCR-based site-directed mutagenesis. In agreement with earlier studies on Stat1 transcriptional function in response to IFN-γ-μ,11transient transfection on Stat1HAY701F to U-937 cells suppressed the ATRA-induced GBP-luciferase reporter activity (Figure4). Sublines of U-937 constitutively expressing vector (pCIneo), wild-type Stat1, and HA-tagged Stat1 constructs were established by G-418 selection. Examination of the levels of Stat1 expression in the sublines (Figure5A) showed a low endogenous expression in the control U-937-pCIneo cells and more than 10-fold higher Stat1 levels in transfected sublines. The sublines were treated with ATRA for 72 hours and Stat1 protein was analyzed to ensure constitutive expression during ATRA induction. Figure 5B shows that the level of ectopically expressed Stat1 protein in the transfected sublines was maintained, and in excess of endogenous Stat1 protein, during ATRA induction. The expression of exogenous Stat1 protein was confirmed by immunoprecipitation with an antibody against the HA tag followed by Western blot using α-Stat1 antibodies (Figure 5C).
Stat1HAY701F inhibits ATRA-induced GBP-Luc reporter activity.
U-937 cells were transiently cotransfected with 0.2 μg of GBP-luciferase reporter ± 0.75 μg of pCI-Stat1, pCI-Stat1Y701F, or empty pCIneo vector, as indicated. At 12 hours after induction the cells were induced by 1 μmol/L ATRA for 36 hours after which extracts were prepared and the luciferase activity measured. Differences in transfection efficiency were corrected for by cotransfection of β-actin–LacZ and measurement of β-galactosidase activity. Data shown are the average of duplicates.
Transfected U-937 cell lines constitutively express exogenous Stat1 proteins.
(A) The levels of Stat1 protein in U-937 stably transfected clones were determined by Western blot with α-Stat1 antibodies. (B) To ensure that the high Stat1 levels were maintained during ATRA-induced differentiation, cells were induced by ATRA for 72 hours and analyzed by Western blot using α-Stat1 antibodies. (C) Immunoprecipitation with antibodies against the hemagglutinin tag 12CA5 followed by Western blot using α-Stat1 antibodies shows exogenous expression of Stat1HA in established cell lines.
ATRA-induced differentiation is impaired by dominant negative Stat1
When induced by ATRA, U-937 cells differentiate and acquire a monocyte-like morphology. To determine if Stat1 has a function in ATRA-induced differentiation, sublines expressing wild-type Stat1 and dominant negative Stat1 were treated with ATRA for 5 days and examined morphologically by May-Grünwald-Giemsa staining (Figure6). Vector control cells and cells expressing Stat1HA differentiated to small monocyte-like cells with slightly lobulated nuclei in response to ATRA treatment, whereas clones expressing Stat1HAY701F, though showing a reduction in size, failed to acquire the morphologic changes associated with terminal differentiation.
Constitutive expression of dominant negative Stat1HAY701F inhibits ATRA-induced differentiation into a morphologically mature monocytic phenotype.
(A, B) pCIneo, (C, D) Stat1(HA).7, and (E, F) Y701F.8 cells were grown with (B, D, F) or without (A, C, E) ATRA for 5 days and cytospin preparations were examined by May-Grünwald-Giemsa staining. (i, ii, iii) Enlargements of cells indicated by arrows in panels B, D, and F. (Magnification [A-E] 1:400; [i, ii, iii] 1:1200).
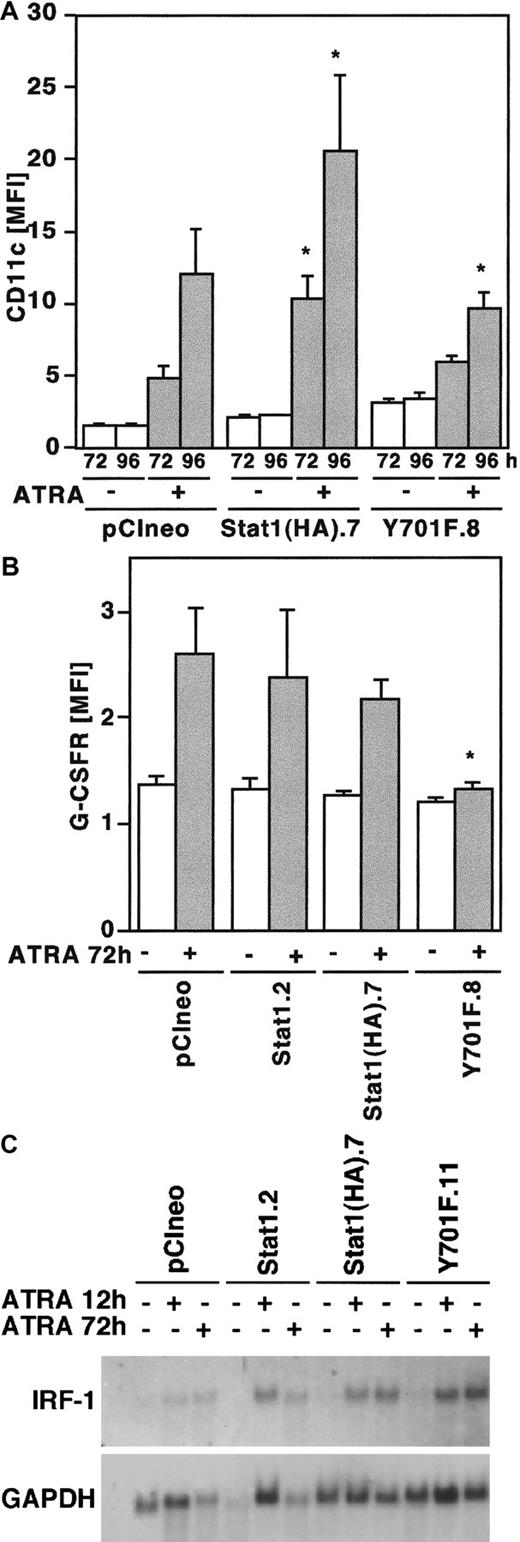
Differentiation of U-937 cells induced by ATRA is associated with increased expression of the surface antigen p150.95/CD11c indicative of monocyte/macrophage differentiation.28,29 In addition, ATRA-induced differentiation is associated with the up-regulation of G-CSFR/CD114 expression.30 Therefore, to further analyze the effect of Stat1HAY701F on ATRA-induced differentiation, cells were stimulated by ATRA and the expression of CD11c and G-CSFR were analyzed by flow cytometry. Cells overexpressing wild-type Stat1HA showed an increased up-regulation of CD11c in response to ATRA, whereas CD11c expression was slightly but significantly repressed in cells expressing Stat1HAY701F (Figure7A). Similarly, the ATRA-induced G-CSFR expression was significantly repressed in the cells expressing Stat1HAY701F (Figure 7B). Taken together, the morphology and CD11c and G-CSFR data indicate that overexpression of Stat1 facilitates the differentiation process, whereas disruption of Stat1 signaling by dominant negative Stat1 impairs differentiation.
ATRA-induced expression of differentiation markers CD11c and G-CSFR is repressed by Stat1HAY701F-expressing U-937 cells.
(A, B) Induction of CD11c (A) and G-CSFR (B) expression by ATRA treatment in U-937 sublines. Cells were induced by ATRA, collected at the indicated time points, and analyzed by flow cytometry. Data are presented as mean fluorescence intensity (MFI) values correlated to autofluorescence of unlabeled cells. Mean values ± SD (n = 5). The asterisks indicate significant differences to the corresponding pCIneo controls (P < .05). (C) ATRA-induced expression of IRF-1 is not inhibited in U-937 sublines. Total RNA was prepared from unstimulated cells or cells treated with ATRA for 12 and 72 hours, and subjected to Northern blot analysis with IRF-1 and GAPDH probes.
IRF-1 expression is not inhibited by the expression of dominant negative Stat1
In addition to Stat1 up-regulation, both ATRA and IFNs also induce the expression of IRF-1, a transcription factor that has been implicated in the regulation of proliferation of hematopoietic cells. The IRF-1 gene promoter contains a GAS site with the capacity to bind Stat1-Stat1 dimers,31 in addition to a proposed RARE.32 To investigate if expression of Stat1HAY701F influenced the transcription of IRF-1, thereby inhibiting differentiation, the mRNA expression of IRF-1 was examined by Northern blot (Figure 7C). IRF-1 mRNA was induced normally in all sublines, possibly by direct transcriptional activation mediated by the RARE. This indicates that the repression of terminal differentiation is not due to an inhibition of IRF-1 expression.
Expression of Stat1HAY701F inhibits ATRA-induced cell cycle arrest
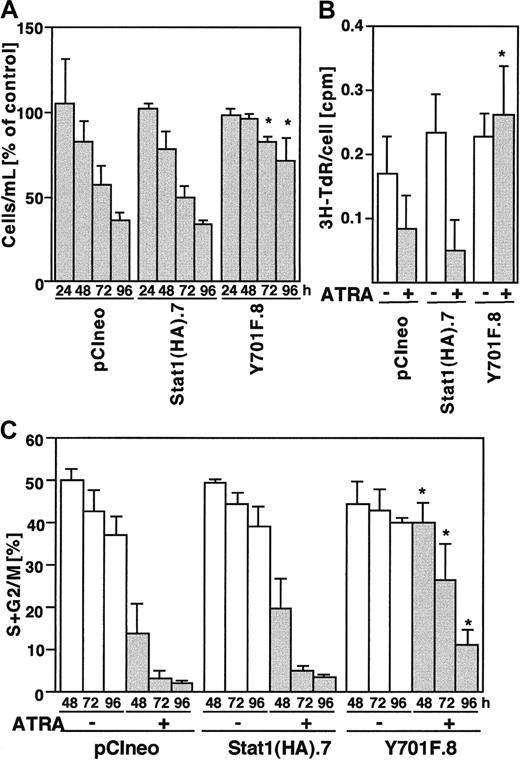
Terminal differentiation induced by ATRA is tightly coupled to proliferation arrest. To determine if Stat1 is important for ATRA-induced cell cycle arrest of U-937 cells, sublines expressing wild-type and phosphorylation-deficient Stat1 were induced with ATRA for 24 to 96 hours and compared with respect to proliferation, DNA synthesis, and cell cycle distribution.
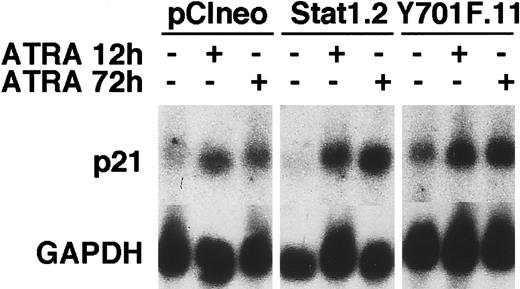
Cell counting experiments showed that the total number of cells decreased in vector and Stat1HA sublines after ATRA induction, compared to untreated controls, whereas the reduction in cell numbers in Stat1HAY701F-expressing clones was clearly less pronounced (Figure 8A). Thymidine incorporation assays confirmed that clones expressing Stat1HAY701Fcontinued to synthesize DNA after 72 hours of ATRA induction, whereas wild-type Stat1 cell lines showed a marked reduction in DNA synthesis (Figure 8B). Finally, the cell cycle phase distribution was determined by FACS analysis of PI-labeled nuclei (Figure 8C). Vector transfected cells and cells expressing wild-type Stat1 accumulated in the G0/G1 phase of the cell cycle after 48 hours of ATRA stimulation as previously described for parental U-937 cells.29,33 In contrast, sublines constitutively expressing Stat1HAY701F still had a high percentage of cells in S phase and G2 phase after 72 and 96 hours of ATRA treatment, indicating a failure to undergo the G1 arrest normally associated with terminal differentiation. Expression of the cyclin-cdk inhibitor p21WAF1/CIP1 has been shown to be induced by ATRA34 and has also been suggested to be directly regulated by Stat1.35 To test the possibility that absence of p21WAF1/CIP1 induction contributed to the failure to arrest the cell cycle, we analyzed the p21 mRNA expression. However, as seen in Figure 9, similar levels of ATRA-induced p21 expression were observed in vector-, Stat1-, and Stat1HAY701F-expressing cells, indicating that a lack of p21 induction does not explain the differences in cell cycle arrest.
Constitutive Stat1HAY701F expression inhibits ATRA-induced growth arrest.
(A) Proliferation of pCIneo, Stat1(HA).7, and Y701F.8 cells after ATRA treatment. The cells were seeded at 150 000 cells/mL and counted on days 1, 2, 3, and 4. Results are shown as percent of uninduced control cells. Mean ± SD (n = 3). (B) DNA synthesis, as determined by the incorporation of 3H-TdR, was measured after 48 hours of ATRA stimulation and correlated to the total cell number. Data for incorporated 3H-TdR per cell are shown. Mean ± SD (n = 3). (C) Cell cycle analysis of U-937 sublines showing the percentage of cells in the S, G2, and M phases during ATRA differentiation. Cells were stimulated by ATRA, collected at the indicated time points, and the distribution of cells in different cell cycle phases was determined by flow cytometry of PI-stained nuclei. Mean ± SD (n = 3-4). The asterisks indicate significant differences to the corresponding pCIneo controls (P < .05).
ATRA-induced p21 mRNA expression is not repressed by the expression of Stat1HAY701F.
pCIneo, Stat1.2, and Y701F.11 cells were treated with ATRA for 12 and 72 hours or left unstimulated. Total RNA was prepared and Northern blot analysis was done with p21 and GAPDH probes.
ATRA-induced p21 mRNA expression is not repressed by the expression of Stat1HAY701F.
pCIneo, Stat1.2, and Y701F.11 cells were treated with ATRA for 12 and 72 hours or left unstimulated. Total RNA was prepared and Northern blot analysis was done with p21 and GAPDH probes.
U-937 sublines expressing dominant negative Stat1 differentiates normally in response to VitD3
Differentiation of U-937 cells by VitD3 and ATRA results in both distinct phenotypes, evidenced by the expression of different inducer-specific surface markers, as well as expression of the common monocytic antigen CD11c.29 33 This suggests both overlapping and distinct signaling pathways for VitD3- and ATRA-induced terminal differentiation in U-937 cells. Given the induction of Stat1 preferentially during ATRA-induced differentiation, one would predict that this pathway is specifically sensitive to the expression of phosphorylation-deficient Stat1 proteins. However, to test the possibility that expression of Stat1HAY701Faffected differentiation in a more general way, U-937 sublines were stimulated with VitD3 and tested with respect to G0/G1 arrest and expression of the mature surface antigen CD14. We found that all sublines arrested in the G0/G1 phase of the cell cycle after 72 hours of VitD3 treatment (Table 1). No difference could be observed between cells expressing Stat1HAY701F or wild-type Stat1. Likewise, the CD14 surface antigen was induced normally in all clones after 72 hours of VitD3 stimulation. We conclude that the inhibition of ATRA-induced differentiation by dominant negative Stat1 is not due to a general failure to undergo terminal differentiation in these cells.
Vitamin D3-induced differentiation
| Subline . | CD14 (MFI) . | % in S + G2 + M . |
|---|---|---|
| pCIneo | ||
| C | 1 ± 0.1 | 33.4 ± 5.9 |
| D3 | 45 ± 11.8 | 7.6 ± 3.3 |
| Stat1HA.7 | ||
| C | 1 ± 0.01 | 40.1 ± 0.3 |
| D3 | 55 ± 19 | 7.1 ± 2.8 |
| Stat1Y701F.8 | ||
| C | 1 ± 0.1 | 32 ± 1.8 |
| D3 | 46 ± 10.6 | 4.1 ± 0.1 |
| Subline . | CD14 (MFI) . | % in S + G2 + M . |
|---|---|---|
| pCIneo | ||
| C | 1 ± 0.1 | 33.4 ± 5.9 |
| D3 | 45 ± 11.8 | 7.6 ± 3.3 |
| Stat1HA.7 | ||
| C | 1 ± 0.01 | 40.1 ± 0.3 |
| D3 | 55 ± 19 | 7.1 ± 2.8 |
| Stat1Y701F.8 | ||
| C | 1 ± 0.1 | 32 ± 1.8 |
| D3 | 46 ± 10.6 | 4.1 ± 0.1 |
U-937 sublines; pCIneo, Stat1HA.7, and Stat1Y701F.8 were induced by 1,25(OH)2 vitamin D3 for 72 hours. C indicates untreated control. Expression of the monocytic differentiation antigen CD14 mean fluorescence intensity (MFI, arbitrary units) was analyzed using flow cytometry. DNA content was measured by flow cytometry of propidium iodide–stained nuclei. Percent of the cells in S + G2 + M phase of the cell cycle was calculated using MacCycle Software. Data are presented as mean ± SD (n = 2).
Discussion
Successful clinical treatment of APL relies on the ability of ATRA to induce terminal differentiation and cell cycle arrest of the immature leukemic cells. However, the molecular mechanisms underlying the effect of ATRA on these processes are still poorly understood. Although recent work has correlated ATRA-induced differentiation with the up-regulation of STAT and IRF transcription factors,5-8,36 37 this study presents the first evidence of a functional importance of these proteins in ATRA-induced terminal differentiation of myeloid cells.
We show that in U-937 cells, ATRA induces up-regulation of Stat1 protein levels, increased phosphorylation of tyrosine 701 and nuclear translocation, consistent with the ATRA-induced transcriptional activation of a GBP-luciferase reporter. The mechanisms by which Stat1 expression and phosphorylation are induced by ATRA are still not clear. Previous studies have shown that Stat1 activation in ATRA-induced differentiation of HL-60 and NB-4 cells is associated with IFN-α production,7,8,37 raising the possibility of an autocrine loop mediating the Stat1 activation. However, we were unable to detect any IFN-α mRNA by RT-PCR from U-937 cells treated for 48 hours by ATRA, a time point at which Stat1 activation has occurred. Moreover, using a sandwich enzyme-linked immunosorbent assay, which readily detects the previously reported ATRA-induced IFN-α production in NB-4 cells, we have not been able to detect IFN-α production in U-937 cells in response to ATRA treatment (data not shown). Thus, we do not find any evidence for an autocrine IFN-α loop and therefore favor a more direct mechanism of activation, consistent with comparatively rapid kinetics of induced Stat1 expression and tyrosine phosphorylation.8
To address the role of Stat1 activation during ATRA-induced differentiation, we used dominant negative Stat1 to interfere with the part of the signaling pathway that involves Stat1 function. Strikingly, the ATRA-induced morphologic maturation toward a monocyte-like phenotype was absent in sublines expressing Stat1HAY701F. The suppression of the monocytic differentiation markers CD11c and G-CSFR by dominant negative Stat1 and the corresponding increase in CD11c in cells expressing the wild-type protein give further evidence of a functional role of Stat1 in ATRA-induced differentiation. Terminal differentiation of U-937 cells is closely linked to cell cycle arrest. The observation that dominant negative Stat1 inhibited ATRA-induced proliferation arrest in U-937 cells lends additional support for a central role of Stat1 in the process of differentiation induced by ATRA. The inhibitory effect on growth arrest was most likely the result of a failure to accumulate in the G0/G1 phase of the cell cycle, leading to continued DNA synthesis. Similarly, previous work has shown that IFN-induced cell cycle arrest is dependent on transcriptionally active Stat138 and that the expression of dominant negative Stat1Y701F in A431 cells inhibits EGF-induced growth arrest.16 However, knowledge about the involvement of Stat1 in cell cycle regulation is still incomplete. It has been shown that ATRA induces the expression of the cyclin-dependent kinase inhibitor (CKI) p21/WAF1/CIP1 in U-937 cells,34 pointing to p21 induction as a possible mediator of ATRA-induced cell cycle arrest. Interestingly, Stat1, Stat3, and Stat5 have previously been implicated in the regulation of p21 expression by binding to GAS elements in the p21 promoter, in response to IFN-γ, IL-6, and thrombopoietin (TPO), respectively.35,39,40 However, we found that ATRA induced p21 mRNA expression to the same extent in Stat1Y701F-expressing cells and control sublines, suggesting that dominant negative Stat1 inhibits some other aspect(s) of the differentiation associated cell cycle arrest. On the other hand, Stat proteins have also been implicated in the regulation of growth-promoting signals; for example, both Stat3 and Stat5 have recently been shown to transcriptionally regulate the cyclin D1 promoter.41 42 Thus, dominant negative Stat1 may lead to dysregulation of both CKIs and cyclins, affecting proliferation and, indirectly, differentiation. This possibility warrants further investigation. However, the terminal differentiation and cell cycle arrest induced by VitD3 in U-937 cells expressing dominant negative Stat1 strongly argues against a general differentiation block, and rather suggests that Stat1 is specifically and selectively involved in ATRA-induced downstream signaling events.
Several explanations for the effects of dominant negative Stat1 in ATRA-induced differentiation and cell cycle arrest of U-937 cells can be envisioned. First, the lack of tyrosine phosphorylation may disrupt phosphotyrosine-SH2 domain interactions and interfere with the function of Stat1-containing transcriptional complexes induced by ATRA. Although the nature of the Stat1-containing complex induced by ATRA remains to be elucidated, we find that Stat1Y701F inhibits ATRA-induced GBP-promoter luciferase activity. This points to a disruption of the transcriptional activity of an ISRE/GAS binding complex as the underlying mechanism. The common usage of CBP/p300 by Stat1, RAR, and AP-1 represents a second possibility, in which competition for limiting amounts of the coactivator has been suggested to result in inhibitory cross-talk between the different signaling pathways.43,44However, we find this explanation unlikely because if this were the case, (1) similar effects would be expected by the overexpression of wild-type Stat1; (2) in contrast to these reports, we observe synergy between IFN-γ and ATRA on the transcriptional activity of a stably integrated RARE-Luciferase reporter in U-937 cells (data not shown); and (3) transient transfections of U-937 cells expressing Stat1HAY701F with an RARE-luciferase reporter plasmid showed normal induction of luciferase activity in response to ATRA (data not shown). Similarly, the expression of the IRF-1gene, which has been suggested to be directly regulated by a RARE in the promoter region,32 is induced normally in Stat1HAY701F-expressing cells, consistent with the recent observation that IRF-1 is induced normally by ATRA in NB-4 clones resistant to ATRA-induced differentiation and growth arrest.37 In contrast, the ATRA induction of Stat1 in these resistant NB-4 cells is absent, correlating lack of Stat1 expression to inhibition of differentiation. Taken together, the evidence argues against a direct effect of dominant negative Stat1 on ATRA-induced RARE-mediated trancriptional activity and favors the idea that specific steps downstream of the initial ATRA-induced signal involve Stat1. Thus, the complex molecular mechanisms underlying the interactions between the Stat1 and ATRA signaling pathways remain undefined and is an important area for future investigations.
In conclusion, we demonstrate that activation of Stat1 by ATRA, involving phosphorylation on tyrosine 701, is necessary for induction of normal differentiation and cell cycle arrest in U-937 cells. This observation is important for understanding the signaling pathway by which ATRA affects myeloid differentiation. Moreover, it may also have implications for clinical approaches using differentiation-induction of the leukemic cells as the major therapeutic principle.
Acknowledgments
We thank Inger Karlberg for excellent technical assistance and Monica Pettersson for critical reading of the manuscript.
Supported by the Swedish Cancer Society, the Magnus Bergvall and Lovisa/Thielman Foundations and the Hans von Kantzow Foundation.
The publication costs of this article were defrayed in part by page charge payment. Therefore, and solely to indicate this fact, this article is hereby marked “advertisement” in accordance with 18 U.S.C. section 1734.
References
Author notes
Frederik Öberg, Department of Genetics and Pathology, Section of Pathology, The Rudbeck Laboratory, Uppsala University, SE-75185, Uppsala, Sweden; e-mail:Fredrik.Oberg@genpat.uu.se.


![Fig. 6. Constitutive expression of dominant negative Stat1HAY701F inhibits ATRA-induced differentiation into a morphologically mature monocytic phenotype. / (A, B) pCIneo, (C, D) Stat1(HA).7, and (E, F) Y701F.8 cells were grown with (B, D, F) or without (A, C, E) ATRA for 5 days and cytospin preparations were examined by May-Grünwald-Giemsa staining. (i, ii, iii) Enlargements of cells indicated by arrows in panels B, D, and F. (Magnification [A-E] 1:400; [i, ii, iii] 1:1200).](https://ash.silverchair-cdn.com/ash/content_public/journal/blood/96/8/10.1182_blood.v96.8.2870/5/m_h82000240006.jpeg?Expires=1767746590&Signature=M1Ae8X9wAwcMOgwY~RVS2iKNQXJv2YcLocfVli1Y3RfSaHeWBmzdKgVqWq8-l25rffEbyp~-D0FNKXiqnZmVcOy6m-THnG3-ASZh09bLozIZgoNPc6LRkLzStb~~9DRsenny~um9qCPulahIP-QwVzorBLLoN2P6k~eCNk2eUQKMV4pc4WKQJczen9U31E0YwVRvS5o1zotuOJhqrE5bR7ERFAVy4JsM7IPkBiC8WWENS5x3~qd3oOrnqiMu8CfEM1ZCKNPaUz39FsuYnF0T9pyoR9MQlUu1yyrj26QlmYIA1GpIK9RPtHj6jT7QtKqfhIWa2DAlr80SfO~UUEV6ZQ__&Key-Pair-Id=APKAIE5G5CRDK6RD3PGA)
This feature is available to Subscribers Only
Sign In or Create an Account Close Modal