Abstract
Mcl-1 is a member of the Bcl-2 protein family, which has been shown to delay apoptosis in transfection and/or overexpression experiments. As yet no gene knockout mice have been engineered, and so there is little evidence to show that loss of Mcl-1 expression is sufficient to trigger apoptosis. U937 cells constitutively express the antiapoptotic protein Bcl-2; but during differentiation, in response to the phorbol ester PMA (phorbol 12 β-myristate 13 α-acetate), Mcl-1 is transiently induced. The purpose of this investigation was to determine the functional role played by Mcl-1 in this differentiation program. Mcl-1 expression was specifically disrupted by chimeric methylphosphonate/phosphodiester antisense oligodeoxynucleotides to just 5% of control levels. The depletion of Mcl-1 messenger RNA (mRNA) and protein was both rapid and specific, as indicated by the use of control oligodeoxynucleotides and analysis of the expression of otherBCL2 family members and PMA-induced tumor necrosis factor–α (TNF-α). Specific depletion of Mcl-1 mRNA and protein, in the absence of changes in cellular levels of Bcl-2, results in a rapid entry into apoptosis. Levels of the proapoptotic protein Bax remained unchanged during differentiation, while Bak expression doubled within 24 hours. Apoptosis was detected within 4 hours of Mcl-1 antisense treatment by a variety of parameters including a novel live cell imaging technique allowing correlation of antisense treatment and apoptosis in individual cells. The induction of Mcl-1 is required to prevent apoptosis during differentiation of U937 cells, and the constitutive expression of Bcl-2 is unable to compensate for the loss of Mcl-1.
Introduction
The Bcl-2 family of proteins, which is involved in determining the life and death fate of individual cells, can be split into 2 groups: those that function to prevent apoptosis induction and those that function to promote apoptosis.1The MCL1 gene was identified as a Bcl-2 family member2 and shown to have an antiapoptotic function when transfected and overexpressed in mammalian cells.3-5 We have previously shown that cultured human neutrophil populations lose Mcl-1 protein during spontaneous apoptosis, and all agents tested that delayed this entry into apoptosis also maintained Mcl-1 protein levels.6 The more extensively studied antiapoptotic proteins, Bcl-2 and Bcl-XL, are not expressed in human neutrophils.6 Similar Mcl-1 expression patterns were found in B cells either entering apoptosis or protected from apoptosis by a number of agents.7 Induction of apoptosis in rat neonatal cardiac myocytes is also associated with a loss of Mcl-1 messenger RNA (mRNA).8
These studies do not, however, demonstrate a requirement of Mcl-1 expression in preventing entry into apoptosis, as it is not possible to distinguish if the loss of Mcl-1 expression is the trigger for apoptosis or if the decreasing levels of the labile Mcl-1 protein merely parallel apoptotic death. This protein is rapidly turned over within the cell,9 with a half-life in human neutrophils of less than 1 hour (unpublished data, D.A.M., August 1998). Thus, upon entry into apoptosis and disablement of RNA and protein synthesis, the levels of Mcl-1 protein would be predicted to fall rapidly. There is also evidence that upon activation of caspases, the proteases responsible for disabling a cell during apoptosis,10antiapoptotic Bcl-2 related proteins, are cleaved into proapoptotic peptides.11 Furthermore, Mcl-1 does not contain the BH4 domain found in all other mammalian antiapoptotic Bcl-2 family members, with the exception of A1.1,12 This BH4 domain has been reported to be essential for the antiapoptotic action of Bcl-2 and Bcl-XL,12 raising more doubt as to the significance of the loss of Mcl-1 expression in apoptosis of neutrophils and other cell types. Indeed, it has been demonstrated that overexpression of the Mcl-1 protein provides less protection against apoptosis than Bcl-2 overexpression in the same cell type.4 32
Recent work has identified a signaling pathway that enhances Mcl-1 expression through the phosphorylation of the extracellular signal regulated kinase (ERK) members of the MAP kinase family. Inhibition of the phosphorylation of ERK with the inhibitor PD 98059 prevented the induction of Mcl-1 (in response to PMA [phorbol 12 β-myristate 13 α-acetate]) in the human myeloblastic leukemia (ML-1) cell line and was associated with entry into apoptosis.13 However, this inhibitor may affect other molecular processes that regulate apoptosis, so that its effects on cell survival cannot be specifically attributed to the prevention of Mcl-1 expression.
In this study we used U937 cells, which upon stimulation with PMA, differentiate toward monocytes, with transient induction of Mcl-1 expression. Unlike human neutrophils, other antiapoptotic proteins, including Bcl-2, are constitutively expressed in these cells. Thus, our aim was to determine if the induction of the Mcl-1 protein is superfluous to Bcl-2 expression or if a lack of Mcl-1 expression results in apoptosis. We therefore designed and tested 8 antisense (AS) oligodeoxynucleotides directed against Mcl-1 mRNA that were intended to specifically deplete expression of Mcl-1 in differentiating U937 cells. The liability of the Mcl-1 protein makes it an ideal target for antisense depletion, as the loss of Mcl-1 mRNA would be predicted to be rapidly followed by a loss of Mcl-1 protein. The use of 20-mer chimeric methylphosphonate/phosphodiester oligodeoxynucleotides minimizes the possibility of antisense effects on other genes. Control oligodeoxynucleotides are used to demonstrate the specificity of AS effects. A noninvasive fluorescent cell imaging technique was used to assess oligodeoxynucleotide delivery and monitor apoptotic markers (phosphatidylserine externalization, membrane blebbing, and loss of membrane integrity) in real time during cell culture.
Materials and methods
Cell culture
The human myeloblastic leukemia cell line U937 was maintained in exponential growth in Roswell Park Memorial Institute medium (RPMI 1640) (Gibco Life Technologies, Paisley, Scotland) supplemented with 10% heat-inactivated fetal calf serum (FCS) for 1 hour at 65°C (Seralab, Sussex, England). The cells were always greater than 97% viable before use, as assessed by trypan blue exclusion dye. The cultures were supplemented with 10 ng/mL PMA (from a 40 μg/mL stock in ethanol) to induce differentiation of U937 cells for 3 hours before introduction of oligodeoxynucleotides.
Oligonucleotide synthesis
Phosphodiester and chimeric methylphosphonate/phosphodiester oligodeoxynucleotides were synthesized as previously reported14 using phosphoramidites and methylphosphonamidites (Glenn Research, supplied by Cambio, Cambridge, England) and the slow 1-μmol cycle 381A DNA synthesizer (version 1.23) (Applied Biosystems, Warrington, England). The base deprotection procedure was substituted for that described by Hogrefe et al,15 with the treatment extended to 72 hours at room temperature to ensure complete deprotection of the 5′-aminomodifier C6-TFA group (Glenn Research) to permit subsequent attachment of fluorescein. All oligonucleotides were stored at −20°C in the dark until use.
Reversible cell permeabilization
Streptolysin-O (SL-O) (Sigma Chemical Co, Poole, England) was used to reversibly permeabilize U937 cells toward oligonucleotides.16 SL-O was suspended at 1000 U/mL in magnesium/calcium (Mg2+/Ca++)-free phosphate-buffered saline (PBS) and activated by the addition of dithiothreitol to 5 mmol/L followed by incubation at 37°C for 2 hours. Following assessment of activity, the aliquots were kept at −20°C until use. Cells for permeabilization (previously treated for 3 hours with 10 ng/mL PMA) were washed and resuspended at 107 cells per 400 μL in serum-free RPMI 1640. SL-O (4-9 U/106 cells) was added in the presence or absence of 20 μmol/L oligodeoxynucleotide and incubated at 37°C for 10 minutes. The precise amounts of SL-O required for optimal permeabilization and resealing were identified immediately prior to each experiment by a dose-response optimization procedure. Resealing was achieved by the addition of 1 mL prewarmed and gassed RPMI 1640 supplemented with 10% heat-inactivated FCS, 100 U/mL penicillin, and 100 μg/mL streptomycin and a further incubation at 37°C for 20 minutes. Cells were then transferred to flasks containing 9 mL of the above media further supplemented with 10 ng/mL PMA. Samples of 0.5 mL (5 × 10⁵ cells) were taken for flow cytometric analysis 30 minutes, 4 hours, and 18 hours after the initiation of permeabilization, except in preliminary experiments testing different Mcl-1 AS sequences, where samples were taken at 2 hours. In all experiments (unless otherwise stated) more than 80% of cells were permeabilized toward oligodeoxynucleotides without loss of viability.
Flow cytometry
Cells for flow cytometric analysis had 10 μg/mL propidium iodide (PI) added for 5 minutes on ice before washing and resuspending in ice-cold RPMI 1640. Red and green fluorescence was assayed on a Cytoron Absolute bench top flow cytometer system (Ortho Diagnostics System, Milan, Italy) using a protocol that samples a precisely known volume. This protocol provides information on the cell density of the original culture, the percent viability, the percent permeabilized and resealed (as fluorescein-labeled oligodeoxynucleotides were used), and the relative intracellular oligodeoxynucleotide concentrations.17
Immunofluorescence labeling
Cells for immunofluorescence labeling were fixed and permeabilized in suspension using a Fix and Perm kit (Caltag Laboratories, Burlingame, CA) following the manufacturer's instructions. The cells were blocked with 10% goat serum before labeling with Mcl-1 polyclonal antisera (PharMingen, Milton Keynos, England), followed by fluorescein isothiocyanate (FITC) secondary antisera to rabbit immunoglobulin G (IgG). PI was added to 10 μg/mL suspension for 10 minutes to stain chromatin. Immediately following the labeling procedure, the cells in suspension were treated with Antifade (Molecular Probes, The Netherlands) and sealed under glass cover slips. The cells were imaged using a Zeiss LSM510 confocal microscope (Zeiss, Welwyn Garden City, England) using the appropriate filter sets for the fluorochromes.
Northern blot analysis
Total RNA was extracted from 1.5 × 10⁶ U937 cells using a guanidium thiocyanate/acid phenol method.18 Total RNA was separated by formaldehyde gel electrophoresis before capillary transfer to Zetaprobe GT membranes (Bio-Rad Laboratories, Hercules, CA). We labeled the β-actin ATCC 65128 probe, a Mcl-1 complementary DNA (cDNA) clone [bases 1236-2350], and the TNF-α cDNA probe encompassing the full coding region with32P-dCTP (phosphorous 32 cytidine 5′-triphosphate) using a random primed labeling kit (Amersham Pharmacia Biotech, Arlington Heights, IL). The membranes were sequentially probed as described.19 Radioactivity was detected and quantified using a Molecular Imager GS363 (Bio-Rad).
Western blot analysis
The cells (2 × 10⁵) were solubilized in reducing sodium dodecyl sulfate–polyacrylamide gel electrophoresis (SDS-PAGE) sample buffer at 100°C, separated on 13% polyacrylamide gels, and electrotransferred to polyvinylidene fluoride (PVDF) membranes using standard techniques. Antibodies used were Mcl-1, Bak, Bax, and caspase-3 (PharMingen) and Bcl-2 Ab1 (Calbiochem, Nottingham, England). In some cases, the membranes were concurrently probed with more than one primary antibody. Secondary HRP-conjugated antibodies against rabbit IgG (Amersham Pharmacia Biotech) and mouse IgG (Sigma) were used with an enhanced chemiluminescence (ECL) kit (Amersham Pharmacia Biotech) to detect bound primary antibodies. Densitometry from carefully exposed blots (to avoid film saturation) was performed with Image 1.44 VDM software (National Institutes of Health, Bethesda, MD). The equivalence of loading was confirmed by ponceau S (Sigma) stained actin on the membranes.
Apoptosis determination and confocal microscopy
Apoptosis (as marked by chromatin condensation) was assessed by PI labeling of nuclei and flow cytometric analysis.20Culture of AS-treated U937 cells on a Zeiss LSM510 confocal microscope was achieved by using a Bioptech perfusion chamber (Bioptechs, Butler, PA) maintained at 37°C. The cells were cultured in the same medium used in other experiments except for the addition of PI to 0.5 μg/mL medium and annexinV-Cy3 (Appligene Oncor Lifescreen, Watford, England) to 1.0 μg/mL medium. Images at 1024 × 1024 pixel resolution were taken every 6 minutes through a 40 times objective with 4 times averaging over an 18-hour period. The tracking mode was used to eliminate spill-overs between fluorochromes. Excitation was at 488 nm for PI and fluorescein and 543 nm for Cy3. PI fluorescence was collected through a 570-nm dichroic mirror and a 650-nm long-pass filter. Fluorescein fluorescence was collected from a 570-nm dichroic mirror and then a 545-nm dichroic mirror and through a 505- to 550-nm bandpass filter. Cy3 fluorescence was collected from a 570-nm dichroic mirror and through a 545-nm dichroic mirror and a 560- to 615-nm bandpass filter. At least 2 further fields were examined at the end of the experiment to ensure the chosen field was representative.
Statistical analysis
The paired Student t test was used to measure the statistical significance of differences between paired data sets. All data are presented as mean ± SD, where n represents the number of experiments.
Results
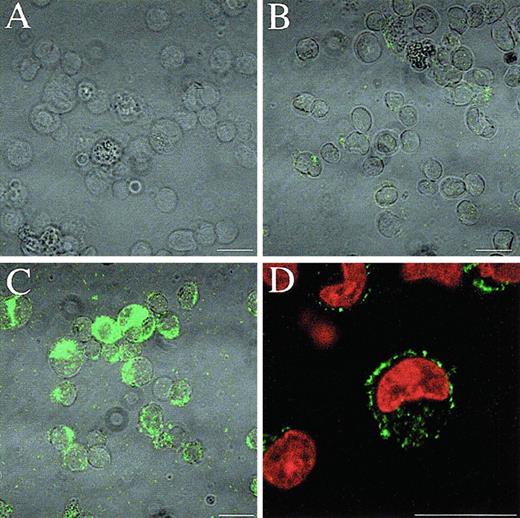
The human myeloid leukemia cell line U937 can be induced to differentiate toward monocytes by treatment with PMA. This differentiation is accompanied by the rapid and transient induction of Mcl-1 mRNA and protein. Immunofluorescence confocal microscopy showed that the Mcl-1 protein was expressed minimally in non-PMA–treated U937 cells and was dramatically up-regulated following PMA treatment (Figure1). The pattern of expression within the cell was consistent with a mitochondrial localization of the protein, as seen with ML-1 cells.9Mcl-1 mRNA levels peak around 6 hours after PMA treatment, showing at least a 5-fold induction, with levels clearly declining by 24 hours (results not shown). The Mcl-1 protein is similarly induced approximately 7-fold by 6 hours and declines by 24 hours (results not shown).
Induction of Mcl-1 protein by PMA in U937 cells.
U937 cells were prepared for immunofluorescence confocal microscopy to show Mcl-1 expression. (A) Second-antibody only labeled PMA-treated U937 cells after 18 hours of treatment. (B) Undifferentiated U937 cells. (C) PMA-treated U937 cells after 18 hours of treatment. (D) The same as panel C, with additional PI counterstaining of nuclei. Bar = 15 μm.
Mcl-1 AS design and testing
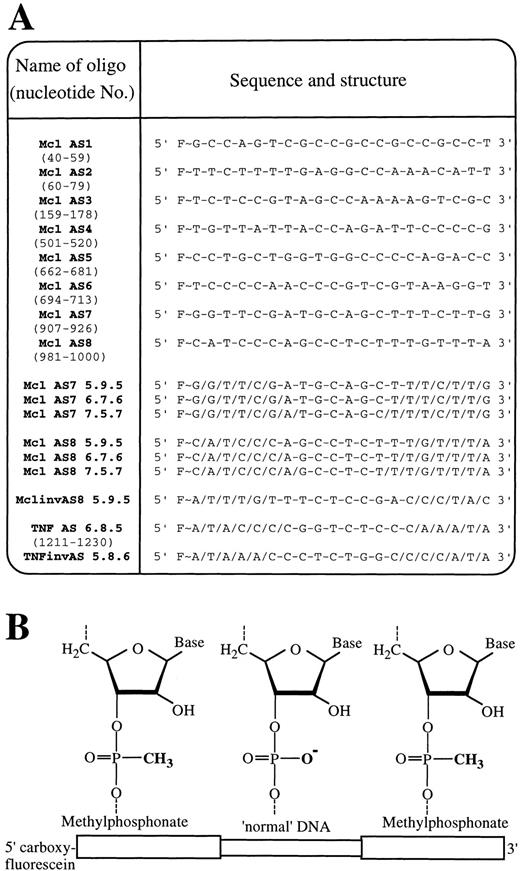
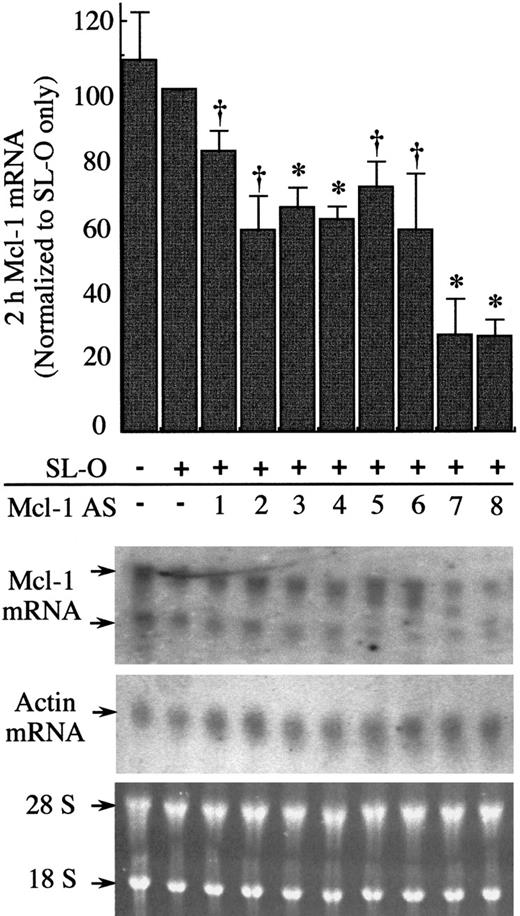
Initial experiments were designed to select the most efficient of 8 Mcl-1 AS sequences at down-regulating Mcl-1 mRNA in differentiating U937 cells. We targeted 20-mer end-protected all-phosphodiester oligodeoxynucleotides to various regions spanning the entire coding sequence of the Mcl-1 mRNA (Figure 2, Mcl AS1-8). The compounds were introduced into the U937 cells previously exposed to 10 nmol/L PMA for 3 hours using reversible permeabilization with SL-O. This reversible permeabilization delivers oligodeoxynucleotides into cell cytoplasm and nuclei in approximately 90% of cells without loss of viability, with the remaining 10% either nonviable or nonpermeabilized.21The efficacy of each of the 8 Mcl-1 antisense sequences was tested by Northern blot analysis for Mcl-1 mRNA 2 hours after introduction of oligodeoxynucleotides into PMA-treated U937 cells (Figure3). SL-O treatment alone had little effect on the Mcl-1 mRNA levels, whereas all 8 of the Mcl-1 AS sequences were able to deplete Mcl-1 mRNA at varying levels. The Mcl-1 AS sequences 7 and 8 were identified as the most potent, resulting in up to an 80% decrease of Mcl-1 mRNA levels within 2 hours of AS delivery.
Sequence and structure of oligodeoxynucleotides.
(A) Abbreviated names, sequence, and internucleoside linkages of all oligodeoxynucleotides used in this study. Target positions of oligonucleotides within the mRNA of Mcl-1 (ORF 61-1110) and TNF-α (ORF 86-787) are shown in brackets below each oligodeoxynucleotide name. F∼ = 5(6)carboxyfluorescein-aminohexanol linkage, / = phosphodiester internucleoside linkage, and − = methylphosphonate internucleosidal linkage. (B) Schematic showing chimeric phosphodiester/methylphosphonate oligodeoxynucleotide structure.
Efficacy of 8 all-phosphodiester Mcl-1 AS oligodeoxynucleotides against Mcl-1 mRNA 2 hours after introduction of AS oligodeoxynucleotides.
U937 cells were treated for 3 hours with PMA before introduction of AS oligodexoynucleotides. Total RNA was extracted 2 hours after AS treatment, and Mcl-1 and actin mRNA levels were assessed by Northern blotting. The blots shown are representative of 3 independent experiments. Ethidium bromide–stained 28 and 18 S rRNA is shown to indicate the equivalence of loading. Significant difference from controls treated only with SL-O is indicated by a dagger (P ≤ .05) or an asterisk (P ≤ .01).
The end-protected all-phosphodiester oligodeoxynucleotides are not entirely stable within the cell, as they are degraded by endonucleases. In these experiments the half-life was approximately 2 hours, with 49.2% ± 4.4% (n=3) of oligodeoxynucleotides, remaining after 2 hours, and was determined by flow cytometric fluorescence measurements. It was therefore necessary to synthesize more stable oligodeoxynucleotides to obtain more potent and long-lived Mcl-1 AS effects. The use of chimeric methylphosphonate/phosphodiester oligodeoxynucleotides (Figure 2) allows the ribonuclease (RNase) H directing capability of the unmodified DNA component of the oligodeoxynucleotides to be combined with the nuclease-resistant methylphosphonate DNA. Simultaneously the oligodeoxynucleotides minimize the undesired antisense and nonantisense effects associated with all-phosphodiester oligodeoxynucleotides.17,22 23Mcl-1 AS7 and AS8 were therefore synthesized as 20-mer chimeric oligodeoxynucleotides, with 2 methylphosphonate “wings” surrounding a central unmodified DNA region. For each sequence, 3 oligodeoxynucleotides were synthesized, with either 5, 7, or 9 central phosphodiester linkages, so the optimum balance between oligodeoxynucleotide stability and activity could be achieved (Figure2, sequence, structure, and nomenclature). These chimeric oligodeoxynucleotides showed far improved stability within the cell, with a half-life of approximately 12 hours, with 76.5% ± 6.2% of the oligodeoxynucleotides (n = 3) remaining after 4 hours and 34.3% ± 8.8% (n = 3) remaining by 18 hours.
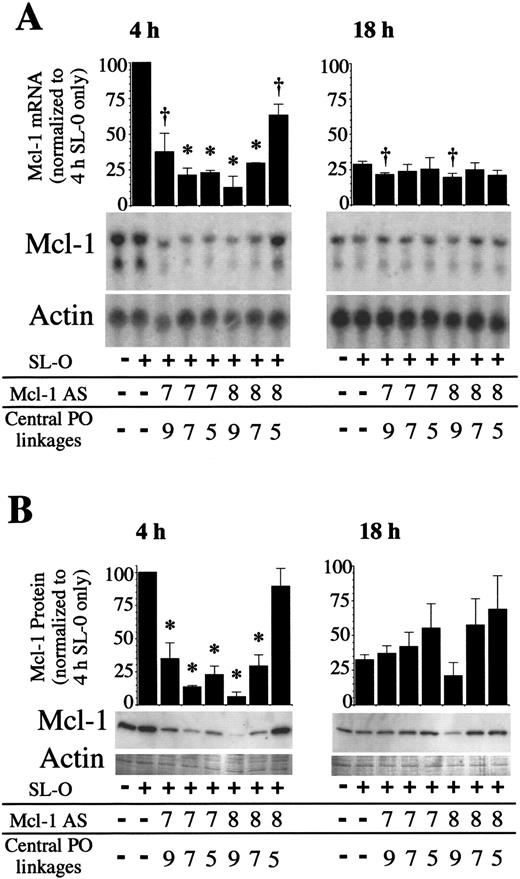
Use of these chimeric oligodeoxynucleotides was predicted to allow sustained depletion of Mcl-1 mRNA and protein in overnight cultures. As Mcl-1 expression is only transiently induced, data were only collected for 18 hours after oligodeoxynucleotide delivery. Figure4 shows Mcl-1 mRNA and protein levels 4 and 18 hours after AS delivery for Mcl AS7 and AS8 chimeric oligodeoxynucleotides. Mcl-1 mRNA and protein were depleted by all AS molecules tested, most strikingly by Mcl AS8 5.9.5 (9 central unmodified DNA phosphodiester linkages, with 2 wings comprising 5 methylphosphonate internucleoside linkages each). Mcl-1 mRNA was deleted by 87.4% ± 7.8% (mean plus or minus SD) and protein by 94.1% ± 3.7% 4 hours after AS delivery. By 18 hours after AS delivery, the depletion of Mcl-1 was less marked. This is likely due in part to the loss of AS molecules within the cell, but also because the levels of Mcl-1 were declining to basal levels. The potency of the 3 different chimeric Mcl AS8 oligodeoxynucleotides were shown to differ considerably. Depletion of the Mcl-1 protein was maximal 4 hours after AS delivery, with Mcl AS8 5.9.5 followed by Mcl AS8 6.7.6 giving a 81.0% ± 8.5% depletion and Mcl AS8 7.5.7 only depleting by 10.8% ± 13.5%. These differences in activity between oligodeoxynucleotides of identical base sequence demonstrate the need to balance the enhanced stability gained by increasing the number of methylphosphonate internucleoside linkages, with loss of the RNase H directing ability as the number of unmodified internucleoside linkages are decreased.
Mcl-1 expression following chimeric Mcl-1 AS treatments.
PMA-stimulated U937 cells were treated with chimeric AS molecules, and RNA and protein samples were collected 4 and 18 hours after AS treatment. (A) Mcl-1 and actin mRNA and (B) protein were analyzed by Northern and Western blotting. The blots shown are representative of 3 independent experiments. Significant difference from controls treated only with SL-O is indicated by a dagger (P ≤ .05) or an asterisk (P ≤ .01).
Specificity of Mcl-1 AS treatment
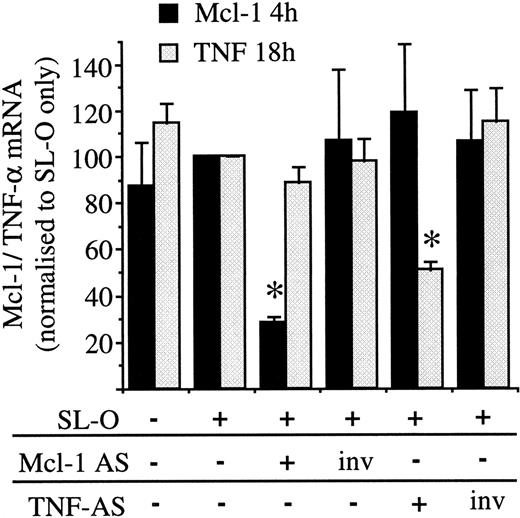
The specificity of the most potent Mcl-1 AS molecule (Mcl AS8 5.9.5) was assessed next. PMA treatment of U937 cells causes up-regulation of a number of genes, among these isTNFA,24 which is induced maximally 18-24 hours after PMA treatment but barely detectable at 4 hours (results not shown). To test the specificity of Mcl AS8 5.9.5, PMA-treated U937 cells were treated with either Mcl AS8 5.9.5, the inverted Mcl AS8 5.9.5 (Mcl invAS8 5.9.5), or a TNF AS molecule (Figure 2) and its inverse. The TNF AS molecule was previously shown to effectively deplete TNF-α mRNA from NP-40 cell lysates by directing RNase H (R.V.G. and D.M.T., unpublished results, April 1998). Figure5 shows that Mcl AS8 5.9.5 treatment depletes Mcl-1 mRNA without affecting induction of TNF-α, while TNF AS depletes TNF-α mRNA without affecting Mcl-1 induction. The inverted AS control oligodeoxynucleotides had no affect on the induction of either gene. Therefore, AS treatment of PMA-treated U937 cells can specifically disrupt induction of individual genes rather than grossly inhibiting all PMA-induced genes.
Induction of TNF-α and Mcl-1 in PMA-treated U937 cells: specificity of AS treatments.
Oligodeoxynucleotides (Mcl AS8 5.9.5, TNF AS 6.8.5, and the inverted controls) were delivered into PMA-stimulated U937 cells stimulated for 3 hours. Mcl-1 and TNF-α mRNA were analyzed by Northern blotting. The data are shown as the mean plus or minus SD of 3 separate experiments. Significant difference from cells treated only with SL-O is indicated by an asterisk (P < .001).
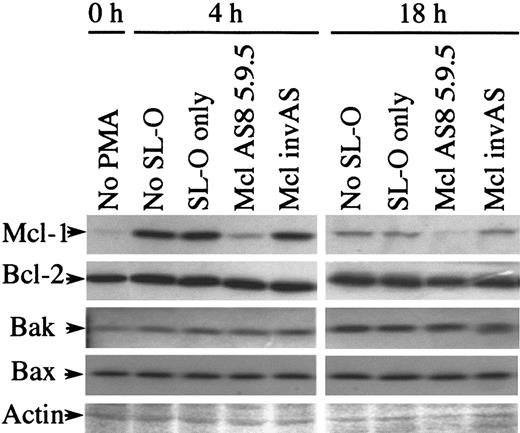
We next assessed the affect of Mcl-1 AS treatment on the expression of other Bcl-2–related proteins found in U937 cells. Figure6 shows Western blot analysis for Mcl-1, Bcl-2, Bak, and Bax. Ponceau S–stained actin is shown to indicate the equivalence of loading in these blots. The induction of Mcl-1 expression by PMA was unaffected by either SL-O treatment or by control oligodeoxynucleotides, while AS treatment effectively depleted Mcl-1 expression. Bcl-2 and Bax protein expression remain essentially constant at 0, 4, and 18 hours regardless of SL-O and AS or control oligodeoxynucleotide treatment. The expression of the proapoptotic protein Bak is up-regulated during PMA-induced differentiation of U937 cells to 166% ± 8.0% (n = 3) at 7 hours and 232% ± 37% (n = 3) at 21 hours after PMA treatment, as measured by the mean plus or minus SD. This up-regulation is unaffected by either SL-O and AS or control oligodeoxynucleotide treatment. To our knowledge, this is the first demonstration of up-regulation of this protein during phorbol ester–induced differentiation of U937 cells.
Expression of Bcl-2 family members other than Mcl-1 are unaffected by Mcl-1 AS treatment.
Protein samples from untreated and PMA- and oligodeoxynucleotide-treated U937 cells were analyzed by Western blotting for various Bcl-2–related proteins. Ponceau-stained actin is shown to demonstrate the equivalence of loading. The results are representative of 3 separate experiments.
Apoptosis induction is a rapid consequence of Mcl-1 depletion
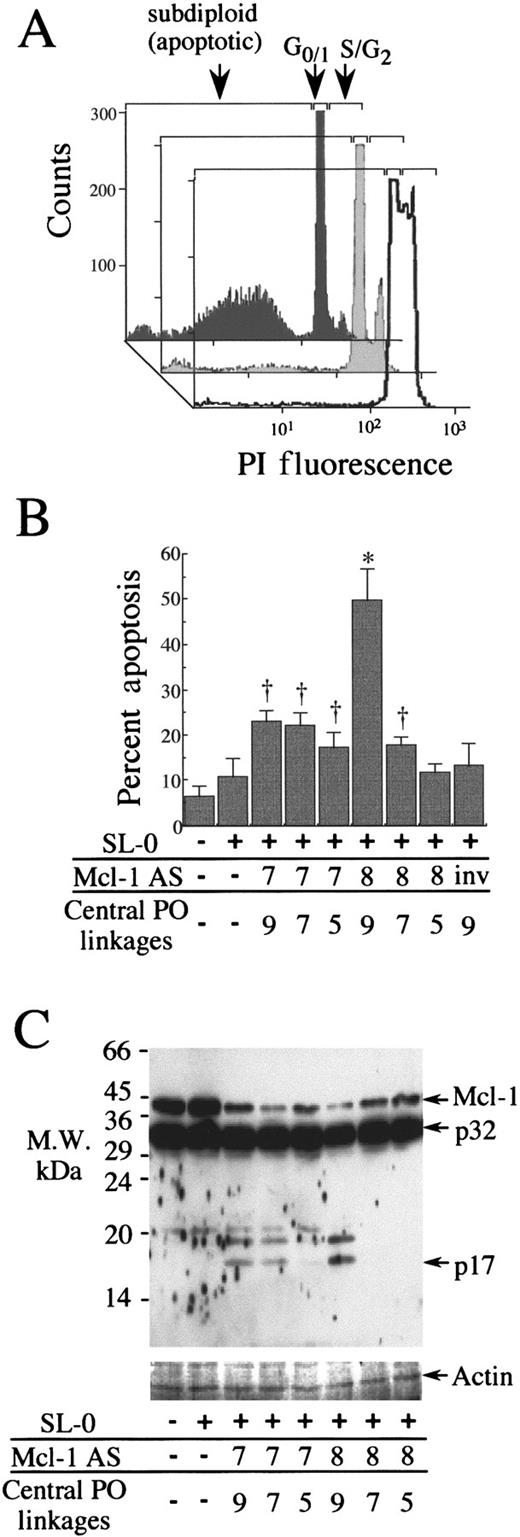
Apoptosis measurements were made in parallel to the measurements of Mcl-1 mRNA and protein disruption for the AS-treated samples shown in Figure 4. Condensation of the chromatin is a late marker of apoptosis,25 which was measured by PI staining of nuclei. Figure 7A shows typical flow cytometric traces, which indicate the loss of proliferation in PMA-treated U937 cells, the low levels of apoptosis in differentiating U937 cells treated only with SL-O, and the markedly increased hypodiploid peak associated with apoptotic cells in Mcl AS8 5.9.5–treated cells. The level of apoptosis apparent 18 hours after AS treatment was greatest in Mcl AS8 5.9.5–treated cells (Figure 7B), which also showed the greatest depletion of Mcl-1 mRNA and protein (Figure 4). The level of apoptosis seen was lower in less potent Mcl-1 AS treatments. For example, the chimeric Mcl AS8 oligodeoxynucleotides showed a diminished potency against Mcl-1 as the number of central unmodified internucleoside linkages are minimized from 9 through 7 to 5 (Figure4). Apoptosis following these treatments was greatest for Mcl AS8 5.9.5 (49.8% ± 7.0% [SD]), intermediate for Mcl AS8 6.7.6 (17.7% ± 2.1%), and lowest for Mcl AS8 7.5.7 (11.8% ± 1.8%) compared with SL-O–only controls, which showed 10.8% ± 4.1% apoptosis at 18 hours. These results indicate that the apoptosis associated with Mcl-1 AS treatment was correlated with the potency of the AS oligodeoxynucleotide against Mcl-1 expression.
Apoptosis and caspase-3 activation following oligodeoxynucleotide delivery to PMA-treated U937 cells.
(A) Representative flow cytometry traces of PI-stained nuclei, cells treated with Mcl AS8 5.9.5 (dark-shaded trace), SL-O (light-shaded trace) for 18 hours, and non-PMA–treated cells (open trace). (B) Apoptosis 18 hours after oligodeoxynucleotide delivery. The data are the mean plus or minus SD of 3 separate experiments. Significant difference from cells treated only by SL-O is represented by a dagger (P ≤ .05) or an asterisk (P ≤ .01). (C) Western blot showing Mcl-1 protein and caspase-3 (where p32 equals procaspase-3, and p17 equals a large active subunit) 4 hours after AS delivery. The data are representative of 3 experiments.
Caspase-3 activation is an early event in apoptosis.10 The levels of nonactivated and activated caspase-3 were examined 4 hours after AS treatment by Western blotting (Figure 7C), which showed a clear relationship between the depletion of the Mcl-1 protein and the appearance of a cleaved activated 17-kd caspase-3 subunit. The approximate 19-kd fragment is an alternatively cleaved large active subunit.26
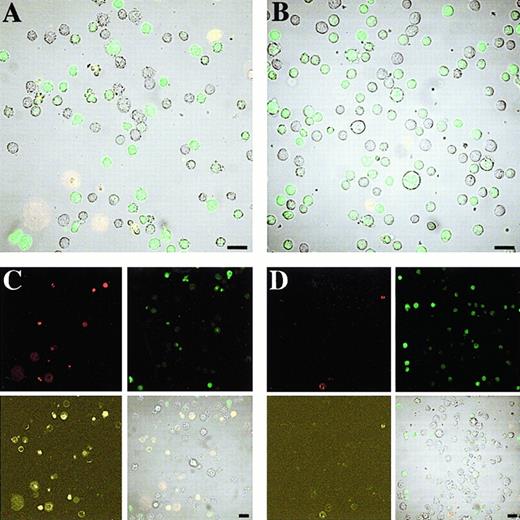
The real-time appearance of apoptotic morphology was then assessed by noninvasive 3-color confocal microscopy, with cells cultured on a temperature-regulated microscope for up to 18 hours. AnnexinV-Cy3 and PI were included in the culture medium to allow concurrent analysis of cellular morphology, oligodeoxynucleotide distribution and intensity, phosphatidylserine externalization, and cell viability. Figure8 shows images of Mcl AS8 5.9.5– and Mcl invAS8 5.9.5–treated cells at 4 and 18 hours. The 3 large annexinV+ and PI+ cells seen in the lower left corner of Mcl AS8 5.9.5–treated cells were cells that lost viability during the SL-O permeabilization procedure.
AS-fluorescein, annexinV-Cy3, and PI comprise the 3-color confocal microscopy of U937 cells treated with Mcl AS8 5.9.5 and Mcl invAS8 5.9.5 for 18 hours.
The cells were treated and cultured as described in “Materials and methods.” (A) Cells were treated with Mcl AS8 5.9.5 for 4 hours and (C) 18 hours. (B) Cells were treated with Mcl invAS8 5.9.5 for 4 hours and (D) 18 hours. (C and D) PI fluorescence is depicted in the top left panel, fluorescein in the top right, Cy3 in the bottom left, and a bright field superimposed with all fluorescence channels in the bottom right. (A and B) A bright field superimposed with all fluorescence channels. The results are representative of 3 separate experiments. Bar = 20 μmol/L.
The delivery of oligodeoxynucleotides into the cell nuclei and cytoplasm is clearly demonstrated. The oligodeoxynucleotides tended to accumulate in the nuclei, although the brightness of fluorescence can make visualization of this difficult. However, less strongly green fluorescent cells clearly show the nuclear localization. The stability of oligodeoxynucleotides within the cells can be inferred from the quantity of green fluorescence per cell during culture, with oligodeoxynucleotides still in evidence after 18 hours of culture. In the Mcl invAS8 5.9.5 control oligodeoxynucleotide–treated cells (Figure 8B,D) there were very low levels of apoptosis seen up to 18 hours, with little loss of viability (less than 10% in each of 3 separate experiments performed on the microscope). In the example shown, the Mcl invAS8 5.9.5 treatment resulted in 10 annexinV+ cells in a field of 97 (10%) by 18 hours. In contrast, the Mcl AS8 5.9.5–treated cells showed a rapid appearance of annexinV–labeled cells, clearly apparent by 4 hours (Figure 8A), but beginning to appear within 2 hours of AS treatment. In the example shown, 27 cells in a field of 64 were annexinV+ by 18 hours (42%, Figure 8C).
Apoptosis is often associated with the appearance of blebs and protrusions from the cell surface.25 This blebbing of cells early in apoptosis was clearly apparent (eg, the group of 3 annexinV+ cells toward the upper left of Figure 8A). This membrane blebbing is seen as early as 2 hours after AS delivery. The binding of annexinV was not seen until after the initial signs of blebbing (up to 30 minutes behind), thereby suggesting that membrane blebbing precedes phosphatidylserine externalization in these cells. The apoptotic cells remained viable for around 10 hours after the binding of annexinV. The levels of oligodeoxynucleotides apparent within individual cells fell rapidly after early signs of apoptosis.
The basal levels of apoptosis seen in the Mcl invAS8 5.9.5 treatments were always less than approximately 10% in experiments performed on the microscope. In experiments with Mcl AS8 5.9.5, performed on the microscope, apoptosis was predominately seen in cells that had clear AS-derived fluorescence immediately before the appearance of apoptotic morphology. In one experiment Mcl AS8 5.9.5 was only delivered into approximately 50% of the cells (a suboptimal concentration of SL-O was used). Data from this experiment allowed us to confirm that the extra apoptosis seen in the Mcl AS8 5.9.5 treatments occurred only in cells that had AS fluorescence. Cells showing no AS fluorescence only became apoptotic at basal levels of less than 10%.
Discussion
The Mcl-1 protein differs from the Bcl-2 protein in that it is a much larger protein (42 kd compared to 26 kd); contains PEST motifs2; and does not have a BH4 domain like that found in Bcl-2, Bcl-XL, and Bcl-w.1 These PEST motifs are probably responsible for the short half-life of the Mcl-1 protein within the cell. Mcl-1 is also expressed in a somewhat different pattern than Bcl-2, being rapidly and transiently induced during myeloid differentiation while Bcl-2 levels remain constant. Mcl-1 is located on light intracellular membranes (in addition to mitochondria) where Bcl-2 is not found.9 Therefore, Mcl-1 may regulate apoptosis in a similar fashion to Bcl-2, but it could also be expected to function in ways that are distinct from Bcl-2.
Previous work from our laboratory has implicated the importance of Mcl-1 (rather than Bcl-2 and Bcl-XL, which are not expressed) in regulating neutrophil survival.6 We show here for the first time that specific disruption of Mcl-1 expression results in a rapid entry into apoptosis in differentiating U 937 cells. These results, therefore, strengthen the theory that Mcl-1 may be a key determinant for survival in cells that express this protein.
The endogenous expression of Bcl-2 in U937 cells was unaffected by Mcl-1 AS treatment, but this expression of Bcl-2 was unable to prevent apoptosis following Mcl-1 depletion. This suggests a distinction in the functional capabilities of Mcl-1 and Bcl-2. Indeed, artificial expression of Bcl-2 in neutrophils delays the appearance of morphological signs of spontaneous apoptosis normally seen in cultured neutrophils, but it is unable to prevent recognition of these cells as apoptotic by phagocytic macrophages.27 This suggests that as Mcl-1 is lost during the culture of neutrophils,6artificial expression of Bcl-2 is only able to partially compensate for this loss.
The proapoptotic protein Bak28-30 is induced during the differentiation of U937 cells in response to PMA (Figure 6). This increased expression of Bak may be the proapoptotic factor that triggers apoptosis in these cells when Mcl-1 expression is disrupted by AS treatment. Bak has recently been shown to function in a very similar manner to Bax in that it is able to regulate the release of cytochrome c from the mitochondria channel VDAC.31 We suggest, therefore, that Bcl-2 and Bax function to control apoptosis and the survival of U937 cells in response to general stresses and insults, but when large-scale changes in gene expression occur during differentiation, Mcl-1 is induced to monitor cellular status. In a comparative study of Mcl-1 and Bcl-2 function in murine myeloid cells, Bcl-2, but not Mcl-1, was able to dimerize with Bax.32 It seems likely, therefore, that Mcl-1 and Bak may form an opposing partnership controlling apoptosis during differentiation.
As shown in this paper, the rapid entry into apoptosis, when the Mcl-1 expression is depleted from a cell that physiologically expresses the protein (as opposed to transfection and overexpression), confirms the antiapoptotic role of Mcl-1 that is implicated from previous transfection/overexpression studies.3-5 This is the first conclusive demonstration that Mcl-1 expression is required to prevent apoptosis in a physiological setting. To our knowledge, only one other study,33 which used antisense plasmids, addresses the protection afforded by Mcl-1 in a cell that expresses the protein physiologically. However, the antisense experiments were only a small part of the study. The methodology used by Chao and colleagues33 (transient transfection of up to 3% of cells with AS plasmid) did not allow for analysis of Mcl-1 mRNA, so an antisense effect cannot be formally concluded. Using flow cytometry of immunofluorescently stained cells, Chao and colleagues33demonstrate a slight nonquantified loss of the Mcl-1 protein in transfected cells. The loss of Mcl-1 was associated with a small (12% ± 6%, as measured by the mean plus or minus SD) increase in apoptosis in AS plasmid-containing cells during a 42-hour period. Thus, the data of Chao and colleagues33 suggest that depletion of Mcl-1 leads to apoptosis, but the data are somewhat inconclusive as the increase in apoptosis is slight, and the methodology precludes the assessment of apoptosis following a more or less potent depletion of Mcl-1 levels.
In our report, the depletion of Mcl-1 at both the mRNA and protein levels by chimeric methylphosphonate/phosphodiester AS oligodeoxynucleotides demonstrates an antisense-mediated depletion of Mcl-1. The use of AS molecules of differing potency against Mcl-1 also clearly demonstrates that a greater depletion of the Mcl-1 protein results in a higher number of apoptotic cells. However, it is not possible to show a precise relationship between levels of Mcl-1 expression and apoptosis due to a number of factors. First, a lag time between triggering of apoptosis due to the lack of Mcl-1 and the appearance of detectable signs of apoptosis was predicted. Second, the induction of Mcl-1 and the induction of differentiation of U937 cells are heterogeneous (Figure 1), so cells that are not entering into a differentiation program early during the course of experiments would not be expected to become apoptotic by 18 hours, the time at which this was assessed. Third, the amount of AS molecules delivered into cells by reversible permeabilization differs by more than an order of magnitude (flow cytometry data not shown), so depletion of Mcl-1 within different cells would be expected to vary relative to the amount of the AS molecule delivered.
This variation in Mcl-1 levels in individual cells is not reflected in Northern and Western blots, so only whole populations can be compared. This may explain the apparent threshold effect seen in these experiments. Depletion of the Mcl-1 protein with Mcl AS7 6.7.6 to 13.4% ± 1.2% (SD) of the control populations at 4 hours resulted in 22.3% ± 2.8% apoptosis at 18 hours. Depletion of the Mcl-1 protein with Mcl AS8 5.9.5 to 5.9% ± 3.7% resulted in 49.8% ± 7.0% apoptosis at 18 hours. This large increase in apoptosis from a slightly greater depletion of Mcl-1 may be explained if there is a threshold level of Mcl-1 required to prevent apoptosis. The depletion of Mcl-1 may have no effect in individual cells until it is depleted beyond this threshold level. Individual cells from each population will have a range of Mcl-1 depletion, and there will be a slightly greater depletion of Mcl-1 in the population treated with Mcl AS8 5.9.5 compared to the population treated with Mcl AS7 6.7.6. This may actually represent a large increase in the number of cells that have had Mcl-1 depleted beyond the putative threshold level required to prevent apoptosis. Further experiments are clearly needed to firmly establish this hypothesis.
This report has used a novel technique for studying apoptosis in live cells, in real time, and by confocal microscopy. This new methodology allowed the assessment of apoptosis by morphology, phosphatidylserine externalization, and loss of viability concurrently with analysis of AS oligodeoxynucleotide distribution and abundance within the cells. The data from these experiments enabled us to confirm that the extra apoptosis seen in Mcl-1 AS treatments was associated only with cells that had AS molecules delivered. In this system, early in apoptosis, the blebbing of cells was clearly apparent and was seen before the binding of annexinV to the cell surface. However, this binding of annexinV after membrane blebbing may be due to the lower concentrations of 0.5 mg/mL annexinV and 0.5 mmol/L calcium in our experiments compared to those typically used for annexinV binding assays (1 mg/mL annexinV and 2.5 mmol/L calcium). Further studies are now under way to assess the sequence of events during apoptosis in a variety of cell types treated to delay or accelerate entry into apoptosis.
This report definitively demonstrates the role of Mcl-1 as an antiapoptotic protein. Further studies will concentrate on the role this protein plays in controlling neutrophil lifespan. This may lead to therapeutic benefits in many disease processes, where excessive neutrophil activation and inappropriate prolongation of an inflammatory response lead to tissue damage and disease. AS-mediated depletion of the Mcl-1 protein may also prove beneficial in treating other diseases, such as acute myeloid and lymphoid leukemia, in which increased Mcl-1 expression is often seen at the time of leukemic relapse.34
Acknowledgment
We thank Caroline Broughton for assistance with flow cytometry, tissue culture, and permeabilization procedures.
Supported by The Wellcome Trust (London, England; grant 054183), the North West Cancer Research Fund (Liverpool, England; CR467), The Leukaemia Research Fund (London, England; 9744), HEFCE (Bristol, England), and Zeiss (Welwyn Garden City, England).
The publication costs of this article were defrayed in part by page charge payment. Therefore, and solely to indicate this fact, this article is hereby marked “advertisement” in accordance with 18 U.S.C. section 1734.
References
Author notes
Dale Moulding, University of Liverpool, School of Biological Sciences, Life Sciences Building, Crown St, Liverpool, England; e-mail: dale@liv.ac.uk.

This feature is available to Subscribers Only
Sign In or Create an Account Close Modal