Abstract
AIM/CD69 is the earliest leukocyte activation antigen and is expressed mainly by activated T, B, and natural killer (NK) cells. It is also constitutively expressed by platelets, by bone marrow myeloid precursors, and by small subsets of resident lymphocytes in the secondary lymphoid tissues. The engagement of CD69 by specific antibodies induces intracellular signals, including Ca++ flux, cytokine synthesis, and cell proliferation. To investigate the physiological relevance of CD69, we generated mice deficient in CD69 (CD69-/-) by gene targeting in embryonic stem cells. CD69 (-/-) mice showed largely normal hematopoietic cell development and normal T-cell subpopulations in thymus and periphery. Furthermore, studies of negative- and positive-thymocyte selection using a T-cell receptor transgenic model demonstrated that these processes were not altered in CD69 (-/-) mice. In addition, natural killer and cytotoxic T lymphocyte cells from CD69-deficient mice displayed cytotoxic activity similar to that of wild-type mice. Interestingly, B-cell development was affected in the absence of CD69. The B220hiIgMneg bone marrow pre-B cell compartment was augmented in CD69 (-/-) mice. In addition, the absence of CD69 led to a slight increase in immunoglobulin (Ig) G2a and IgM responses to immunization with T-dependent and T-independent antigens. Nevertheless, CD69-deficient lymphocytes had a normal proliferative response to different T-cell and B-cell stimuli. Together, these observations indicate that CD69 plays a role in B-cell development and suggest that the putative stimulatory activity of this molecule on bone marrow-derived cells may be replaced in vivo by other signal transducing receptors.
The development of the immune response leads to lymphocyte activation by antigens or mitogens, which readily express genes known as early genes (immediate-early genes); these include proto-oncogenes, growth factors, and cytokine receptors.1CD69, also termed “Activation Inducer Molecule” (AIM),2 is expressed on leukocytes during the activation process (reviewed in Sánchez-Madrid3 and Testi et al4). This molecule is a disulfide-linked homodimer (24 kd)5 that belongs to the type 2 C-type lectin family of surface receptors, characterized by a carbohydrate recognition domain in the C-terminal region.6,7 The CD69 gene is located in the long arm of mouse chromosome 6, syntenic of chromosome 12 in humans.6,7 It is found within the region designated “NK complex,” which comprises several genes from the family of C-type lectins specific for natural killer (NK) cells.4 The genomic organization, promoter regions, and transcriptional activity of the human CD69 gene have been reported.6,8,9 The genetic and biochemical characteristics of mouse CD69 are very similar to its human homologue.4 7
Lymphocyte expression of CD69 can be induced in vitro by a wide variety of agents, such as anti-CD3/T-cell receptor (TCR) and anti-CD2 monoclonal antibody (mAb), activators of protein kinase C (PKC), and phytohemagglutinin (PHA). Soon after stimulation of T lymphocytes through the TCR, CD69 messenger RNA levels are transiently increased.6 CD69 expression is absent in vivo in peripheral blood lymphocytes, but it is expressed by small T- and B-cell subsets in secondary lymphoid tissues, as well as by platelets and bone marrow (BM) myeloid precursors.10-12 The expression of CD69 by thymocytes undergoing positive selection13 is associated with the activation process that occurs during thymic development.14 In this regard, CD69 is a useful marker for defining the molecular map of T-cell development,15 and a putative role for CD69 in T-cell selection has been postulated by its restricted expression during the late stages of thymocyte development.13 Because the CD7+ thymic precursors do not express CD69, it appears that its expression is regulated intrathymically. Furthermore, CD69 expression on thymocytes has been associated with apoptosis of these cells.16 However, T lymphocytes in the inflammatory cell infiltrates of various chronic inflammatory diseases express CD69.17,18 The expression of CD69 associated with inflammatory processes seems to be induced, at least in part, by proinflammatory cytokines. Up-regulation of CD69 expression is observed in vitro after incubation of lymphocytes with exogenous cytokines.19,20 Likewise, it has been shown that tumor necrosis factor α is able to promote the transcriptional activity of the 5′ gene region of CD69 gene, thereby inducing CD69-cell surfaceexpression.8 Although the putative ligands for CD69 are so far unknown, it has been demonstrated that CD69 functions as a signal transducer molecule.2-4 The engagement of CD69 induces an increase in intracellular Ca++, synthesis of cytokines and their receptors, increase in the expression of the proto-oncogenes c-myc and c-fos, as well as cellular proliferation.2,4 21-23 CD69 thus seems to play an important role in the activation and proliferation of human lymphocytes, although its precise role in leukocyte physiology remains undetermined. Here we have studied this issue by generating CD69-deficient mice. The phenotypic and functional characterization of different hematopoietic cell lineages in the absence of CD69 is the subject of this work.
Materials and methods
Generation of CD69-deficient mice
A genomic DNA clone, containing the complete coding sequence of CD69 and including more than 1.5 kb upstream of translation start site and 9 kb 3′ to exon 5 end, was isolated from a murine 129-Sv phage genomic library (Stratagene, La Jolla, CA). The targeting construct was developed, using the 4.5-kb SalI-EcoRI fragment (long arm) 5′ containing exon 1 (intracytoplasmic domain) and the 3-kb XbaI fragment (short arm) containing the exon 5 untranslated region and 3′ region of genomic 129 v-derived DNA and subcloned in a double-selection vector kindly provided by Drs. D. Milstone and R. Mortensen (Brigham and Women's Hospital, Boston, MA). This vector contains the neomycin-resistance gene (neo) for positive selection of the transfected embryonic stem (ES) cells and a copy of the thymidine kinase gene for the negative selection of randomly integrated constructs. ES cells24 were grown, transfected, and selected as described.25 Southern blot was used to identify clones with the expected recombination event, which were analyzed and confirmed using several restriction enzyme digestions (XbaI, BamHI, and EcoRI/EcoRV) and verified using two different probes by Southern blot analysis. The probes used were 5′ flanking, a 2-kb HindIII-EcoRI fragment from the genomic Xba-EcoRI fragment mapping 5′of the targeting construct; 3′Exon-1, a 2-kb HindIII fragment isolated from the genomic fragment SalI-EcoRI carrying the exon 1. Three successfully targeted ES cell clones were aggregated with CD1 morula cells and reimplanted in the uteri of 2.5-day pseudopregnant females. Germline transmission was obtained, and mice were bred to homozygosity on a C57BL/6 genetic background. Consecutive litters were analyzed by polymerase chain reaction using peripheral blood samples.
Mice
Mice were bred at the Centro Nacional de Biotecnologia (Madrid, Spain) under specific pathogen-free conditions. Mice used for experiments were 8 to 16 weeks of age, and all experiments used either littermate controls or age-matched litters whose parents were littermates. In some cases, mice bearing the TCR transgene F526 were intercrossed with CD69 (-/-) mice to obtain F5 transgenic TCR, CD69 (-/+) heterozygous mice that, when intercrossed, produced F5 TCR, CD69 (-/-) and F5 TCR, CD69 (+/+) littermates.
Peptide treatment of F5 TCR transgenic mice
Mice were injected intraperitoneally with the peptide 9-mer Ala-Asn-Glu-Asn-Met-Asp-Ala-Met NP-366–374 from the influenza virus nucleoprotein A/NT/60/68 in phosphate-buffered saline (PBS) at the indicated concentration.
Cell culture
All cell cultures were maintained in RPMI 1640 medium supplemented with 5% heat-inactivated fetal calf serum, 10 mmol/L HEPES, 10-5 mol/L 2-mercaptoethanol, 100 U/mL penicillin/streptomycin, 2 mmol/L L-glutamine, and 1 mmol/L sodium pyruvate at 37°C, 5% CO2.
Determination of hematological parameters
To measure blood cell parameters, whole blood was collected in tubes containing K-EDTA and analyzed on an automatic hematology counter (Technicon H*1E, Bayer, Tarrytown, NY).
Flow cytometry analysis
BM, thymus, spleen, lymph node, peripheral blood, and peritoneal exudate cell suspensions were obtained from CD69 (-/-) or control C57BL/6 littermates. Cells were stained with FITC-, PE-, TC-, or SPRD-conjugated antibody reagents or indirectly with biotinylated antibodies followed by streptavidin-FITC, -PE, -TC, or -SPRD. The antibodies used for staining were anti-CD69 (H1.2F3), anti-CD2 (RM2-5), anti-CD3 (17A2), anti-CD4 (GK1.5), anti-CD5 (53-7.3), anti-CD8 (53.6.7), anti-CD25 (PC61), anti-CD44 (IM7), anti-NK (D × 5), anti-TCRαβ (H57-597), anti-Vβ3 (53), anti-Vβ8 (F2.3.1), anti-Vβ11 (RR3-15), anti-Vα2 (B20.1), anti-TCRγδ (GL3), anti-B220/CD45R (RA3-6B2), anti-CD43 (S7), anti-BP1 (6C3), anti-immunoglobulin (Ig) M (AF6-78), anti-IgD (AMS15.1.5), and anti-HSA (M1/69) (PharMingen, San Diego, CA). Propidium iodide was used at 5 μg/mL to detect dead cells. Cells were analyzed with a FACScan flow cytometer (Becton Dickinson, Mountain View, CA). Cell staining and flow cytometry were performed according to standard methods, and, for 4-color analysis, a total of 50 000 events were acquired.
Analysis of hematopoietic progenitors
Progenitors of the granulocyte/macrophage lineage were assayed by culturing 105 BM cells in Bactoagar medium (Difco, Detroit, MI), as previously described.27 Briefly, cells were resuspended in Iscove's modified Dulbecco's medium (Gibco-life Sciences, Gaithersburg, MD) supplemented with 25% horse serum (Gibco) and 10% WEHI-3b conditioned medium as an interleukin-3 (IL-3) source, and then mixed with Bactoagar (0.3% final concentration) and seeded into 35-mm plastic tissue culture dishes (Nunc, Roskilde, Denmark). The megakaryocyte colony-forming units were assayed in serum-free cultures. BM cells (3 × 10⁵ cells per dish) were cultured on Iscove's modified Dulbecco's medium supplemented with 10 mg/mL bovine serum albumin, 3 μg/mL transferrin, 25 μg/mL soy bean lipids (all from Boehringer Mannheim, Mannheim, Germany), 45 μg/mL linoleic acid (Sigma, St Louis, MO), 7.8 μg/mL cholesterol (Sigma), 110 μg/mL sodium pyruvate (Sigma), 10-4 mol/L L-thioglycerol (Fluka, Buchs, Switzerland), 2 × 10⁻² mmol/L glutamine (Gibco), and 20% WEHI-3b conditioned medium. The pre-B colony-forming units were assayed by culturing 105 BM cells in methylcellulose culture medium supplemented with recombinant human IL-7 (Methocult M3630; StemCell Technologies, Vancouver, Canada) as described.28 In all instances, triplicates of each sample were seeded and incubated for 7 days at 37°C in 95% humidified atmosphere with 5% CO2 in air. Colonies were scored under a dissecting microscope, and, in the case of the megakaryocyte cultures, colonies were stained with acetylcholinesterase prior to scoring.29 The exogenous spleen colony forming-units were assayed as described previously.30 Briefly, groups of 10 C57Bl/6 mice were irradiated with a split dose of 9 Gy (2 doses of 4.5 Gy spaced 4 hours apart), using Philips MG 324 x-ray equipment (Philips, Hamburg, Germany) at 300 kV, 10 mA, and a dose rate of 1.03 Gy/min. Each recipient was injected with 5 × 10⁴cells through the lateral vein tail. Twelve days after transplantation, recipients were killed and their spleens removed and fixed in Telleyeniczky's solution. Spleen colonies were then determined using a dissecting microscope.
Cell proliferation assays
Cell suspensions were prepared from spleen, lymph node, or thymus and cultured in triplicate in the presence of plate-bound anti-CD3 antibody, staphylococcus enterotoxin B, CD40L, anti-IgM, or lipopolysaccharide (LPS) at various concentrations in culture medium for 3 days. Cells were pulsed with [3H]dT (1 μCi/well) 12 hours before harvesting onto glass fiber filters for determination of [3H]dT. For measurement of lymphocyte proliferation in vivo, mice were intraperitoneally injected with 0.6 mg bromodeoxyuridine (BrdU) in 100 μL PBS 18 hours before flow cytometry analysis of BrdU incorporation.31
51Cr release assay
Specific NK cell and cytotoxic T lymphocyte (CTL) activity was determined using a standard 51Cr release assay. Splenocyte suspensions were prepared and erythrocytes were lysed by NH4Cl treatment. Cr-labeled (100 μCi sodium chromate) YAC-1, NK-resistant (RMA), or NK-sensitive (RMA-S) target cells were plated with the appropriate effector cells at different ratios. NK cytotoxic activity was measured at 2.5 hours. In CTL experiments, splenocytes stimulated in vivo for 3-4 days by intraperitoneal injection of F5 peptide (18 nmol) in PBS were used as effector cells. RMA and RMA-S unsensitized and F5 peptide-sensitized by preincubation with 100 nmol NP 366-374 in 1 mL medium overnight at 26°C were used as targets cells. Cytotoxicity was measured after an incubation period of 4 hours. The percentage of specific lysis was calculated as (sample cpm − spontaneous cpm)/(maximal cpm − spontaneous cpm)] × 100.
Immunizations and enzyme-linked immunosorbant assay (ELISA)
Age- and sex-matched mice were immunized intraperitoneally with 10 μg of 2,4-dinitrophenyl (DNP)-keyhole limpet hemocyanin (DNP-KLH) in complete Freund's adjuvant (CFA) or in alum, or intravenously with DNP-KLH in PBS at day 0. Each mouse was boosted 7 days later using the same protocol. Blood was collected at days 6 and 14 after the first immunization. Other mice were immunized intraperitoneally with 10 μg LPS-TNP (Sigma) in PBS at day 0, and bled at day 0 and 14. NP-specific antibodies were measured by ELISA using DNP-ovalbumin-coated plates at 3 μg/mL. Previously tested horseradish peroxidase-labeled isotype-specific anti-mouse immunoglobulin antibodies (Southern Biotechnology Associates, Birmingham, AL) were used in these assays. Sera were diluted 1:200 and 1:2000 and immunoglobulin levels were analyzed.
Immunohistochemistry
Frozen spleen, lymph node, and Peyer's patch sections from DNP-KLH immunized CD69-deficient and wild-type mice (day 10 after immunization) were stained with the indicated biotinylated antibodies, followed by streptavidin-peroxidase. Sections were developed with diamino-benzidine and counterstained with Mayer's hematoxylin.
Results
Generation and characterization of lymphoid populations in CD69 (-/-) mice
The CD69-mouse genomic DNA consists of 5 exons and 4 introns and is approximately 9 kb in length.7 To disrupt CD69-gene expression by homologous recombination in ES cells, a targeting vector was constructed by replacing with the neomycin-resistance gene, a fragment of genomic DNA of 4 kb containing exons 2, 3, 4 and translated region of the exon 5 (Figure 1A). Two chimeric mice were obtained by morula aggregation, one of which successfully contributed to the germ line. Homozygous mice were obtained by interbreeding of heterozygous mice (Figure 1B). CD69 (-/-) mice appeared normal, with no apparent developmental defects. Mice were fertile and no obvious defects were appreciated in any organ analyzed after autopsy.
CD69 gene disruption by homologous recombination.
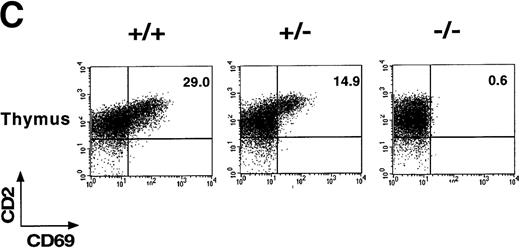
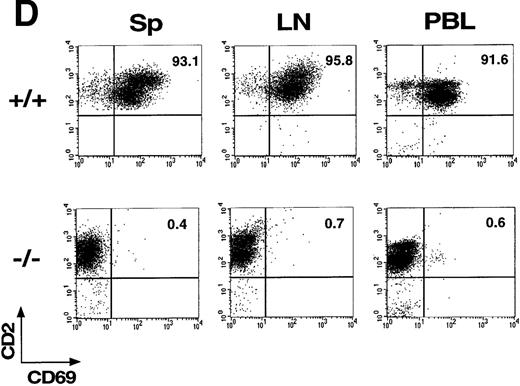
(A) Schematic representation of the partial restriction maps of the mouse genomic CD69 locus, the targeting construct, and the targeted allele. The exons of the wild-type CD69 gene are shown as solid bars, boundaries of homology between the wild-type gene and the targeting construct are denoted by thin lines. (B) Southern blot analysis of BamHI-digested tail DNA from wild-type (+/+) and heterozygous (+/−) or homozygous (-/-) CD69 mice were analyzed with a 2-kb HindIII-EcoRI fragment from the genomic Xba-EcoRI fragment mapping 5′of the targeting construct. The unmutated CD69 gene produced a 12-kb fragment, whereas the mutated allele results in a 9-kb fragment. (C) CD69 expression in wild-type, CD69 (+/−), and in CD69 (-/-) mice. Flow cytometry analysis of CD69 expression in thymus from wild type (+/+), heterozygous(+/−), or homozygous (-/-) CD69 mutant mice. (D) CD69 expression in spleen, lymph node, and peripheral blood lymphocytes from wild type (+/+) or CD69 (-/-) mutant mice. Cells were activated with PMA at 10 ng/mL for 15 hours. Cells were double-stained with anti-CD69 and anti-CD2 labeled monoclonal antibodies and analyzed by flow cytometry.
To demonstrate the lack of CD69 expression in CD69 (-/-) mice, thymocytes were stained with anti-CD69 mAb and CD2 as control and analyzed by flow cytometry. As expected, CD69 expression was absent in CD69 (-/-), while in wild-type CD69 (+/+) mice, approximately 29% of CD2+ thymocytes coexpressed CD69 (Figure 1C). Intermediate CD69 expression was found in heterozygous CD69 (+/−) mice (Figure1C). Moreover, spleen, lymph node, and peripheral blood T cells from CD69 (-/-) mice activated with PMA did not express CD69 (Figure 1D). All these results confirmed the inactivation of the CD69 gene and the inheritance of this trait at the expected Mendelian ratio.
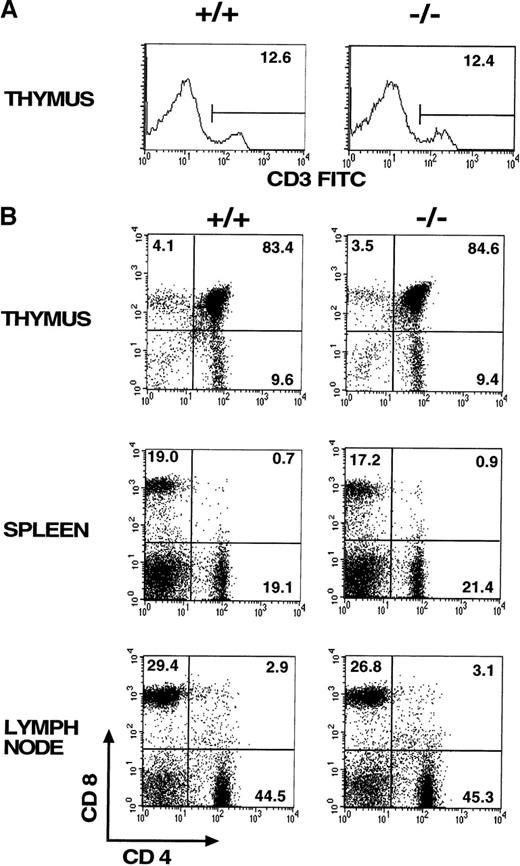
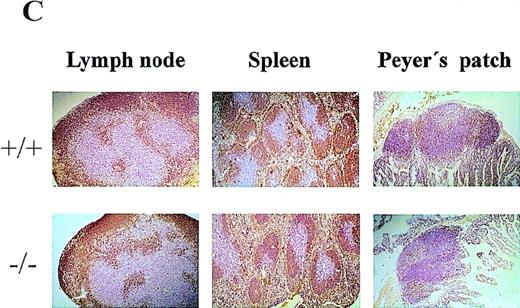
Comparison of CD69 (-/-) and CD69 (+/+) mice from the same litter showed no significant differences in the CD3+ lymphoid populations in thymus, spleen, and lymph nodes (Figure2A, and data not shown). Moreover, no differences were appreciated in the major T-cell subsets, as assessed by CD4 and CD8 expression (Figure 2B). Similar results were obtained using other cell markers such as CD2, CD5, CD25, and CD44 (data not shown). Mature and immature thymic subsets in CD69 (-/-) mice showed a normal pattern of development (Figure 2B). Proportions of mature TCRαβ and TCRγδ were similar in CD69 (-/-) and CD69 (+/+) mice (data not shown). Likewise, normal cell numbers and a normal T:B lymphocyte ratio were observed in the peripheral lymphoid organs of CD69 (-/-) deficient mice (Figure 2B). Lymphoid organs, including thymus, spleen, lymph nodes, and Peyer's patches from CD69 (-/-) mice, had a normal appearance by histological analysis (Figure 2C, and data not shown). No significant differences in other cell subsets from peripheral lymphoid organs were found, as determined with a panel of mAb specific for B cells (B220, IgM, IgG, CD43), granulocytes (Gr), and monocytes (CD11b, CD71, I-Ab, ICAM-I). Peritoneal exudate cells were also present in normal proportions in CD69 (-/-) mice (data not shown).
Lymphocyte subpopulation analysis in CD69 (-/-) and wild-type mice.
Cells from lymphoid organs were obtained from CD69 (-/-) mice and wild-type littermate controls, then immunofluorescently stained and analyzed using flow cytometry. (A, B) CD3 expression on thymocytes and CD4 and CD8 markers on thymocytes, splenocytes, and lymph node cells. Numbers indicate the percentage of lymphoid populations. Data from a single mouse are shown, they are representative of more than five mice per group and from more than one litter. (C) Immunochemical analysis of lymphoid organs from CD69 (-/-) mice. Frozen sections of lymph nodes and spleens from unimmunized mice were immunostained for immunoglobulin M. Peyer's patches obtained from mice 10 days after challenge by intraperitoneal injection of 10 μg of alum absorbed 2,4-dinitrophenyl-keyhole limpet hemocyanin mice were stained with anti-CD5.
Hematopoiesis in CD69 (-/-) mice: altered pre-B immature cells
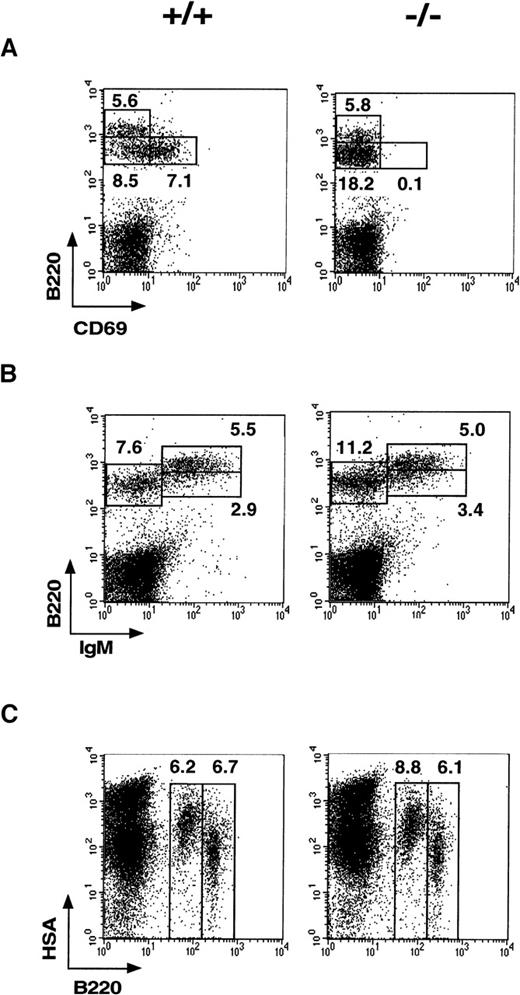
Analysis of CD69 expression in normal BM revealed its presence in the B220+ pre-B cells (Figure3A). Interestingly, CD69 was expressed with high intensity on 20%-30% of B220+ pre-B cells; it was, therefore, of interest to analyze B cells at different maturation stages within CD69 (-/-) mouse BM. Increased percentages of pre-B (B220+int, IgMneg) and immature B (B220+int, IgM+) cells were consistently detected in CD69 (-/-) mice compared with wild-type mice. The pre-B cell compartment, defined as B220+int IgMneg, was the most affected, whereas B220+int IgM+pre-B and immature B cells were only moderately augmented (Figure 3B). The overall increase in the B220+int IgMneglymphoid cell subset was statistically significant. The relative change mean for this subset was 1.523 (P < .01; Student ttest, sample size = 20). The detection of another pre-B cell marker (the Heat Stable Antigen, HSA) confirmed the difference in this B-cell subset between wild-type and CD69-deficient mice (Figure 3C). These differences correlate with a slight lymphocytosis in CD69 (-/-) mice (1.35 relative change mean, P < .01). In contrast, the mature B-cell compartment (B220bright IgM+) was not significantly altered. Analysis of pro-B cells defined by CD43, BP-1, and HSA markers revealed no alteration in CD69 (-/-) mice (data not shown). Our results, therefore, show that CD69 is constitutively expressed on B-cell precursors and appears to play a role in cell maturation. To further analyze the effect of the disruption of CD69 gene in B-cell development, clonogenic assays with BM cells from CD69 (-/-) and wild-type mice were performed, but no significant differences were found (Table 1).
Phenotypic analysis of B-cell precursors in CD69 (-/-) and wild-type bone marrow.
(A-C) Two-color immunofluorescence analysis with anti-B220 and anti-CD69 monoclonal antibody shows that B220+CD69+ cells are enriched in the B220int lymphocyte fraction. In CD69 (-/-) mice, the increase in IgM−B220+ and HSA+B220+ cell subsets is also shown.
Comparative analysis of the hematopoietic progenitors present in femoral bone marrow of CD69 (−/−) and wild-type mice
| . | Cells per Femoral BM (×106) . | CFU-GM . | CFU-Meg . | CFU-Pre-B . | CFU-S12 . |
|---|---|---|---|---|---|
| Wild-type mice | 15.56 ± 1.00 | 108 ± 6 | 2.50 ± 0.47 | 29.00 ± 5.95 | 13.00 ± 1.50 |
| CD69 (−/−) mice | 16.88 ± 1.51 | 108 ± 5 | 3.50 ± 0.76 | 20.04 ± 4.26 | 15.00 ± 1.10 |
| . | Cells per Femoral BM (×106) . | CFU-GM . | CFU-Meg . | CFU-Pre-B . | CFU-S12 . |
|---|---|---|---|---|---|
| Wild-type mice | 15.56 ± 1.00 | 108 ± 6 | 2.50 ± 0.47 | 29.00 ± 5.95 | 13.00 ± 1.50 |
| CD69 (−/−) mice | 16.88 ± 1.51 | 108 ± 5 | 3.50 ± 0.76 | 20.04 ± 4.26 | 15.00 ± 1.10 |
Number of colonies per 105 bone marrow (BM) cells. Samples from a total of 14 mice per group were individually analyzed. The mean ± standard error corresponding to each group is shown. CFU-GM = granulocyte/macrophage colon-forming units; CFU-Meg = megakaryocyte colony-forming units; CFU-Pre-B = pre-B colony-forming units; CFU-S12 = exogenous spleen colony forming-units.
The expression of CD69 has been described on BM myeloid precursors.10 In CD69 (-/-) mice, erythroid and myeloid precursors were normal, according to both their number and specific surface markers (Table 1, and data not shown). Clonogenic assays with BM cells of myeloid progenitors showed no significant differences in the values of granulocyte/macrophage and megakaryocyte colony-forming units obtained between CD69 (-/-) and wild-type mice. Similarly, no differences were found in analyses of a more primitive and multipotential precursor by exogenous spleen colony-forming unit assays (Table 1). Hematologic analyses demonstrated that the cellular components of peripheral blood were normal in number and distribution (data not shown). In addition, although CD69 is expressed in a constitutive manner in normal platelets, platelet numbers were similar in the CD69 (-/-) and wild-type mice. Finally, analyses of different serum biochemical parameters in CD69 (-/-) mice showed no abnormality in the protein, lipid, and enzyme content studied (data not shown).
Positive and negative selection of thymocytes
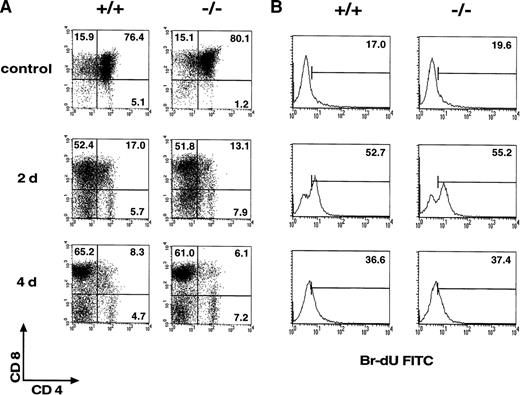
The definition of thymocyte subsets is currently based on the detection of different molecules (TCR, CD4, CD8), including CD69. CD69 is absent in double-positive TCRneg/lo cells and is not expressed in TCRα-deficient mice and in major histocompatibility complex Class I and Class II double-deficient mice.32 CD4loCD8lo and CD4loCD8+ TCRint cells express CD69. Therefore, CD69 expression is induced just after the initiation of TCRαβ positive selection in thymocytes, when these cells are signaled via their TCR.13 33 To study the role of CD69 in thymocyte selection, CD69 (-/-) TCR F5 transgenic mice were generated. The F5 receptor is specific for influenza virus A/NT/60/68 nucleoprotein NP366–379 and utilizes the Vα4 and Vβ11 TCR gene segments. CD8+T cells expressing F5 are positively selected in TCR transgenic H-2Db wild-type mice. The process of positive selection into the CD8 compartment was not altered in F5 TCR CD69 (-/-) mice (Figure 4A). Both F5 TCR CD69 (-/-) and F5 TCR wild-type mice thus have a high CD8:CD4 cell ratio. Accordingly, the thymocyte expression of transgenic Vβ11 chain by T cells was high in both mice (not shown).
Analysis of thymic selection and in vivo proliferation of mature T cells in CD69 (-/-) F5 T-cell receptor (TCR) transgenic mice.
(A) Two-color flow cytometry analysis was performed in thymocytes of F5 TCR transgenic mice untreated or after the administration of NP366–374 as described in Materials and methods section. (B) The proliferative capability of mature T cells in CD69 (-/-) mice was analyzed in vivo after bromodeoxyuridine (BrdU) treatment as in the Materials and methods section. Numbers indicate the percentage of positive, BrdU-incorporating lymph node cells. Data shown are representative of results obtained in three mice per group and from more than one litter.
Negative selection was induced in F5-TCR transgenic mice by intraperitoneal injection of the antigenic peptide of the influenza nucleoprotein (NP) 366-374.26 This negative selection was reflected in a threefold reduction of thymus cellularity, a decrease in double-positive thymocytes, a depletion of Vβ11-bearing T cells, and an apparent increase in CD4-CD8- thymocytes detected at 2 or 4 days after peptide administration. A similar pattern of expression of CD4, CD8, Vβ11, and CD25 was observed in both F5 TCR CD69 (-/-) and F5 TCR CD69 (+/+) mice (Figure 4A, and data not shown). Positive and negative selection of thymocytes were, therefore, unaltered by CD69 deficiency.
Lymphocyte proliferative responses
To explore the possible involvement of CD69 in B- and T-cell functions, we first determined the proliferative response of thymus, spleen, and lymph node cells from CD69 (-/-) mice to different stimuli. Cells from CD69-deficient mice displayed proliferative responses to T-cell-specific stimuli, such as anti-CD3, Con-A, and staphylococcus enterotoxin B, similar to those of cells from wild-type mice (Table2). In addition, lymph node and spleen cells from CD69 (-/-) mice showed a normal response to B-cell stimuli, such as LPS and CD40L+ IL-4 (Table 2 and data not shown). These results indicated that CD69 is not necessary for the proliferation of lymphocytes induced by different stimuli.
In vitro proliferative response
| Stimuli . | Thymus . | Spleen . | Lymph Node . |
|---|---|---|---|
| — | |||
| WT | 244 ± 20 | 16 062 ± 1117 | 2483 ± 196 |
| CD69 (−/−) | 141 ± 20 | 17 566 ± 892 | 1886 ± 349 |
| ConA | |||
| WT | 6635 ± 714 | 51 101 ± 1684 | 27 170 ± 2532 |
| CD69 (−/−) | 6181 ± 920 | 48 351 ± 699 | 25 802 ± 2532 |
| α-CD3 | |||
| WT | 5252 ± 1702 | 117 254 ± 15 912 | 71 121 ± 16 090 |
| CD69 (−/−) | 5516 ± 497 | 95 288 ± 19 426 | 54 115 ± 7342 |
| SEB | |||
| WT | 1007 ± 237 | 92 218 ± 4051 | 65 274 ± 5013 |
| CD69 (−/−) | 692 ± 84 | 110 317 ± 27 564 | 40 262 ± 5636 |
| LPS | |||
| WT | 3196 ± 116 | 61 186 ± 3783 | 118 482 ± 5326 |
| CD69 (−/−) | 1631 ± 203 | 70 372 ± 5650 | 79 867 ± 10 036 |
Mononuclear cells obtained from thymus, spleen, and lymph nodes from CD69 (−/−) mice and control littermates were stimulated in a proliferation assay. The results shown are the mean of triplicate cultures and are representative of six separate experiments. LPS = lipopolysaccharide; SEB = staphylococcus enterotoxin B; WT = wild type.
To assess the in vivo role of CD69 in T-cell proliferation, lymph node and spleen transgenic CD8+ T-cell expansion was studied in TCR F5 transgenic CD69 (-/-) mice by BrdU incorporation. It has been described that exposure of mice transgenic for a F5 TCR to NP366–374peptide results in expansion and activation of peripheral Vβ11-bearing CD8 T cells.26 Both F5 TCR CD69 (-/-) and F5 TCR wild-type mice showed a comparable high rate of peripheral CD8 T-cell proliferation (Figure 4B, and data not shown). These results showed that T cells are able to proliferate in vivo in response to a specific antigen in the absence of CD69. T-cell cytokine production was analyzed by intracytoplasmic staining of PMA-activated Th1-derived spleen cells. A comparable cytokine synthesis profile was observed in cells from CD69 (-/-) and wild-type mice (data not shown).
Cytolytic activity in CD69 (-/-) mice
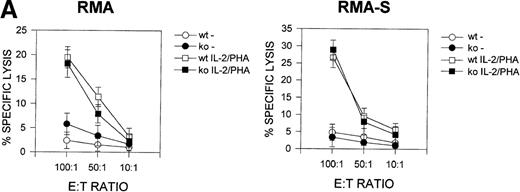
Previous studies33 suggested that CD69 may be involved in the regulation of cytolytic activity in NK and Tγδ lymphoid cells. We, therefore, analyzed the cytolytic activity of CD69 (-/-) lymphocytes against NK-sensitive and NK-resistant target cells. The number and phenotype of splenic NK and CD8+ cytotoxic cells were found to be similar in both CD69 (-/-) and wild-type mice (data not shown). We assayed two different effector cells, spleen cells cultured in the presence of phytohemagglutinin plus IL-2, and unstimulated spleen cells. CD69 (+/+) and CD69 (-/-) splenocytes displayed similar cytolytic activity against RMA-S or RMA syngeneic target cells (Figure 5A).
Cytotoxic T lymphocyte activity in CD69 (-/-) mice.
(A) Natural killer (NK) cytotoxity against NK-resistant and NK-sensitive cells using unfractionated spleen cells. Cytotoxic activity was assayed in the presence or absence of phytohemagglutinin (PHA) plus IL-2. Specific lysis is shown for three mice per group, representative of five experiments. (B) Nucleoprotein (NP) peptide-specific cytotoxic response of spleen cells from F5 CD69 (+/+) and F5 CD69 (-/-) mice, treated with influenza virus nucleoprotein peptide as in Materials and methods section. Cells were assayed in the presence or absence of the NP366–374. Results shown are the average of three mice per group, representative of three experiments.
Because a major CD8 T-cell subset differentiates in F5 TCR transgenic lymphocytes on the C57BL/6 (H-2b haplotype) genetic background, we compared the lytic activity of in vivo activated CTL from CD69 (-/-) and CD69 (+/+) F5 TCR mice against RMA-S and RMA cells loaded with NP peptide. We found no differences in peptide-specific lysis mediated by splenocytes from either type of mice when the lytic assay was performed using an optimal concentration peptide loading (100 μmol/L) (Figure 5B).
Antibody responses
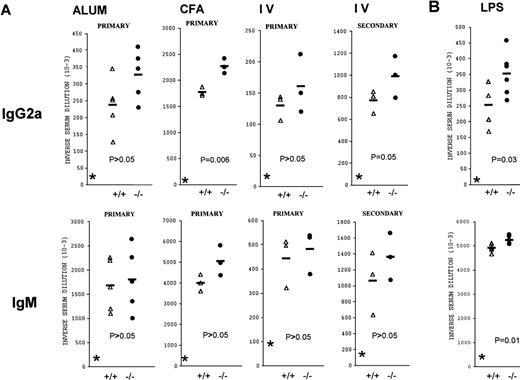
The possible role of CD69 in adaptive B-cell responses was analyzed. Different immunization protocols were used to evaluate the humoral immune response of CD69-deficient mice against thymus-dependent (TD) and -independent antigens. For TD B-cell responses, age- and sex-matched CD69 (+/+) and CD69 (-/-) mice of the same progeny were divided into groups receiving 10 μg of DNP-KLH in PBS intravenously, or adsorbed to alum or mixed with CFA intraperitoneally. Basal immunoglobulin concentrations were in the same range in all mice tested prior to immunization (Figure 6). CD69-deficient mice were able to mount DNP-specific primary and secondary responses of all immunoglobulin isotypes. The magnitude of IgG1, IgG2b, and IgG3 antibody responses was similar in the wild-type and CD69 (-/-) mice. A slight increase in the IgG2a primary response was observed in CD69 (-/-) mice, regardless of the immunization protocol used (Figure 6A). IgG2a anti-DNP antibodies were also slightly increased in secondary responses when immunization was intravenous. Moreover, a slightly enhanced IgM response was observed in immunized CD69 (-/-) mice, but the differences in antibody titers were not statistically significant between CD69 (-/-) and CD69 (+/+) mice. Nevertheless, CD69-deficient mice produced specific antibodies to the DNP-LPS thymus-independent antigen at a similar level to that of wild-type mice (Figure 6B). As was found for TD antigens, immunized CD69 (-/-) mice produced slightly more anti-DNP-LPS IgM and IgG2a than wild-type mice.
Specific antibody responses in CD69 (-/-) mice.
Several immunization protocols were used to assess the immunoglobulin responses in CD69-deficient mice. The responses of individual mutant (filled circles) and wild-type (open triangles) mice are shown. (A) T-cell-dependent B-cell response. Results shown are from different groups: (IV), immunized with 2,4-dinitrophenyl (DNP)-keyhole limpet hemocyanin (DNP-KLH) in phosphate-buffered saline (PBS), (ALUM) immunized intraperitoneally with DNP-KLH adsorbed to alum, and complete Freund's adjuvant (CFA) immunized intraperitoneally with DNP-KLH mixed with CFA. CD69 (-/-) mice immunized with DNP-KLH mixed with CFA and DNP-KLH in phosphate-buffered saline produce augmented amounts of immunoglobulin (Ig) G2a (P ≤ 0.05, two-way analysis of variance). (B) T-cell-independent B-cell response. DNP-LPS CD69 (-/-) mice produce increased amounts of IgM (top panel) and IgG2a (bottom panel) antibodies after immunization. IgM and IgG2a anti-DNP titers differed significantly (P < .05) between the two groups (+/+ and -/-) by two-way analysis of variance. Other DNP-specific antibody isotypes were at similar levels in CD69 (-/-) and wild-type mice (not shown).
It has been postulated that CD69 plays a role in T-B cell collaboration, as it is highly expressed by germinal center CD4 T cells12; we, therefore, performed immunohistochemical stainings of spleen and lymph node sections after DNP-KLH immunization. We found that mAb specific for IgM, B220, CD3, and CD5 exhibited a similar staining pattern in lymph node sections from CD69 (-/-) and CD69 (+/+) mice. T- and B-cell areas and germinal centers were clearly appreciated in immunized lymph nodes from both types of mice (Figure2C, and data not shown). In addition, no differences were observed in T cells located in the periphery of lymphoid follicles and B cells within the follicles. Likewise, no significant differences were detected in spleen sections, Peyer's patches, and intraepithelial lymphocytes from CD69 (-/-) and CD69 (+/+) immunized mice (Figure 2C, and data not shown).
Discussion
The pattern of expression of CD69 as well as its putative role as a signal transducing receptor on leukocytes points to an important role for CD69 in the biology of these cells. In addition, CD69 expression during thymocyte and B-cell development, as well as during activation of mature lymphocytes, strongly suggests its involvement in the differentiation and proliferation of these cells.3 4 We explored the physiological role of CD69 in vivo and studied the phenotypic and functional characteristics of lymphocyte development in CD69 (-/-) mice. T-lymphocyte ontogeny was apparently normal, whereas a subtle alteration in B-cell development was detected. CD69 is constitutively expressed by a significant percentage of B-cell precursors in normal BM, and the pre-B-cell subset was significantly augmented in CD69-deficient mice. Furthermore, CD69 (-/-) mice exhibited a slight but significant increase in the humoral immune response against a TD antigen. No additional alterations were found in any other cell compartments or functions studied, including NK and T cells, macrophages, granulocytes, and platelets.
It has been described that CD69 is detected on activated B cells.12 The CD69 expression by BM B-cell precursors at the B220+ pre-B-cell stage found by us is thus probably a consequence of the cell activation process that occurs during B-lymphocyte development. CD69 could be involved in the positive selection of B cells in BM, paralleling what it is thought to occur during T-cell development.32,34 It has been described that surface immunoglobulin crosslinking on mature B cells induces CD69 expression. It is feasible that in pre-B cells, which do not bear surface immunoglobulins, different activatory stimuli such as cytokines are able to induce CD69 expression. In addition, the possibility of CD69 expression induction on pre-B cells by the interaction of a pre-B-cell receptor with its putative ligand cannot be ruled out. Interestingly, CD69 (-/-) mice showed a significant increase in the number of pre-B and immature B cells compared with CD69 (+/+) wild-type mice. These data support a regulatory role for CD69 in B-cell differentiation. It is feasible that CD69 acts as a signal transducing molecule in pre-B cells, with a role in the induction of differentiation of these cells. Under such circumstances, the absence of CD69 may be responsible for slow pre-B-lymphocyte differentiation, with accumulation (and increase in the number) of cells at this differentiation stage. An alternative, but not exclusive, possibility is that CD69 is involved in the induction of apoptosis associated with pre-B-cell activation (activation-induced cell death). In this case, the absence of CD69 would be responsible for the augmented number of pre-B cells in CD69 (-/-) mice due to defective deletion of these cells. This possibility is supported by a report on the association between CD69 expression and programmed cell death in thymocytes.16 Another possibility is that CD69 might act in pre-B cells as an inhibitory membrane receptor, generating negative regulatory signals that would constrain cell proliferation. Although all available information on CD69 strongly suggests that this molecule acts as a costimulatory receptor with an important role in lymphocyte activation and proliferation (reviewed in Sánchez-Madrid3 and Testi et al4), we think it is possible that CD69 may exert an inhibitory effect in some cells. In this regard, the CD94-NKG2 lectin-like receptors, which exhibit some degree of homology with CD69, are inhibitory/triggering molecules in NK cells.35 CD94-NKG2A is thus an inhibitory receptor coupled to SHP tyrosine phosphatases, whereas CD94-NKG2C forms a triggering complex in these cells. Nevertheless, other membrane receptors, such as those for IL-10 and transforming growth factor β, exert stimulatory and inhibitory effects on different leukocyte subsets.36-39
Other inhibitory/stimulatory coreceptors have been described on lymphoid cells, such as the killer inhibitory receptors that are expressed, aside from NK cells, by some T lymphocytes, in which they regulate TCR-dependent functions.40 Finally, the CD81 tetraspanin regulates lymphocyte functions, acting as positive or negative mediator of lymphocyte proliferation depending on the type of stimulus and modulating the immunoglobulin isotype balance.41 It is thus feasible that CD69 exerts an inhibitory effect on certain cell types at specific differentiation stages. In addition, the absence of CD69 could lower the signal threshold necessary for the effect of receptors involved in negative signaling on B-cell activation/proliferation such as CD22 and FcγRII.42,43 It is, therefore, conceivable that CD69 acts in pre-B cells by modulating the signaling function of other membrane receptors involved in cell activation. In this regard, CD22 is described as both a positive and negative modulator of B-cell antigen receptor complex signal transduction in mature and immature B cells.42
The lack of effect of CD69 deficiency on T-cell function is of interest. CD69 has been also termed “Activation Inducer Molecule” and is expressed on leukocytes during and after their activation.2-4 CD69 expression can be induced in vitro on lymphocytes by several stimuli, including anti-CD3 and anti-CD2 mAb, PMA, and phytohemagglutinin. The functional characteristics and molecular structure of CD69, a type 2 C-type lectin with a carbohydrate recognition domain in the C-terminal region,6,7 as well as its expression pattern, suggest its involvement in cell activation. Different data support the role of this molecule as a signal transducing receptor in leukocytes. Although the putative ligands for CD69 have not been characterized yet, it has thus been found that the engagement of CD69 with mAbs induces an increase in intracellular Ca++, as well as cytokine synthesis and expression of proto-oncogenes. When the effect of CD69 engagement is combined with a PKC activator, lymphocyte activation proceeds to DNA synthesis and cell proliferation is observed.2 22 We, therefore, expected to detect abnormalities in T-cell activation or development in CD69-deficient mice. Despite CD69 expressed during thymocyte differentiation in normal mice, no significant changes were observed in T-lymphocyte development in CD69 (-/-) mice. The number and phenotypic characteristics of T cells in different lymphoid tissues were normal, and the positive and negative selection of thymocytes was unaffected in the absence of CD69. T cells from CD69 (-/-) mice also showed normal proliferative capability and were able to provide apparently adequate help in antibody-specific responses. Furthermore, we have detected no alterations in the activation-induced cell death of T lymphocytes triggered by anti-CD3 mAb in CD69 (-/-) mice (Lauzurica et al, unpublished observations). These findings suggest that the function of CD69 in T cells is not essential or that it may be replaced by other molecules. It is also possible, however, that subtle defects in T-cell function may occur in CD69-deficient mice and that the assays employed in this study were not able to detect them.
There are several possibilities to explain the slight but significant increase in the humoral immune response against TD antigens observed in CD69 (-/-) mice. Immunoglobulin synthesis by B cells is under the control of different mechanisms, including those exerted by regulatory T cells. It is feasible that the absence of CD69 has subtle consequences on the immunoregulatory activities of T lymphocytes and that the increased synthesis of certain isotypes observed in CD69-deficient mice is related to defective modulation of B-cell function. Another possibility is that, as stated above, CD69 may exert a direct modulatory/inhibitory activity on certain cell subsets, including mature antibody-producing B lymphocytes. In this case, the absence of CD69 expression by antibody-producing cells may have as consequence a disregulation in isotype-specific immunoglobulin synthesis. Since only one ES cell line was used to generate the CD69 (-/-) mice, it is feasible, but highly unlikely, that the phenotype differences might be due to a defect in the ES cells at a locus linked to but different from CD69. Further studies are necessary to elucidate the precise mechanism of enhanced antibody production in CD69-deficient mice.
Although CD69 is expressed by platelets, myeloid precursors, activated neutrophils, and eosinophils, we found no abnormalities in these cells in CD69 (-/-) mice. Different mechanisms may account for these results, including (i) the activities previously reported for CD69 in these cells in vitro may not occur in vivo; (ii) because most CD69 functions have been defined in human cells, it is possible that mouse CD69 may not exert the same functions in different cells; and (iii) as stated above, CD69 function may be replaced by other molecules in CD69 (-/-) mice. The cloning has recently been reported of AICL, a gene with a highly similar sequence to that of CD69, although its cellular and tissue distribution at the protein level has not been described yet.44 In addition, other yet uncharacterized molecules from the C-lectin NK cell complex may also participate, as well as different costimulatory molecules that have been extensively studied such as CD28.
In conclusion, CD69 is expressed by both B-cell precursors and activated B cells and seems to exert a subtle modulatory effect on B-cell development and antibody synthesis. This study also indicates that CD69 is not essential for TD T-lymphocyte development and cell proliferation. Nonetheless, subtle defects in some regulatory function of T cells cannot be ruled out. Functional redundancy of costimulatory molecules may account for the lack of gross abnormalities in the differentiation and activation of T cells in the absence of CD69. Because our CD69-deficient mouse line has been maintained in pathogen-free conditions, it is not known whether or not these mice exhibit increased susceptibility to some infectious agents; experiments to address this question are in progress. Other mouse lines deficient in immune response-related molecules (eg, IL-10, CCR-1, MIP-1α) are also apparently normal, but important abnormalities emerge when they are challenged with different pathological agents. Finally, the possible role of CD69 deficiency in autoimmune diseases deserves further research.
Acknowledgments
We thank Dr Kioussis for the gift of the F5 transgenic mice, and C. Mark for editorial assistance. We are very grateful to Dr Roberto González-Amaro for the excellent critical review. Lucio Gómez and Juan Caballero were very helpful in their technical assistance.
Supported by grant No. SAF 99/0034-C01-C02 from the Ministerio de Educacion y Cultura, and grant 08/001/1997 (to FS-M) from the Comunidad Autónoma de Madrid. The Department of Immunology and Oncology was founded and is supported by the Spanish Research Council (CSIC), Pharmacia, and Upjohn.
Reprints:Francisco Sánchez-Madrid, Servicio de Immunologı́a, Hospital de la Princesa, C/ Diego de León 62. Madrid 28006, Spain; e-mail: smadrid/princesa@hup.es.
The publication costs of this article were defrayed in part by page charge payment. Therefore, and solely to indicate this fact, this article is hereby marked “advertisement” in accordance with 18 U.S.C. section 1734.



This feature is available to Subscribers Only
Sign In or Create an Account Close Modal