Abstract
In the current study, we investigated whether the growth of FasL-bearing tumor cells would induce apoptosis and toxicity in organs that express high level of Fas. Sera from C57BL/6 +/+(wild-type) mice injected with syngeneic FasL+ tumors, LSA, or EL-4, showed significantly higher levels of soluble FasL than that from the nontumor-bearing mice. Furthermore, the soluble FasL was functional inasmuch as the sera from tumor-bearing mice were able to induce apoptosis in Fas+ but not Fas−targets. Histopathologic studies and in situ TUNEL assay to detect apoptosis were carried out in C57BL/6 +/+(Fas+) or C57BL/6 lpr/lpr (Fas−) mice injected with syngeneic LSA and EL-4 tumor cells. The morphology of the liver and thymus from tumor bearing C57BL/6 +/+ mice showed marked damage and tissue destruction. In contrast, the liver and thymus from tumor-bearing C57BL/6 lpr/lpr mice showed minimal damage. Furthermore, the tumor-bearing C57BL/6 +/+, but not the C57BL/6 lpr/lpr, mice exhibited significant apoptosis in the liver and thymus. The FasL responsible for toxicity was tumor derived rather than host derived; tumor-bearing C57BL/6 gld/gld(FasL-defective) mice also exhibited significant apoptosis in the liver and thymus. Together, these data suggested that the in vivo growth of FasL-bearing tumor cells can induce significant apoptosis and toxicity in Fas+ tissues of the host. Such toxicity may be mediated by the soluble FasL produced by tumor cells.
FasL is a 40-kd type 2 transmembrane protein belonging to the tumor necrosis factor (TNF) family.1,2 The ligation of Fas, a cell-surface protein belonging to the TNF receptor family, transduces an apoptotic signal leading to cell death.1 FasL is abundantly expressed in the testis and, to a lesser extent, in the spleen, thymus, lung, and small intestine.3 Fas is expressed at high levels in the thymus, lung, heart, and liver and at lower concentrations in the spleen, lymph nodes, and small intestine. Recent studies have suggested that several tumor cell lines constitutively express Fas ligand, including the colon carcinomas,4 melanomas,5 hepatocellular carcinomas,6 and astrocytoma.7 Such studies have suggest that FasL may be used by the tumor cells to evade the actions of the immune system.8
Previous studies from our laboratory demonstrated that a FasL-expressing tumor cell line killed the tumor-specific cytotoxic T lymphocytes (CTL) that expressed Fas.9 These data suggested that FasL-bearing tumor cells may use FasL as a mechanism of immune evasion. Furthermore, this observation may explain why adoptive transfer of tumor-specific T cells into tumor-bearing mice fails to cure a high percentage of the mice.10 11
Despite the above studies, it is unclear whether the growth of FasL-bearing tumor cells would induce toxicity in the organs that express high levels of Fas. It is known that FasL is expressed in both membrane-bound and soluble forms. Matrix metalloproteinase cleaves the membrane-bound FasL to produce the soluble form.12 The soluble form of FasL is less cytotoxic than the membrane-bound form.13 However, increased levels of soluble FasL have been described in a number of clinical situations, and soluble FasL has been shown to cause apoptosis and toxicity in the host.14-16 We reasoned that at the peak of tumor growth in the host, there may be sufficient soluble form of FasL produced by the tumor cells that may cause immunotoxicity. The current study demonstrates that the growth of FasL-bearing tumor cells induced apoptosis in the thymus and liver of wild-type mice but not of Fas-deficient lpr mice. Furthermore, the sera of tumor-bearing mice exhibited significant levels of the functional FasL. These data demonstrated that the toxicity seen in some patients with cancer may result from the FasL produced by the tumors.
Materials and methods
Mice
Adult female C57BL/6 +/+ (wild-type) mice were purchased from Jackson Laboratories (Bar Harbor, ME) and maintained in our animal facility. C57BL/6 (lpr/lpr) and C57BL/6 (gld/gld) mice were bred in our animal facilities as described.17 All strains of mice were used at 4 weeks of age.
Tumor cell lines
T-cell lymphoma lines EL-4 and LSA are both syngeneic to the C57BL/6 strain and express high levels of FasL.9 L1210 Fas+ and Fas− cell lines represent murine lymphoma lines derived from DBA/2 mice transfected with sense and antisense of Fas cDNA, respectively.18 The tumor cells were passaged in vivo or grown in culture in RPMI (Gibco, Grand Island, NY) supplemented with 2 mmol/L glutamine, 40 μg/mL gentamicin, 50 μmol 2-mercaptoethanol, 10 mmol/L HEPES, and 10% fetal bovine serum (Summit Biological, Forth Collins, CO). The cells were grown at a concentration of 2 × 10⁵ cells/mL medium. To detect soluble FasL, 1 million tumor or T cells were cultured in 96-well plates in vitro, and supernatants from the cultures were collected after 24 hours. The supernatant was centrifuged to remove any cells or damaged cell membrane.
Injection of tumor cells into mice
LSA or EL-4 tumor cells (1 × 10⁶) were injected into 4-week old C57BL/6 (+/+) or C57BL/6 (lpr/lpr) or C57BL/6 (gld/gld) in 100 μL phosphate-buffered saline (PBS) intraperitoneally. Mice injected with PBS served as a control. Each group consisted of 5 mice. On day 7 (for LSA) or 10 (for EL-4) after tumor growth, the mice were killed and serum was collected for the detection of soluble FasL. In addition, thymus and liver from these mice were removed and fixed in 10% of neutral formalin solution.
Antibodies
Monoclonal (clone, Kay-10, mouse IgG2a) and polyclonal anti-FasL (Ab-1) were purchased from Pharmingen (San Diego, CA) and Oncogene (Cambridge, MA), respectively. Alkaline phosphatase-conjugated anti-rabbit IgG was obtained from Jackson Immunoresearch (West Grove, PA). The synthetic FasL peptide was purchased from Oncogene.
Detection of Fas ligand expression from in vivo grown tumor cells
One million LSA or EL-4 tumor cells were injected into C57BL/6 mice intraperitoneally. On day 7, tumor cells (20 × 106) were removed and lysed with Trizol (Gibco) solution to extract total RNA. cDNA was synthesized from 2 μg RNA using Moloney murine leukemia virus reverse transcriptase (RT; Amersham, Arlington Heights, IL). The primers used for polymerase chain reaction (PCR) amplifications were as follows: FasL sense primer 5′-CGGTGGTATTTTTCATGGTTCTGG-3′ and FasL antisense primer 5′CTTGTGGTTTAGGGGCTGGTTGTT-3′; β-actin sense primer 5′-ATCCTGACCCTGAACTACCCCATT-3′ and antisense primer 5′-GCACTGTAGTTTCTCTTCGACACGA-3′. The amplification conditions were 2 minutes at 94°C for initial denaturation; 40 cycles at 94°C for 45 seconds, 57°C for 45 seconds, and 72°C for 2 minutes; and 1 cycle at 72°C for 10 minutes. The PCR products were visualized in 1.5% agarose gel after they were stained with ethidium bromide.
Flow cytometric analysis of FasL
To detect FasL on the membrane, 1 million LSA or EL-4 tumor cells grown in the peritoneal cavity of mice were incubated with 5% normal rat serum on ice for 30 minutes to block Fc receptors. After 2 washes, cells were incubated with 1 μg/sample of primary anti-FasL antibody (Kay-10) biotinylated polyclonal antimouse IgG followed by streptavidin–phycoerythrin (PE; Pharmingen). All steps included 30-minute incubation on ice and 2 × washing with PBS. The positive signals were analyzed using a flow cytometer.
Transfection of COS-1 cells with mouse FasL cDNA
Full-length mouse FasL cDNA was isolated from activated PE-9 CTL.9 COS-1 cells were transfected with pcDNA3.1 plasmid containing mouse Fas ligand cDNA using DMRIE-C reagent (Gibco), according to the manufacturer's protocol. Briefly, 2 × 10⁶ COS cells were transfected with 5 μg pcDNA3.1 plasmid containing mouse Fas ligand cDNA or plasmid alone as control, and the cells were cultured in the presence of 500 μg/mL G418 (Gibco). Selections were continued for 2 months to establish stable transfectants. The expression of Fas ligand by COS-1 cells was confirmed using RT-PCR and flow cytometer, as described above.
Purification of soluble Fas ligand
COS-1 cells transfected with mouse FasL cDNA, as described above, were cultured for 48 hours. The soluble FasL found in supernatants was purified using cyanogen-bromide activated Sepharose column (Pharmacia, NJ). One microliter column was coupled with 5 mg Fas-Fc fusion protein (the Fas-Fc expression vector was kindly provided by Dr S. Nagata, Osaka University Medical School, Osaka, Japan) overnight at 4°C. The supernatant containing FasL from COS-1 transfectant was passed through the column, and bound FasL was eluted with 0.1 mol/L citric acid, pH 3, in 500 μL total volume of 30 centrifuge tubes. The products were neutralized with 100 μL 1 mol/L Tris-HCl (pH 9), and protein concentration of the elutes was measured using Bradford assay (Bio-Rad, Hercules, CA). The specificity of the soluble FasL was tested with binding assay using Kay-10 antimouse FasL antibody (Pharmingen, San Diego, CA) or Ab-1, polyclonal anti-FasL antibody (Oncogene, Cambridge, MA). The purity of the protein was confirmed by SDS-PAGE. The purified soluble mouse Fas ligand was used as a standard for the double-sandwich enzyme-linked immunoabsorbent assay (ELISA) to quantify the FasL found in the sera of tumor-bearing mice and the culture supernatants of tumor cells.
Detection of soluble FasL
To detect the soluble form of FasL, we used double-sandwich ELISA developed in our laboratory. ELISA plates were coated with 5 μg/mL Kay-10 anti-FasL mAb in 100 μL volume (Pharmingen) overnight at 4°C, and nonspecific-binding was blocked with 200 μL 5% dry milk. Freshly collected mouse sera (50 μL) or 100 μL supernatant from in vitro culture of tumor cells or COS cells was added to the wells. After 4-hour incubation at room temperature, plates were washed with PBS and incubated with 1 μg/mL polyclonal antimouse FasL (Ab-1) in 100 μl volume for 2 hours at room temperature. This was followed by 1-hour incubation with 1 μg/mL alkaline phosphatase-conjugated antirabbit antibody (Jackson Immunoresearch) and p-nitrophenol, and absorbency was measured at 410 nm. As a positive control, we used culture supernatant from COS-1 cells transfected with Fas ligand cDNA. As a negative control, culture supernatants from COS-1 cells transfected with the control plasmid were used. To determine the concentration of FasL found in the serum or in culture supernatants, purified soluble FasL was used as a standard.
Detection of apoptosis
One million thymocytes from C57BL/6 +/+ (Fas+) or C57BL/6 lpr/lpr (Fas−) were incubated in 96-well plates with 50 μL freshly obtained sera from tumor-bearing or control mice. After 24-hour incubation, DNA strand breaks were detected by TdT-mediated nick end-labeling TUNEL assay (Boehringer Mannheim, Indianapolis, IN), as described.19 Briefly, after incubation thymocytes were harvested and washed with PBS twice. Next the cells were fixed with 4% p-formaldehyde for 30 minutes at room temperature. The cells were washed with PBS, permeabilized on ice for 2 minutes, and incubated with fluorescein isothiocyanate (FITC)–dUTP for 1 hour at 37°C. Fluorescence of the cells was measured by flow cytometry as previously described.19 The analysis was performed by a Coulter (Miami, FL) Epics V flow cytometer. Five thousand cells were analyzed per sample.
For in situ apoptosis detection, liver and thymus from control and tumor-bearing mice were aseptically removed and fixed in 10% neutral formalin solution. Five-micrometer paraffin-embedded sections were adhered to slides. Deparaffinization was performed by heating the sections at 60°C for 25 minutes. Rehydration was carried out by transferring the slides through the following solutions: twice in xylem for 5 minutes, twice in 95% ethanol for 5 minutes, twice in 70% ethanol for 5 minutes, and once in distilled water for 10 minutes. The tissues were treated with 20 μg/mL proteinase K (Sigma, St. Louis, MO) in 10 mmol Tris-HCl, pH 8, for 30 minutes at 37°C and then washed in PBS twice for 10 minutes. Endogenous alkaline-phosphatase was inactivated by treating the slides with 10 mmol levamisole (Sigma) at room temperature for 1 hour. The sections were washed in PBS for 10 minutes, covered by TdT-FITC-dUTP enzyme-labeling solution, and incubated at 37°C in a humidified incubator for 1.5 hours. The slides were rinsed for 10 minutes in PBS and covered with alkaline phosphatase converter solution. After 1-hour incubation, the slides were washed twice in PBS for 10 minutes, and BM purple substrate (BCIP/NBT) was added. The dark-purple color was visible in 15 to 25 minutes. Slides were washed and counterstained with eosin, and a coverslip was placed on mounting media. The nuclear staining was evaluated under a light microscope. Identical slides were also stained with hematoxylin-eosin (H&E) to detect lymphocyte infiltration and to evaluate tissue structure.
Results
Detection of membrane-bound Fas ligand in vivo growth tumor cells
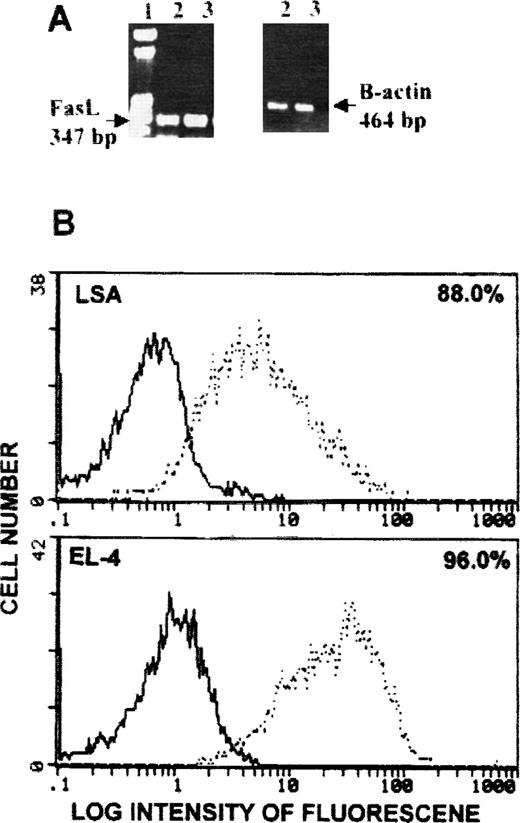
We previously demonstrated that LSA and EL-4 tumor cells expressed high levels of FasL when they were cultured in vitro.9 We further investigated whether these tumor cells continued to express Fas ligand while growing in vivo. Both LSA and EL-4 tumor cells isolated from tumor-bearing mice expressed Fas ligand message (Figure1A). Fas ligand protein on the membrane of in vivo grown LSA and EL-4 tumor cells was also investigated using flow cytometry. Figure 1B shows that LSA and EL-4 tumor cells expressed high levels of FasL protein on the membrane. These levels were higher than those expressed by LSA and EL-4 tumor cells when cultured in vitro.9
Detection of FasL on LSA and EL-4 tumor cells grown in vivo.
Mice were injected intraperitoneally with 1 × 10⁶tumor cells, and 7 days later they were killed and tumor cells were collected from the peritoneal cavity. Cells were analyzed for Fas ligand expression using RT-PCR (A) or flow cytometry (B). (A) Lane 1 is a molecular marker, and lanes 2 and 3 represent LSA and EL-4 tumor cells, respectively. β-actin served as an internal control. (B) Bold histogram represents negative control, and broken histogram represents cells stained with antibodies against FasL.
Detection of soluble Fas ligand in supernatant
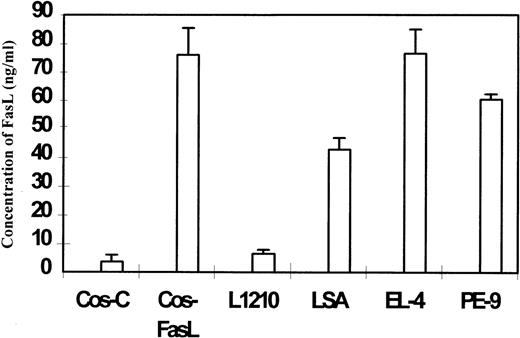
Sandwich ELISA was used to detect FasL in the culture supernatants from FasL+ tumor cell lines LSA and EL-4. The concentration of Fas ligand was determined by comparing the absorbency with the standard curve obtained using purified FasL as described in “Materials and methods.” As a positive and a negative control, culture supernatant from COS-FasL (transfected with FasL) and COS-C (transfected with control plasmid) cells were tested, respectively. Data shown in Figure 2 indicated that the culture supernatant from COS-FasL, LSA, and EL-4 cells showed significant levels of Fas ligand, whereas culture supernatants from COS-C and FasL-deficient L1210 tumor cell lines did not show significant levels of FasL. The culture supernatant from a FasL+ CTL cell line, PE-99, was also found to exhibit significant levels of FasL (Figure 2). These data suggested that the tumor cell lines LSA and EL-4 were producing significant levels of soluble form of FasL.
Detection of soluble FasL in the culture supernatants of tumor cells.
One million cells were cultured in 0.2 mL medium for 24 hours, and the supernatant was harvested and centrifuged. Culture supernatants from COS-C (transfected with control plasmid) and COS-FasL (transfected with FasL cDNA), LSA, EL-4, and L1210 tumor cells and from PE-9 T cells were tested in the ELISA assay to detect the presence of soluble FasL. The concentration of sFasL was calculated based on the use of purified sFasL as a standard.
Detection of sFasL in sera
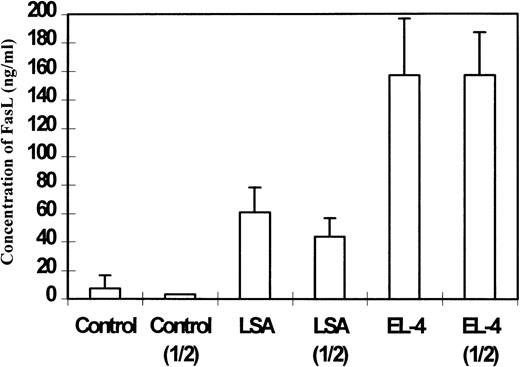
ELISA was also used to detect FasL in the sera of tumor-bearing mice. To this end, C57BL/6 mice were injected with 1 × 10⁶ LSA or EL-4 tumor cells intraperitoneally, and on day 7 serum was collected and pooled from 5 mice and tested for the presence of FasL. As shown in Figure 3, sera from LSA and EL-4 bearing mice showed significant levels of FasL when tested directly or after 2-fold dilution in comparison with the controls. It should be noted that sera from EL-4 bearing mice demonstrated higher levels of FasL inasmuch as FasL was detectable even after dilution of the serum 1 of 16 times, whereas sera from LSA-bearing mice showed significant levels of FasL at one-fourth dilution and not thereafter (data not shown). These data were consistent with the observation that EL-4 tumor cells expressed higher levels of FasL than LSA tumor cells.9
Detection of soluble FasL in the sera of C57BL/6+/+ tumor-bearing mice.
Sera from LSA or EL-4 tumor-bearing mice were pooled and used directly or after 1:2 dilution. Next, using ELISA, the presence of sFasL was detected. Control represents sera from C57BL/6 +/+ mice injected with PBS. The concentration of sFasL was calculated based on use of purified FasL as a standard.
Induction of apoptosis by sera from tumor-bearing mice
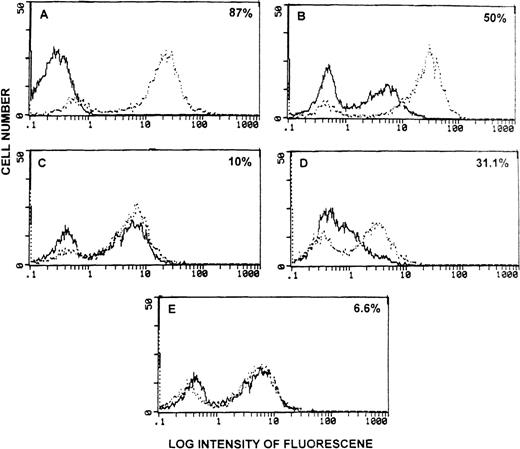
We next tested whether the FasL found in the sera of tumor-bearing mice was functional and therefore could induce apoptosis in vitro. To this end, Fas+ thymocytes from C57BL/6 +/+ or Fas− thymocytes from C57BL/6 lpr/lpr mice were incubated with 50 μl of sera from EL-4- or LSA-bearing mice for 24 hours. Next, DNA fragmentation was studied using the TUNEL assay. As shown in Figure 4A, irradiated thymocytes cultured for 24 hours in vitro, used as a positive control, showed high levels of apoptosis (broken histogram) when compared to nonirradiated thymocytes (bold histogram). In an earlier study, we noted that when normal thymocytes were cultured in vitro for 24 hours, they exhibited significant apoptosis.19 In the current study, when thymocytes from C57BL/6 +/+ mice were incubated with control serum, significant level of apoptosis was detected (Figure 4B, bold histogram). Such apoptosis was similar to that seen with thymocytes cultured with medium for 24 hours (data not shown). However, when thymocytes from C57BL/6 +/+ mice were incubated with sera from EL-4 bearing mice, significantly higher levels of apoptosis was seen when compared with cells incubated with control serum (Figure 4B, broken histogram). The apoptosis induced by sera from EL-4 bearing mice was FasL dependent because the same sera failed to induce marked increases in apoptosis in Fas− thymocytes from C57BL/6 lpr/lpr mice (Figure 4C). Similar results were obtained with the sera from LSA tumor-bearing mice, which induced increased apoptosis in Fas+ (Figure 4D) but not in Fas− (Figure 4E) thymocytes.
Detection of functional sFasL in the serum of tumor-bearing mice.
(A) Freshly isolated thymocytes from C57BL/6 +/+ mice stained with TdT + FITC-dUTP (bold histogram) or stained after irradiation and culture for 24 hours (broken histogram). (B-E) Thymocytes from C57BL/6 +/+ (B, D) or C57BL/6 lpr/lpr mice (C, E) were cultured in the presence of sera from PBS-treated control mice (bold histogram) or from tumor-bearing mice (broken histogram). Cells were analyzed for green fluorescence using a flow cytometer. The subtraction of broken histogram from the bold histogram has been indicated as the percentage apoptosis in each panel.
Detection of apoptosis in vivo
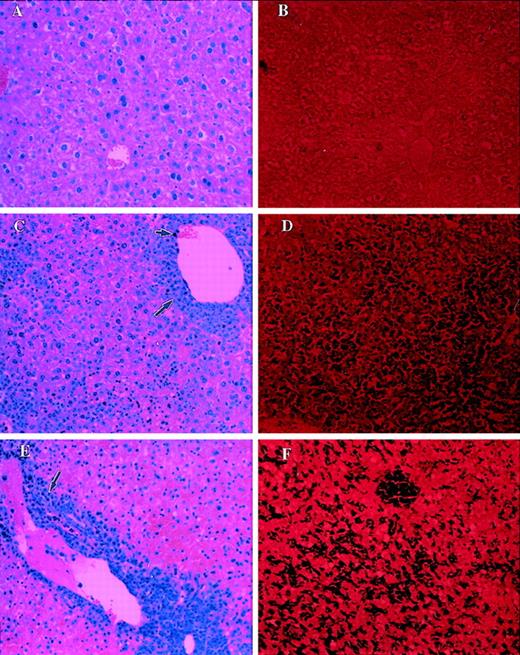
We further examined in vivo whether FasL produced by the tumor cells induced apoptosis in liver and thymus. To this end, 1 × 10⁶ tumor cells were injected into C57BL/6+/+ (Fas+) or C57BL/6 lpr/lpr(Fas−) mice, and 7 days later liver and thymus were removed. Apoptosis was examined in paraffin-embedded and sectioned tissues by TUNEL assay, and morphology was studied using H&E staining. Liver sections from control mice stained with H&E showed normal morphology (Figure 5A) and exhibited no significant apoptosis (Figure 5B). In contrast, liver from LSA (Figure5C) or EL-4 (Figure 5E) tumor-bearing C57BL/6 +/+ mice, when examined with H&E staining, showed significant infiltration with lymphocytes and tumor cells. The tumor infiltration was predominantly restricted to the perivascular region. In addition, marked structural damage to the hepatocytes was noted in these livers. When liver sections from LSA or EL-4 tumor-bearing mice were screened using TUNEL assay (Figures 5D and 5F, respectively), marked and extensive apoptosis was detected, as evident by the dark purple staining of the cells.
Analysis of morphology and apoptosis in the liver of tumor-bearing C57BL/6 +/+ mice.
Sections of liver from PBS-injected control mice (A, B), LSA tumor-bearing (C, D), or EL-4 tumor-bearing (E, F) mice were examined after H&E staining (A, C, E) or TUNEL assay (B, D, F) to detect apoptosis. Small and large arrows represent infiltration of tumor cells and lymphocytes, respectively. Dark purple staining in D and F indicates the apoptosis.
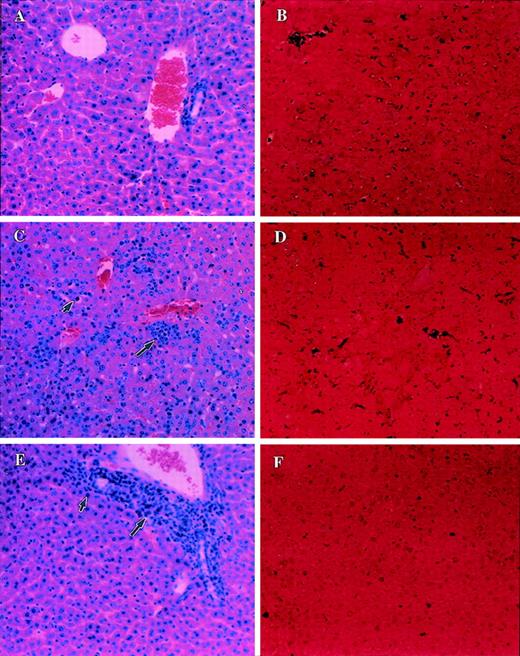
Similar experiments were carried out in C57BL/6 lpr/lpr mice. The livers from such mice injected with PBS alone (control) failed to exhibit any structural changes (Figure 6A) or apoptosis (Figure 6B). Furthermore, the livers from C57BL/6lpr/lpr mice injected with LSA (Figure 6C) or EL-4 (Figure 6E), when examined after H&E staining, revealed significant infiltration with lymphocytes and tumor cells. This was similar to that seen in the C57BL/6 +/+ mice (Figures 5C, 5E). However, the C57BL/6lpr/lpr mice showed no significant damage to the hepatocytes. Furthermore, when apoptosis was studied, the C57BL/6 lpr/lprmice injected with LSA (Figure 6D) or EL-4 (Figure 6F) failed to exhibit significant levels of apoptosis. This was in contrast to the tumor-bearing C57BL/6 +/+ mice, which had exhibited marked apoptosis in the liver (Figure 5D, 5F). These data together suggested that LSA and EL-4 tumor cells induced apoptosis in only Fas+ but not in Fas− livers, thereby indicating the involvement of FasL produced by tumor cells.
Analysis of morphology and apoptosis in the liver of tumor-bearing C57BL/6 lpr/lpr mice.
Sections of liver from PBS-injected control C57BL/6 lpr/lprmice (A, B) or LSA tumor-bearing (C, D) or EL-4 tumor-bearing (E, F) were examined after H&E staining (A, C, E) or TUNEL assay (B, D, F) to detect apoptosis. Small and large arrows represent infiltration of tumor cells and lymphocytes, respectively. Dark purple staining in D and F indicates the apoptosis.
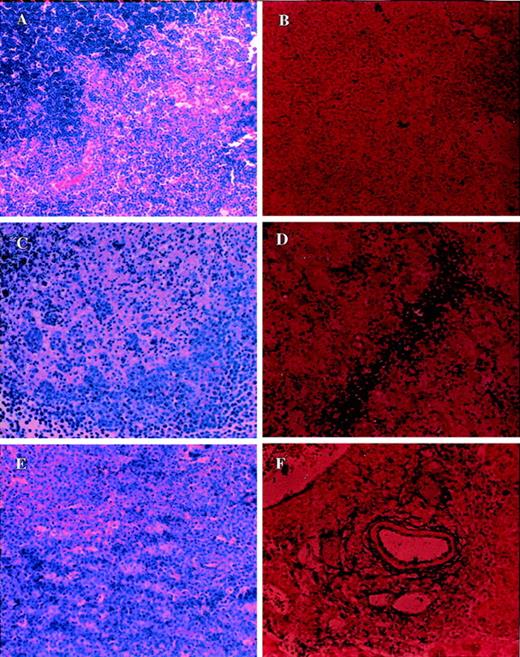
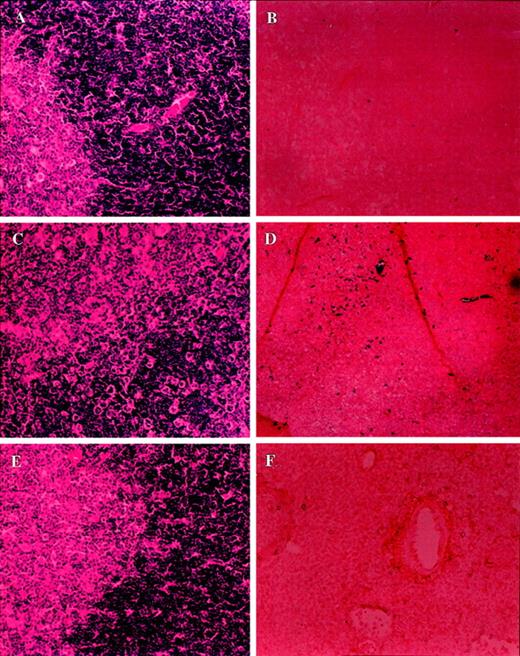
Similar results were also obtained with other organs, including the thymus. Figure 7A shows a section of the control thymus from C57BL/6 +/+ mice stained with H&E exhibiting normal morphology (Figure 7A) and demonstrating no significant apoptosis (Figure 7B). In contrast, the H&E staining of the thymus from C57BL/6 +/+ mice injected with LSA (Figure 7C) or EL-4 (Figure 7E) showed marked damage to the thymus. Furthermore, the same sections stained for apoptosis revealed marked induction of apoptosis (Figure 7D for LSA; Figure 7F for EL-4). In contrast to this, the Fas-deficient C57BL/6 lpr/lpr mice injected with LSA (Figure 8C) or EL-4 (Figure 8E) showed normal morphology and failed to exhibit apoptotic cells (Figures 8D and8F for LSA and EL-4, respectively).
Analysis of morphology and apoptosis in the thymus of tumor-bearing C57BL/6 +/+ mice.
Section of thymus from PBS-injected control (A, B) or LSA tumor-bearing (C, D) or EL-4-tumor bearing (E, F) mice were examined after H&E staining (A, C, E) or TUNEL assay to detect apoptosis (B, D, F). More tumor cell infiltration was observed in the thymus than in the liver.
Analysis of morphology and apoptosis in the thymus of tumor-bearing C57BL/6 lpr/lpr mice.
Sections of thymus from PBS-injected control (A, B) or LSA tumor-bearing (C, D) or EL-4-tumor bearing (E, F) mice were examined after H&E staining (A, C, E) or TUNEL assay to detect apoptosis (B, D, F). More tumor cell infiltration was observed in the thymus than the liver.
Tumor cells are the main source of Fas ligand
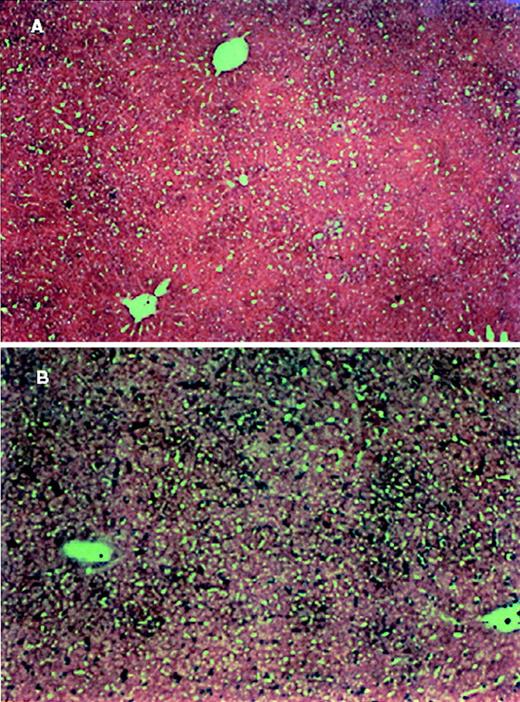
To investigate whether Fas ligand found in tumor-bearing mice, inducing apoptosis, was derived from the tumor cells or from the host, C57BL/6 gld/gld (FasL-defective) mice were injected with EL-4 and LSA tumor cells. Sera from tumor-bearing C57BL/6 gld/gldmice contained significantly higher levels of Fas Ligand than control mice (data not shown). Furthermore, as shown in a representative experiment, the tumor-bearing C57BL/6 gld/gld mice exhibited significant levels of apoptosis in liver (Figure9) and thymus (data not shown). These data suggested that the FasL found in sera and the FasL responsible for inducing apoptosis in liver and thymus originated from the tumor cells rather than from the host.
Analysis of apoptosis in the liver of LSA tumor-bearing C57BL/6 gld/gld mice.
Sections of liver from PBS-injected (A) or LSA tumor-bearing (B) C57BL/6 gld/gld mice analyzed for apoptosis as described in Figure 4.
Analysis of apoptosis in the liver of LSA tumor-bearing C57BL/6 gld/gld mice.
Sections of liver from PBS-injected (A) or LSA tumor-bearing (B) C57BL/6 gld/gld mice analyzed for apoptosis as described in Figure 4.
Discussion
In the current study we observed that FasL-bearing tumor cells, LSA and EL-4, caused significant apoptosis in the liver and thymus of syngeneic wild-type but not Fas-deficient mice. Furthermore, significant levels of soluble FasL were detected in the sera of tumor-bearing mice. Such FasL was functional; sera from tumor-bearing mice were able to induce significant levels of apoptosis in Fas+ but nor Fas− targets. The current study demonstrated that growth of FasL-bearing tumors in vivo can induce significant toxicity in the organs expressing Fas.
Recently, several studies have demonstrated that a variety of tumor cells constitutively express Fas ligand capable of inducing apoptosis in Fas-bearing target cells.4-9 Despite such studies, it is unclear whether the in vivo growth of FasL-bearing tumor can trigger toxicity in the organs and tissues expressing Fas. In the current study, using Fas+ wild-type and Fas−lpr/lpr mice, we demonstrated that the tumor growth induced significant apoptosis and toxicity in Fas+ but not in Fas− hosts. Such toxicity in the thymus and liver may partially result from metastasis of tumor cells and direct contact with the Fas+ cells of the host. However, this was limited because the tumor infiltration in organs was restricted to the perivascular region, whereas apoptosis was seen throughout the organ. In addition, the soluble form of FasL produced by the tumor may also contribute to the induction of apoptosis and toxicity. This was evident from the fact that sera from the tumor-bearing mice had significant levels of FasL and, more important, such FasL was functional because it induced apoptosis in Fas+ but not in Fas−targets. Although soluble FasL may be less toxic than the membrane-bound FasL,13 at the peak of the tumor growth we noted that the host carried more than 2 × 10⁸ tumor cells. Thus, the soluble FasL may have reached significant concentrations to induce toxicity. In the current study we noted that the sera of tumor-bearing mice had 60 to 160 ng/mL FasL. In a previous study it was shown that sFasL is ineffective at concentrations below 1 μg/mL to induce apoptosis in Fas+ human Jurkat T cells. However, it should be noted that supernatants from some tumor cell lines are higgle apoptotic even at 1 ng/mL because they produce the unprocessed membrane-bound form of FasL.13 Thus, tumor cells that lack processing proteases may directly release vesicles containing the membrane-bound FasL in the supernatant, thereby increasing their ability to induce apoptosis. 13
Increased levels of FasL in the serum, correlating with pathogenesis, have been reported in a number of clinical diseases. Sato et al14 noted that in one patient nasal lymphoma was accompanied by significant liver damage and pancytopenia that correlated with high levels of FasL. Furthermore, after chemotherapy, there was a decrease in soluble FasL in the serum and a consequent improvement in the liver damage and pancytopenia. Other studies have suggested that high local concentrations of soluble FasL, in association with other cytotoxic agents, may lead to the cell death.13 The role of soluble FasL in other disease models is also becoming increasingly apparent. For example, serum soluble FasL increased the severity of congestive heart failure.16
In the current study we also detected FasL in the culture supernatants of LSA and EL-4 tumor cells. This is consistent with earlier reports that supernatant from COS cells, transfected with full-length human FasL or mouse FasL, exhibit FasL capable of inducing apoptosis in Fas+ target cells.20 Thus chemotherapy, which leads to the lysis of tumor cells, may release large amounts of FasL, thereby causing significant toxicity.
Apoptosis may occur in an autocrine fashion in which a cell may up-regulate both Fas and FasL. Such a mechanism is known to play an important role in the liver damage seen in patients with cirrhosis.21 In the current study, we addressed the possibility that the thymus and liver damage of tumor-bearing mice resulted from FasL produced by the host rather than by the tumor cells. We observed that the liver and thymus of C57BL/6 gld/gld mice, which exhibited a functional defect in FasL, showed significant levels of apoptosis after injection with LSA and EL-4 tumor cells. These data indicated that apoptosis resulted from the production of soluble FasL by the tumor cells rather than the host.
The toxicity induced by the FasL+ tumor cells in the host may influence the survival of the host. We observed that though wild-type mice injected with 1 × 10⁶ LSA tumor cells survived for approximately 7 to 8 days, the Fas-deficient C57BL/6lpr/lpr mice survived for approximately 10 to 12 days. The fact that lpr/lpr mice also die ultimately of tumor growth suggested that immunotoxicity induced by the tumor cells may not be the sole reason the host fails to reject the tumor. Alternatively, the C57BL/6lpr/lpr mice may produce immunosuppressive molecules that may prevent the host from destroying the tumor.22 However, such molecules are produced only after they develop lymphoproliferative disease. In the current study, we used lpr mice at 4 weeks of age, during which time their immune functions are normal.23
In summary, the current study demonstrated that the tumor-derived Fas ligand in mice is functional and responsible for inducing apoptosis and damage in organs that express Fas. Such a mechanism may account for significant toxicity seen in patients with cancer. Attempts to block apoptosis may provide an effective treatment to neutralize the toxicity.
Supported in part by grants from the National Institutes of Health (AI101392 and HL058641) and by Sigma Xi.
Reprints:Prakash S. Nagarkatti, Department of Biology, Virginia Polytechnic Institute and State University, Blacksburg VA 24061; e-mail: pnagarka@vt.edu.
The publication costs of this article were defrayed in part by page charge payment. Therefore, and solely to indicate this fact, this article is hereby marked “advertisement” in accordance with 18 U.S.C. section 1734.

This feature is available to Subscribers Only
Sign In or Create an Account Close Modal