Protein kinase C (PKC) is a family of serine/threonine protein kinases involved in many cellular responses. Although the analysis of PKC activity in many systems has provided crucial insights to its biologic function, the precise role of different isoforms on the differentiation of normal hematopoietic progenitor cells into the various lineages remains to be investigated. The authors have assessed the state of activation and protein expression of PKC isoforms after cytokine stimulation of CD34+ progenitor cells from human bone marrow. Freshly isolated CD34+ cells were found to express PKC-, PKC-β2, and PKC-ɛ, whereas PKC-δ, PKC-γ, and PKC-ζ were not detected. Treatment with erythropoietin (EPO) or with EPO and stem cell factor (SCF) induced a predominantly erythroid differentiation of CD34+ cells that was accompanied by the up-regulation of PKC- and PKC-β2 protein levels (11.8- and 2.5-fold, respectively) compared with cells cultured in medium. Stimulation with EPO also resulted in the nuclear translocation of PKC- and PKC-β2 isoforms. Notably, none of the PKC isoforms tested were detectable in CD34+ cells induced to myeloid differentiation by G-CSF and SCF stimulation. The PKC inhibitors staurosporine and calphostin C prevented EPO-induced erythroid differentiation. Down-regulation of the PKC-, PKC-β2, and PKC-ɛ expression by TPA pretreatment, or the down-regulation of PKC- with a specific ribozyme, also inhibited the EPO-induced erythroid differentiation of CD34+ cells. No effect was seen with PKC-β2–specific ribozymes. Taken together, these findings point to a novel role for the PKC- isoform in mediating EPO-induced erythroid differentiation of the CD34+ progenitor cells from human bone marrow.
A small pool of pluripotent, hematopoietic stem cells that reside in the bone marrow gives rise to all blood cell types through a process of simultaneous lineage commitment, cell proliferation, and differentiation. This process is, at least in part, regulated by a complex network of hematopoietic growth factors.1-3 Erythropoietin (EPO) and stem cell factor (SCF) are the 2 most prominent cytokines that regulate erythropoiesis. EPO alone is able to induce erythroid cell development and maturation from progenitor cells,4 but EPO and SCF combined induce an enhanced synergistic proliferation and expansion of developing erythroid cells.5,6 The development of myeloid cells from progenitor cells is supported by granulocyte colony-stimulating factor (G-CSF) or granulocyte macrophage CSF (GM-CSF) alone, but it is enhanced when either of these is combined with IL-37 or SCF.5,8,9 Furthermore, GM-CSF in combination with tumor necrosis factor (TNF)-α induces the development of dendritic cells,10 whereas IL-15 in combination with SCF induces the differentiation of natural killer cells from progenitor cells.11
Most hematopoietic growth factors are able to activate common signaling pathways, such as the Ras/Raf/MAPK pathway, and the PI3 kinase pathway. However, it is still unclear how growth factors elicit varied developmental responses in hematopoietic progenitors. Candidate intracellular regulatory molecules are members of the protein kinase C (PKC) family of serine/threonine kinases. Based on their biochemical properties and sequence homologies, they have been divided into 3 subclasses12,13—the conventional PKCs (PKC-α, PKC-βI, PKC-β2, and PKC-γ), which are activated by diacylglycerol, phosphatidylserine, and Ca++; the novel PKCs (PKC-δ, PKC-ε, PKC-θ, PKC-η, and PKC-μ), which are activated by diacylglycerol and phosphatidylserine but independently of Ca++; and the atypical PKCs (PKC-ζ, PKC-ι, and PKC-λ), which only respond to phosphatidylserine. The existence of this large family of PKC isoforms suggests that individual PKC isoforms likely have specific roles in signal transduction. The phorbol ester PMA, which activates the conventional and novel PKCs, has been shown to induce macrophage differentiation of the myelomonocytic cell line U93714 and the promyelocytic cell line HL60.15 Lineage commitment of hematopoietic progenitors transformed by the E26 avian leukemia virus was determined by the level of PKC activity: high PKC activity favored eosinophil differentiation, low PKC activity favored myelomonocytic development, and without PKC activity, the progenitor phenotype was maintained.16 It has also been proposed that PKC plays a role in the lineage determination of erythroid and megakaryocytic differentiation because PMA stimulates megakaryocytic development and inhibits erythroid development.17,18 Other studies19-21 of human and murine erythroleukemic cells have shown that the modulation of PKC-δ, PKC-ε, or both may play an important role in erythroid maturation.
However, the results obtained with transformed or leukemic cell lines may not represent the features of normal cells. CD34+ cells from human bone marrow are a heterogeneous population of multipotent progenitors and thus can be used to study the functional role of each PKC isoform in growth factor-induced differentiation. A versatile method for defining the specific cellular functions of PKC isoforms is to investigate changes in their gene expression during growth factor-induced cell differentiation and then to inhibit gene expression of candidate isoforms and to study the possible effects on cell differentiation. Accordingly, in the current study we purified CD34+ progenitor cells from human bone marrow and investigated the distribution of various PKC isoforms in these cells after different types of cytokine stimulation. Furthermore, we evaluated the effect of PKC-α and PKC-β2 inhibition on this process, in particular EPO-induced erythroid differentiation.
Materials and methods
Reagents and antibodies
Recombinant human (rhu) EPO and liposomal transfection reagent (DOTAP) were purchased from Boehringer Mannheim (GmbH; Mannheim, Germany), recombinant human granulocyte colony-stimulating factor (rhu G-CSF) was purchased from Amgen (Thousand Oaks, CA), and recombinant human stem cell factor (rhu SCF) was purchased from R&D Systems (Abingdon, UK). Staurosporine, calphostin C, and 12-O-tetradecanoylphorbol 13-acetate (TPA) were purchased from Sigma Chemical (St. Louis, MO). The following antibodies were used: anti-CD34 PE (HPCA-2; Becton Dickinson, San Jose, CA); anti-glycophorin A-PE, anti-CD13 PE, anti-CD14 fluorescein isothiocyanate (FITC), anti-CD15 FITC, anti-CD71 FITC, anti-CD83 FITC, anti-CD86 FITC, anti-CD41 FITC, anti-HLA DR (DAKO AS, Glostrup, Denmark); rabbit antiserum Mcl-1 (PharMingen, San Diego, CA); rabbit polyclonal IgG anti-Bcl-xL, anti-Bax, anti-PKC-α, anti- PKC-β2, anti-PKC-γ, anti-PKC-ζ, anti-PKC-ε (Santa Cruz Biotechnology, Santa Cruz, CA); anti-PKC-δ (Boehringer Mannheim); and goat antirabbit IgG-HRP (DAKO AS).
Cell separation
Bone marrow cells were aspirated from the iliac crest of healthy adult donors with their informed consent and with the approval of the regional ethics committee. Mononuclear cells were separated by Ficoll-Hypaque gradient centrifugation (Lymphoprep, 1.077 mg/L; Nycomed Pharma, Oslo, Norway), washed twice, and resuspended in RPMI 1640 containing 10% fetal calf serum (FCS; Gibco, Life Technologies A/S, Tåstrup, Denmark). Positive selection of CD34+ cells was performed as previously described.22 Briefly, bone marrow mononuclear cells formed rosettes with Dynabead M-450 directly coated with anti-CD34 monoclonal antibody (mAb; Dynal, Oslo, Norway) in RPMI 1640 with 10% FCS for 30 minutes at 4°C, rotation (40 × 106 cells/mL, and a 1:1 bead-to-cell ratio). Rosetted cells were attracted to a magnet (MPC-6; Dynal) and washed 6 times. Nonrosetted cells were removed by pipetting. Beads were detached from positively selected cells after incubation for 45 minutes at room temperature with anti-FAB serum (DETACHaBEAD for CD34; Dynal) diluted 1:1 in RPMI with 10% FCS. Then a magnet captured the beads, and the supernatant containing the detached cells was transferred to a new tube. Cells were washed twice in RPMI with 10% FCS and counted before use. More than 95% of the isolated cells were reproducible CD34+ cells.
Cell culture
CD34+ cells (2 × 10⁵ to 3 × 10⁶) were plated in 1 to 2 mL X-VIVO 15 medium containing 1% bovine serum albumin (Stem Cell, Vancouver, BC), 300 mg/L L-glutamine, 66 mg/L penicillin, and 100 mg/mL streptomycin (referred to as X-VIVO 15 complete medium) in 24-well plates without cytokines or with EPO (5 U/mL), SCF (50 ng/mL), or SCF and either EPO or G-CSF (50 ng/mL). After incubation at 37°C in air for 4 days or as specified, cytoplasmic and membrane proteins were prepared and analyzed by Western blotting. During experiments in which nuclear protein extracts were prepared, the CD34+ cells were incubated in medium for 24 hours before EPO (5 U/mL) was added.
PKC inhibition by staurosporine and calphostin C
CD34+ cells were cultured in X-VIVO 15 complete medium (105 cells in 0.5 mL per well in 24-well plates; Stem Cell) in the absence or presence of various concentrations of staurosporine or calphostin C without cytokines or with either EPO (5 U/mL) or combined EPO and SCF (50 ng/mL) (see figure legends). The cells were immunophenotyped after incubation for 7 days.
Inhibition of PKC- and PKC-β2 isoform expression by specific ribozymes
The CD34+ cells were seeded at 30 000 cells per well in 100 μL X-VIVO 15 complete medium in flat-bottomed, 96-well plates and then incubated with ribozymes complexed with DOTAP (Boehringer Mannheim) at 5 μg/mL as described by the manufacturer. After 24-hour transfection, EPO (5 U/mL) and SCF (50 ng/mL) were added to the cells and incubated at 37°C for 5 or 7 days before protein or phenotypic analysis, respectively. The ribozymes used in this study were made in vitro as previously described.23 The PKC-α ribozyme sequence is 5′-GGGAACUGAUGAGUCCGUGAGGACGAAACGUCAGCCAUGG-3′ and the PKC-β2 sequence is 5′-GCGCGGGCUGAUGAGUCCGUGAGGACGAAACCGGAGCCCG-3′.
Immunophenotyping
Cells were incubated with the specified mAbs for 30 minutes at 4°C and washed with phosphate-buffered saline (PBS). Stained cells were analyzed on an FACScan flow cytometer with an argon-ion laser tuned at 488 nm (Becton Dickinson). Data acquisition and analysis were performed by CELLQuest software (Becton Dickinson).
Cytoplasmic, nuclear, and membrane protein preparations
Preparation of cytoplasmic and nuclear proteins.
Control and treated cells were washed twice with PBS, and the cell pellets were resuspended in lysis buffer (0.2% Nonidet-40 and protease inhibitors, protease inhibitor kit; Boehringer Mannheim) in PBS. After 20-minute incubation on ice, samples were centrifuged for 10 minutes at 15 000 rpm, 4°C. Supernatants containing cytosolic proteins were transferred to new tubes, and pellets containing the nucleus were washed 3 times in 20 mmol/L HEPES and resuspended in lysis buffer (0.08 mol/L sodium dodecyl sulfate, 0.0625 mol/L Tris, 10% glycerol, and 5% β-mercaptoethanol). After they were boiled for 20 minutes, nuclear extracts were centrifuged for 10 minutes at 15 000 rpm at 4°C, and the supernatants containing the nuclear proteins were transferred to new tubes.
Preparation of cytosol and membrane proteins.
Cells were washed twice in PBS and resuspended in 50 to 100 μL buffer A (5 mmol/L Tris, pH 8, 0.5 mmol/L EDTA, and 75 mmol/L sucrose) with protease inhibitors. After 4× sonication (10 seconds each), nuclei were removed by centrifugation at 2000 rpm for 5 minutes. The supernatants were transferred to new tubes and ultracentrifuged for 30 minutes at 30 000 rpm (4°C). Supernatants containing the cytosol proteins were transferred to new tubes, and the pellets were carefully washed 4 times with PBS and resuspended in buffer A containing 1% Triton X-100 and protease inhibitors. After 10-minute incubation on ice, samples were centrifuged for 10 minutes at 15 000 rpm (4°C). Supernatants were saved as membrane-protein extracts. In all cases, protein concentrations were determined using the protein assay kit (Bio-Rad Laboratories, Hercules, CA).
Immunoblotting
Typically, 5 to 30 μg total protein was separated by electrophoresis on 10% sodium dodecyl sulfate–polyacrylamide mini-gels (Bio-Rad). The separated proteins were transferred to nitrocellulose membranes (Protran; Schleicher & Schuell GmbH, Dassel, Germany) by electrotransfer and blocked for 60 minutes at room temperature with 5% dry milk in Tris-buffer (TBS-T; 0.1 mol/L Tris, 0.15 mol/L NaCl, and 0.1% Tween-20). After blocking, membranes were incubated for 60 minutes with one of these antibodies: anti-Bcl-xL rabbit polyclonal IgG, anti-Bax rabbit polyclonal IgG, anti Mcl-1 rabbit antiserum, anti-PKC-α rabbit polyclonal IgG, anti- PKC-β2 rabbit polyclonal IgG, anti-PKC-γ rabbit polyclonal IgG, anti-PKC-ζ rabbit polyclonal IgG, or anti-PKC-ε rabbit polyclonal IgG. All antibodies were used at 0.2 μg/mL except the anti-PKC-γ rabbit polyclonal IgG antibody, which was used at 0.4 μg/mL). After they were washed for 5 × 10 minutes with TBS-T at room temperature, the filters were incubated for 60 minutes with horseradish peroxidase-coupled secondary antibody (goat antirabbit IgG-HRP) at room temperature. Then the immunoreactive proteins were visualized by the chemiluminescence system, ECL (Amersham, Braunschwieg, Germany). When less than 10 μg protein was analyzed, the enhanced chemiluminescence system ECL PLUS+ (Amersham) was used. In all cases equal loading was proved by subsequent Ponceau red staining of the filters. Densitometric analysis was performed with a Personal Densitometer SI (Molecular Dynamics, Sunnyvale, CA) using ImageQuant 5.0 software (Molecular Dynamics). Whenever more than 1 band appears on the PKC-α or PKC-β2 blot, only the expected 80-kd band was used for quantitation. No bands for PKC-α were detected when the membranes were preincubated with the corresponding immunizing peptide for PKC-α (control peptide) (data not shown).
Total RNA preparation and reverse transcription–polymerase chain reaction
Total RNA was prepared as described by Chomczynski and Sacchi,24 and 1 μg was reverse transcribed using the first-strand cDNA synthesis kit and oligo-dT primer as recommended by the manufacturer (Pharmacia, Uppsala, Sweden). Polymerase chain reaction (PCR) was performed on half the product (4 μL) using specific primers for PKC-α (5′-ATCCGCAGTGGAATGAGTCCTTTACAT-3′ and 5′-TTGGAAGGTTGTTTCCTGTCTT CAGAG-3′; Eurogentec, Seraing, Belgium). As a control, actin mRNA was coamplified using the following primers: 5′-TGCCCAGGAAAGGCTGGAAGAG-3′ and 5′-GGCGACGAGGCCCAGAGCAAGAGAG-3′ (Eurogentec). After 30 cycles of amplification (1 minute at 92°C; 1 minute at 56°C; 1 minute at 72°C), samples were analyzed by electrophoresis on 1.2% agarose gel and visualized by ethidium bromide staining.
Statistical analysis
The statistical significance of between-group differences was determined using the paired, 2-tailed Wilcoxon nonparametric test and by applying SPSS 8.0 software.
Results
Expression of PKC isoforms in CD34+ progenitor cells from human bone marrow
We used Western blotting to analyze the profile of PKC isoform protein expression in freshly isolated CD34+ progenitor cells from human bone marrow (Figure 1). Among the investigated PKC isoforms, PKC-α, PKC-β2, and PKC-ε were detected. The same expression pattern was also found in CD34+ cells from mobilized peripheral blood, but the level of expression was higher than in CD34+ bone marrow cells (not shown).
Protein expression of different PKC isoforms in freshly isolated CD34+ progenitor cells from bone marrow.
B cells (BC) and the glioma cell lines BT4c and U87GM were included as positive controls. The CD34+ cells were selected as described in “Materials and Methods,” and cytosolic proteins were prepared and analyzed by Western blotting. A representative of 3 separate experiments is shown. Note that for B cells and CD34+ cells, the bands below 80 kd for PKC-α, PKC-β2, and PKC-ε were possible degradation products resulting from activation.
High level of PKC- and PKC-β2 isoforms in CD34+cells stimulated by erythropoietin
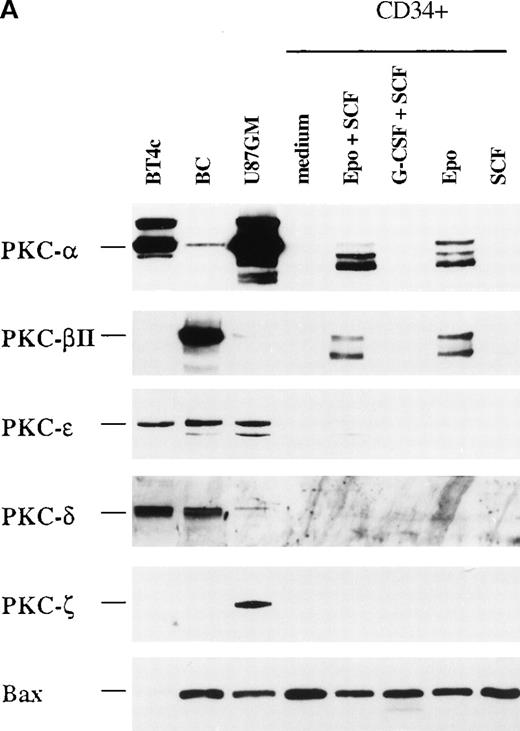
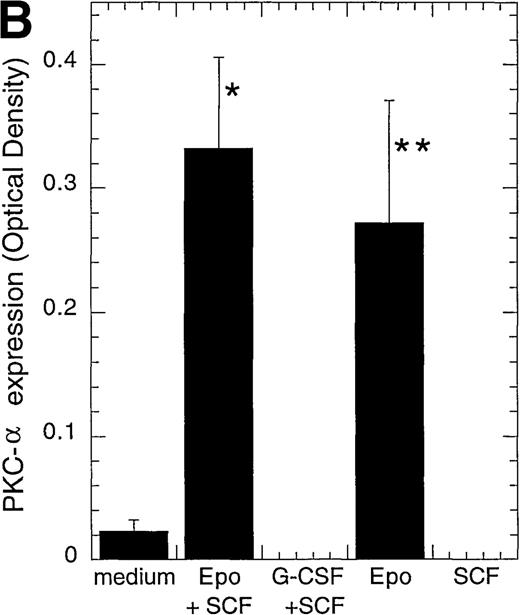
We next investigated whether different PKC isoforms could play different roles during the differentiation process of CD34+progenitor cells. CD34+ cells are able to differentiate in vitro into different hematopoietic lineages, depending on the cytokine combination given. Alone or in combination with SCF, EPO induces erythroid differentiation.25 There was an increase from 0% at day 0 to 46% or 70% glycophorin A+CD71+cells after 4 or 8 days with EPO and SCF (Josefsen et al, manuscript submitted). G-CSF and SCF increase the development of myeloid cells.5 There was an increase in CD15+granulocytes from 22% at day 0 to 77% or 80% after 4 or 8 days with G-CSF and SCF (Josefsen et al, manuscript submitted). Interestingly, when we examined the expression of PKC isoforms in CD34+cells cultured for 4 days, PKC-α was detected in EPO- and EPO/SCF-stimulated cells and displayed 11.8- and 14.4-fold higher levels, respectively, than cells cultured in medium alone (Figure2A, B). Only minor changes was detected in PKC-β2 expression after EPO-treatment (2.5-fold higher level), whereas no significant change was detected with EPO and SCF treatment (Figure 2C). PKC-ε was usually no longer detectable, but when it was expressed, it showed equally weak expression levels in medium and in EPO- and SCF-treated cells. None of the tested PKC isoforms were detected when the CD34+ cells differentiated into myeloid cells after SCF and G-CSF stimulation (Figure 2A). As a control for protein loading, the expression of the pro-apoptotic molecule Bax was also investigated because the different cytokine stimulations were found to have only minor effects on its expression (Josefsen et al, manuscript submitted).
Protein expression of different PKC isoforms in CD34+ progenitor cells cultured with different cytokines.
CD34+ cells were cultured in vitro for 4 days in medium alone or in the presence of EPO (5 U/mL) and SCF (50 ng/mL), G-CSF (50 ng/mL) and SCF (50 ng/mL), EPO (5 U/mL), or SCF (50 ng/mL) before the preparation of cytosolic proteins. Relative protein expressions of PKC-α, PKC-β2, PKC-γ, PKC-δ, PKC-ε, PKC-ζ, and Bax were determined by Western blotting. (A) One representative blot is shown. Note that for BT4c and U87GM, the upper band for PKC-α is possibly a phosphorylated form. (B) Optical density of PKC-α, determined by densitometric imaging of hyperfilms, is shown. Mean ± SEM of 5 to 12 separate experiments (*P < .001, n = 12;P = .009, n = 5). The expected 80-kd band is used for quantitation. (C) Optical density of PKC-β2, determined by densitometric imaging of hyperfilms, is shown. Mean ± SEM of 5 to 8 separate experiments (*P = .046, n = 5).
Erythropoietin-induced nuclear translocation of PKC- and PKC-β2
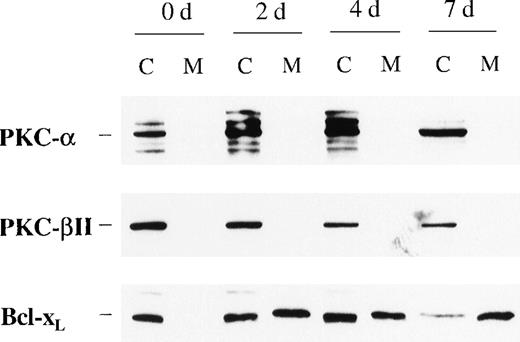
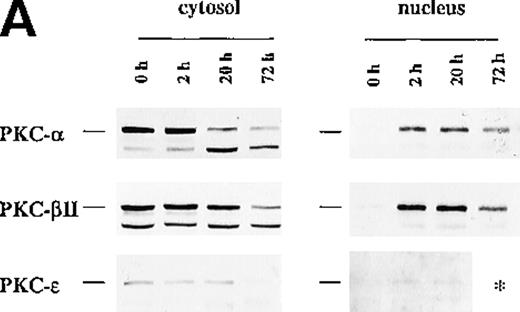
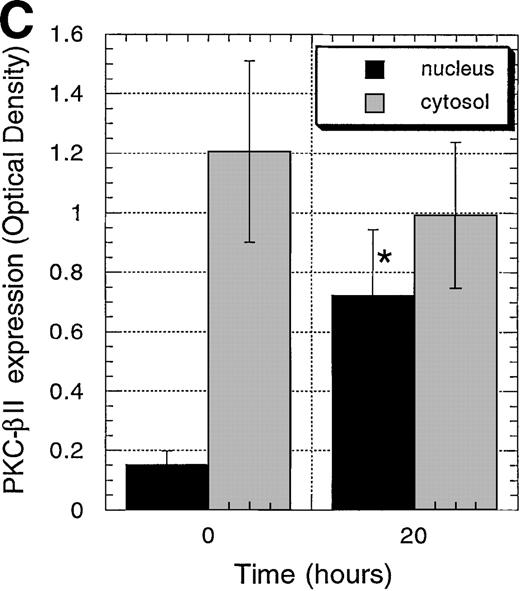
Because incubation of the CD34+ cells with EPO showed higher protein levels of PKC-α and PKC-β2 than cells cultured in medium alone, we next examined the effect of such treatment on their cellular distribution. In contrast to Bcl-2 family member Bcl-xL, PKC-α and PKC-β2 did not show membrane translocation by EPO or SCF treatment (Figure3). Further experiments were performed to determine whether EPO induces the translocation of PKC-α, PKC-β2, or both to the nucleus. To rule out the possibility of already activated CD34+ cells, the cells were incubated in medium for 24 hours before the addition of EPO. Interestingly, EPO induced significant up-regulation of PKC-α and PKC-β2 nuclear translocation 20 hours after its addition (PKC-α: P = .028, n = 5; PKC-β2: P = .047, n = 5) (Figures4A to 4C), whereas there was no significant up-regulation of PKC-ε (Figure 4D). The up-regulation of PKC-α and PKC-β2 in the nucleus was transient. It was already detectable 2 hours after the addition of EPO, and it remained high after 20 hours (Figure 4A). After 72 hours the expression of these isoforms decreased, though it was still higher than it had been before the addition of EPO (Figure 4A). In contrast to the nuclear protein level of PKC-α and PKC-β2, we did not observe a significant change of the cytosolic protein level of these PKCs in CD34+ cells stimulated with EPO for 20 hours, compared with freshly isolated cells. However, a decrease in the cytosolic level of these isoforms was observed in a few experiments (Figure 4A). For longer incubation times with EPO (3-7 days), PKC-α and PKC-β2 expression usually decreased compared with the cytosolic level in freshly isolated cells, but it was still detectable after 7 days (Figures 3 and 4A). The cytosolic protein level of PKC-ε decreased faster than the other isoforms and was usually not detected at 72 hours or later (Figure 4A). Taken together, PKC-α and PKC-β2 isoforms showed translocation to the nucleus, thus indicating activation and nuclear signaling in CD34+ cells.
Protein expression of PKC- and PKC-β2 in cytosolic and membrane fractions during EPO and SCF stimulation of CD34+ cells for various times.
CD34+ cells were cultured in the presence of EPO (5 U/mL) and SCF (50 ng/mL) for various times before the preparation of cytosolic and membrane proteins. Protein expressions of PKC-α, PKC-β2, and Bcl-xL were determined by Western blotting. A representative of 3 separate experiments is shown. C, cytosolic fractions; M, membrane fractions; d, days.
Protein expression of PKC-, PKC-β2, and PKC-ɛ in cytosolic and nuclear fraction of CD34+ cells during EPO stimulation for various times.
CD34+ cells were cultured in medium alone for 24 hours before the addition of EPO (5 U/mL) and then were incubated for various times before cytosolic and nuclear proteins were prepared. The protein expression of PKC-α, PKC-β2, and PKC-ε was determined by Western blotting. (A) A representative of 5 separate experiments is shown. *, not performed. (B) Optical density of PKC-α determined by densitometric imaging of hyperfilms is shown. Mean ± SEM of 5 separate experiments (*P = .028, n = 5). (C) Optical density of PKC-β2 determined by densitometric imaging of hyperfilms is shown. Mean ± SEM of 5 separate experiments (*P = .047, n = 5). (D) Optical density of PKC-ε determined by densitometric imaging of hyperfilms is shown. Mean ± SEM of 3 separate experiments.
Inhibitors of PKC block the erythropoietin-induced erythroid differentiation of CD34+ progenitor cells
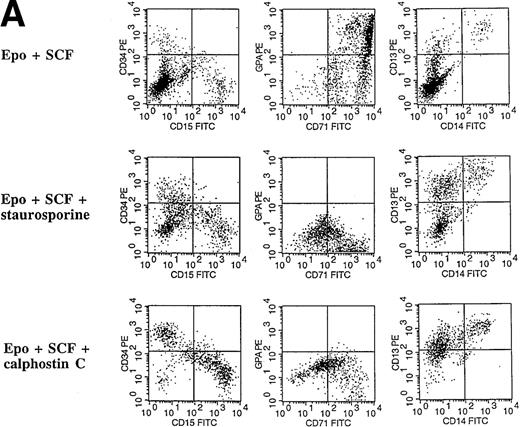
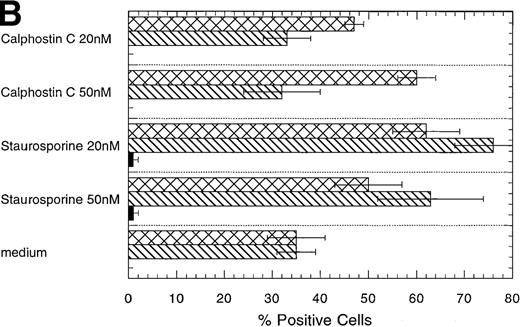
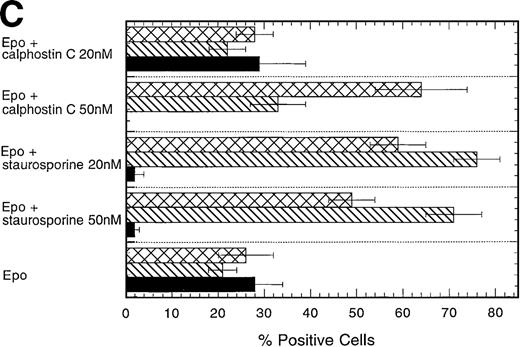
To investigate further the role of PKC isoforms in EPO-signaling in CD34+ progenitor cells, we assessed the effect of the PKC inhibitors staurosporine and calphostin C on this process. The EPO-induced erythroid differentiation of CD34+ cells was significantly inhibited with either straurosporine or calphostin C as determined by the expression of glycophorin A, an erythroid antigen (P = .006; n = 6 and P = .046; n = 3, respectively) (Figure 5C). Notably, staurosporine (50 nmol/L) increased the percentage of CD13+cells from 21% ± 3% to 71% ± 6%, whereas calphostin C (50 nmol/L) increased the percentage of CD13+ cells to 33% ± 6% and the percentage of CD15+ cells from 23% ± 5% to 64% ± 10%. CD13 is a pan myeloid antigen, whereas CD15 is primarily expressed on the granulocytic lineage. A lower concentration of staurosporine (20 nmol/L) induced approximately identical changes (Figure 5C). Cell counts of the cultures showed a 20% or 17% reduction with 50 nmol/L staurosporine or calphostin C, respectively, whereas no reduction in cell number was found with a lower concentration (20 nmol/L) (Table1). Similarly, the PKC inhibitors reduced significantly the percentage of erythroid cells in EPO- and SCF-treated CD34+ cells (P = .004, n = 6 andP = .037, n = 3, respectively) (Figures 5A, 5D). Again the percentage of CD15 granulocytes increased from 8% ± 2% to 36% ± 5% or 60% ± 3% with staurosporine or calphostin C treatment (50 nmol/L), respectively. Cell counts of these cultures showed no reduction in cell number (Table 1). These results indicate that the PKC inhibitors inhibited the EPO-induced erythroid differentiation of the CD34+ progenitor cells, and they are consistent with the notion that the inhibition of PKC activity is necessary for myeloid differentiation.
Effect of the PKC inhibitors staurosporine and calphostin C on the EPO-induced erythroid differentiation of CD34+cells.
CD34+ cells were cultured in medium alone or in the presence of EPO (5 U/mL) or EPO (5 U/mL) and SCF (50 ng/mL), with or without staurosporine (50 nmol/L or 20 nmol/L) or calphostin C (50 nmol/L or 20 nmol/L) for 7 days and then stained with the indicated monoclonal antibodies. (A) Immunophenotyping of CD34+ cells cultured in the presence of EPO and SCF without or with staurosporine (50 nM) or calphostin C (50 nM). A representative of 6 separate experiments is shown. GPA, glycophorin A. CD34+ cells with or without staurosporine or calphostin C were cultured in medium alone (B), in the presence of EPO (C), or in the presence of EPO and SCF (D). indicates the percentage of GPA+ cells, ▧, CD13+ cells, and ▩, of CD15+ cells. Mean ± SEM of 6 separate experiments (3 for the calphostin C results).
Effect of staurosporine and calphostin C on cell number in liquid cultures
| Treatment . | EPO . | . | EPO + SCF . | ||||||||
|---|---|---|---|---|---|---|---|---|---|---|---|
| . | +Staurosporine . | +Calphostin C . | . | +Staurosporine . | +Calphostin C . | ||||||
| Medium . | 50 nmol/L . | 20 nmol/L . | 50 nmol/L . | 20 nmol/L . | 50 nM . | 20 nM . | 50 nM . | 20 nM . | |||
| Total number cells × 106 | 0.34 ± 0.05 | 0.71 ± 0.05 | 0.57 ± 0.03 | 0.73 ± 0.07 | 0.59 ± 0.05 | 0.70 ± 0.08 | 1.37 ± 0.05 | 1.42 ± 0.11 | 1.53 ± 0.15 | 1.34 ± 0.07 | 1.38 ± 0.02 |
CD34+ cells (200 000/well, 1 well/group) were cultured in medium alone or in the presence of EPO or EPO and SCF in the presence or absence of staurosporine or calphostin C. The total cell number was counted after 4 days of culture. Mean ± SEM of three separate experiments.
PKC- but not PKC-β2 is necessary for the erythropoietin-induced differentiation of CD34+ cells
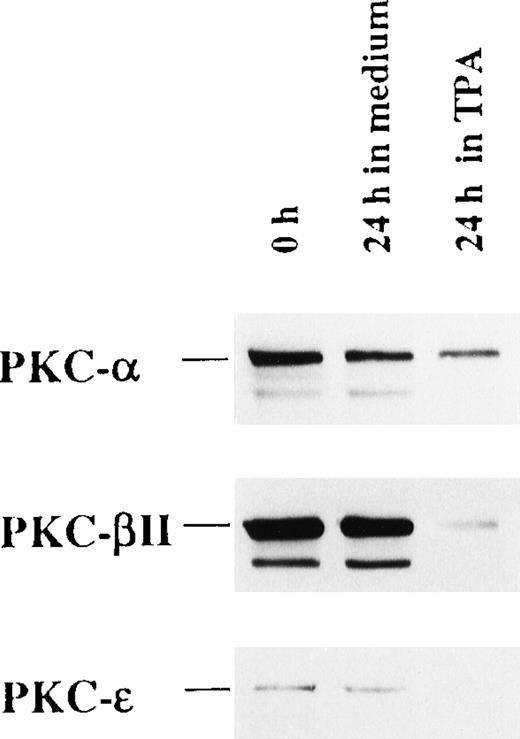
To address the functional role of PKC-α, PKC-β2, and PKC-ε, all of which are expressed by freshly isolated CD34+ cells, we investigated the effect of their depletion by long-term TPA treatment before EPO and SCF stimulation. Exposure of the cells to 100 nmol/L TPA for 24 hours resulted in the depletion of PKC-α, PKC-β2, and PKC-ε by 47%, 92%, and 95%, respectively (Figure6). Interestingly, TPA treatment before the addition of EPO and SCF strongly inhibited erythroid differentiation compared with cells preincubated in medium alone (Table2). Notably, TPA pretreatment increased the percentage of CD13 and major histocompatibility complex class II-positive cells and induced the expression of CD86, indicating development into dendritic cells.
TPA treatment of CD34+ cells down-regulate the expression of PKC-, PKC-β2, and PKC-ɛ.
CD34+ cells were cultured in medium alone or in the presence of 100 nmol/L TPA for 24 hours. Then cytosolic proteins were prepared, and the expression of PKC-α, PKC-β2, and PKC-ε was analyzed by Western blotting.
TPA treatment of CD34+ cells down-regulate the expression of PKC-, PKC-β2, and PKC-ɛ.
CD34+ cells were cultured in medium alone or in the presence of 100 nmol/L TPA for 24 hours. Then cytosolic proteins were prepared, and the expression of PKC-α, PKC-β2, and PKC-ε was analyzed by Western blotting.
TPA treatment of CD34+ cells before EPO- and SCF- addition inhibits the cytokine-induced erythroid differentiation
| Treatment . | % Positive Cells . | |||||||||
|---|---|---|---|---|---|---|---|---|---|---|
| 0-24 Hours . | 24-144 Hours . | CD34 . | GPA . | CD71 . | CD13 . | CD14 . | HLA-DR . | CD83 . | CD86 . | CD41 . |
| Medium | EPO + SCF | 9 ± 4 | 40 ± 5 | 82 ± 3 | 16 ± 4 | 3 ± 1 | 18 ± 4 | 1 ± 1 | 3 ± 3 | 7 ± 3 |
| TPA 100 nmol/L | EPO + SCF | 25 ± 5 | 2 ± 1 | 32 ± 7 | 55 ± 8 | 6 ± 2 | 67 ± 5 | 14 ± 4 | 37 ± 11 | 20 ± 3 |
| TPA 10 nmol/L | EPO + SCF | 17 ± 5 | 2 ± 1 | 19 ± 7 | 56 ± 4 | 4 ± 1 | 62 ± 11 | 6 ± 3 | 23 ± 8 | 21 ± 0 |
CD34+ cells were cultured in medium alone or in the presence of 100 or 10 nmol/L TPA for 24 hours. EPO (5 U/mL) and SCF (50 ng/mL) were added, and this was followed by 6 days of incubation before staining with the indicated mAbs. Mean ± SEM of 3 to 7 experiments. GPA, glycophorin A.
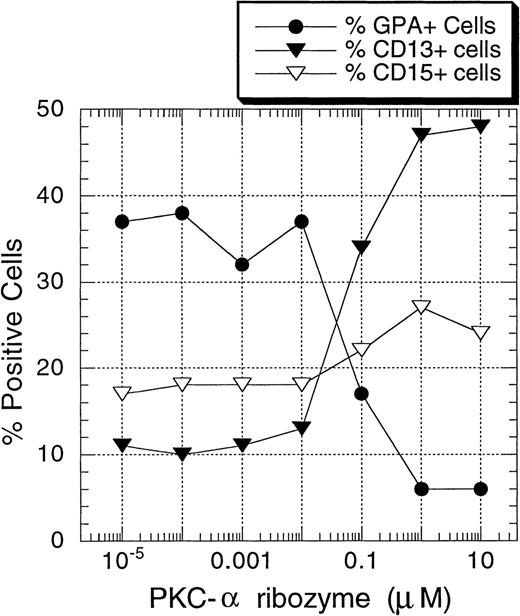
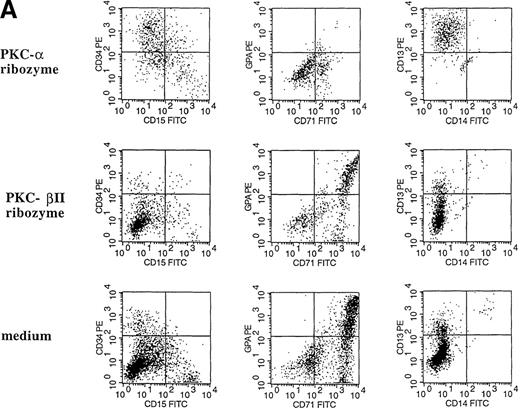
To determine directly the functional roles of PKC-α and PKC-β2 on EPO-induced erythroid differentiation of CD34+ progenitor cells, ribozymes against PKC-α and PKC-β2 mRNA were introduced into CD34+ cells by means of liposomes (DOTAP). The usefulness of various types of liposomes for the delivery of ribozymes into eucaryotic cells, including lipofectin26 and DOTAP,27-29 has been explored. Cationic lipid-mediated ribozyme delivery has the advantage of delivering ribozyme to the cytoplasm without an intermediate endosomal stage, resulting in ribozyme molecule escape from the degradative lysosomal enzymes. To find optimal conditions, the effect of various concentrations of DOTAP on cell viability was tested. At 5 μg/mL, no significant cytotoxic effect was observed. Using these conditions, a significant amount of FITC-labeled ribozyme could be introduced into the cells after 24 hours of incubation (data not shown). Thus, in the additional experiments, cells were incubated with ribozyme/liposome complexes for 24 hours before EPO and SCF stimulation. As shown in Figures7 and 8A, PKC-α ribozyme treatment strongly inhibited the EPO-induced erythroid differentiation of the CD34+ cells (15% ± 5% GPA+ cells compared to 49% ± 6% in DOTAP/medium control; n = 7). Maximal effect was obtained at 1 μmol/L. Treatment of CD34+ cells with this ribozyme increased the percentage of CD13+ cells from 11% ± 3% (medium or DOTAP controls) to 56% ± 7% (n = 7). The observed effect is specific because the treatment of cells with the PKC-β2 ribozyme did not prevent EPO-induced erythroid differentiation (Figure8A).
Concentration-dependent inhibition of EPO-induced erythroid differentiation of CD34+ cells by PKC- ribozyme.
CD34+ cells were incubated at 30 000 cells/well in flat-bottomed, 96-well plates with different concentrations of PKC-α ribozyme for 24 hours. The cells were then stimulated with EPO (5 U/mL) and SCF (50 ng/mL) and cultured for 7 days before they were stained with the indicated mAbs. One representative of 4 separate experiments is shown.
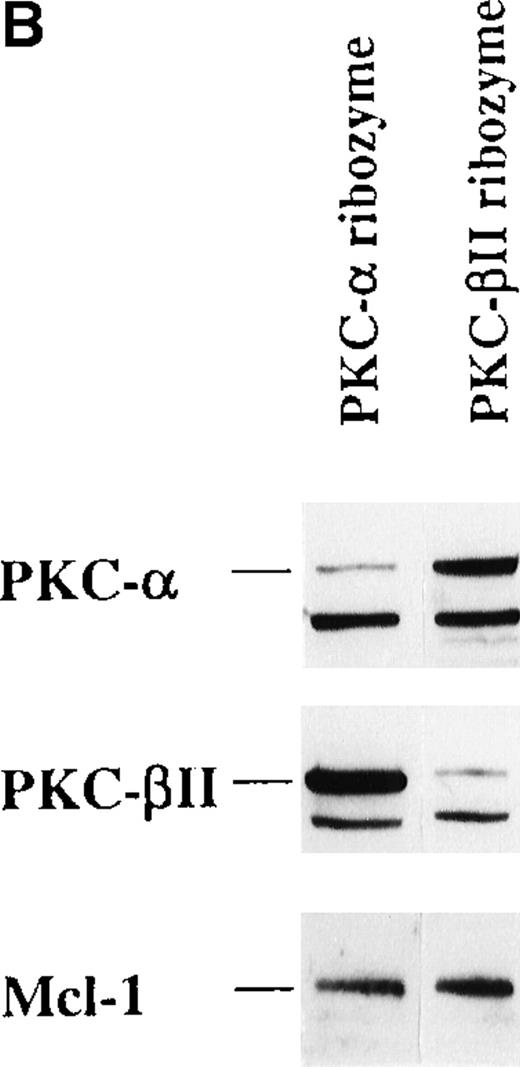
The effect of PKC- and PKC-β2 ribozymes on CD34+ cells cultured with EPO and SCF.
The CD34+ cells were incubated at 30 000 cells/well in flat-bottomed, 96 well plates with PKC-α ribozyme (2 μmol/L), PKC-β2 ribozyme (2 μmol/L), or medium for 24 hours and then stimulated with EPO (5 U/mL) and SCF (50 ng/mL.). (A) Cells were stained with the indicated mAbs 8 days after transfection with ribozymes. (B) Cytosolic proteins were prepared from cells cultured for 6 days after transfection. (C) Cytosolic proteins were prepared from cells cultured for 6 days after transfection. Control cells were transfected with a PKC-ε ribozyme that was not catalytic active. (D) RT-PCR was performed on RNA prepared from cells cultured for 6 days after transfection. PKC-α, 320 bp; actin, 620 bp.
To investigate whether the PKC-α ribozyme had down-regulated its target, the expression of PKC-α in control and ribozyme-treated cells was determined. The protein level of PKC-α was reduced by 82% (Figure 8B). This inhibition was specific because the level of PKC-β2 protein expression was not affected by the PKC-α ribozyme treatment (Figure 8B). Treatment of cells with PKC-β2 ribozyme reduced the PKC-β2 protein expression by 92%, but, as shown in Figure 8A, this treatment had no significant effect on EPO-induced erythroid differentiation of the CD34+ progenitor cells. The level of PKC-ε in PKC-α ribozyme-treated cells was not affected (Figure 8C). In these experiments, a PKC-ε ribozyme that was found to be inactive (unpublished results) was used as a relevant control. Quantitation of PKC-α mRNA by RT-PCR further demonstrated a significant reduction of PKC-α mRNA in PKC-α ribozyme-treated cells compared with medium or with PKC-β2 ribozyme-treated cells (Figure 8D). These results suggest that PKC-α, but not PKC-β2, is important for the EPO-induced erythroid differentiation of human CD34+ progenitor cells.
Discussion
In the current study we investigated the role of different PKC isoforms in CD34+ progenitor cells from bone marrow. PKC-α, PKC-β2, and PKC-ε were expressed in freshly isolated CD34+ cells, whereas PKC-δ, PKC-γ, and PKC-ζ were undetectable. The different PKC isoforms were down-regulated after stimulation of the CD34+ cells with G-CSF and SCF, which predominantly led to the development of myeloid cells. Indeed, none of the tested PKC isoforms were detectable after 4 days of culture. In contrast, stimulation of CD34+ cells with EPO or EPO and SCF for 4 days, which induced erythroid differentiation, led to a marked up-regulation of PKC-α expression compared to medium-treated cells. Only minor up-regulation of PKC-β2 was detected, whereas PKC-ε was usually no longer detectable. Furthermore, we found that EPO induced the activation of PKC-α and PKC-β2, as shown by the translocation of these isoenzymes to the nucleus. Thus, the EPO-induced up-regulation of PKC-α and its nuclear translocation should be biologically relevant for initiation and perhaps for sustained erythroid differentiation. In contrast, myeloid differentiation induced by G-CSF was followed by the down-regulation of PKC-α and PKC-β2.
Several investigators, most of whom have used cell lines and pharmacologic agents to induce erythroid differentiation, have suggested the involvement of PKC in erythroid differentiation.30-34 In this regard, a possible role for PKC in the commitment to erythroid and megakaryocytic lineages has been proposed. The selective PKC antagonist GF109203X was shown to enhance the hemin-increased expression of glycophorin A in human erythroid/megacaryocytic cells.17 On the other hand, the PKC activator PMA induced the development of megakaryocytes. In this respect, Lumelsky and Schwartz18 reported similar findings for human CD34+ progenitor-enriched cells from umbilical cord blood. The addition of PMA drastically inhibited the EPO-induced erythroid differentiation of these cells, even when added as late as 11 days after culture initiation. Consistent with this observation, we found that pretreatment of CD34+ cells with TPA for 24 hours inhibited the EPO-induced erythroid differentiation of CD34+ progenitor cells from bone marrow. As shown in Figure6, TPA treatment strongly reduced the expression of PKC-α, PKC-β2, and PKC-ε. Instead of megakaryocytic development as a response to PMA treatment,18 TPA pretreatment induced dendritic cell differentiation (Table 2). PMA-induced dendritic cell differentiation from CD34+ cells was also shown by Davis et al.35 Furthermore, we found that inhibition of the PKC activity with calphostin C, a specific inhibitor of PKC, highly inhibited the EPO- and SCF-induced erythroid differentiation without affecting the cell number. Calphostin C has been shown to inhibit the development of macrophages from bipotent GM-colony forming cells induced by IL-4, G-CSF, and SCF36 or M-CSF.37In addition, calphostin C inhibited the cytokine-induced translocation of PKC-α to the nucleus in these cells.36 Furthermore, the EPO-induced activation of Raf-1 and mitogen-activated protein kinases (MAPK) in erythroid progenitor cells from fetal liver was inhibited by the pretreatment of cells with the selective PKC inhibitor GF109203X which also inhibited erythroid colony growth by 50%.38 Taken together, these studies demonstrated that PKC has a role in the development of erythroid cells. However, it is still controversial whether activation or down-regulation of PKC is required.
To establish which PKC isoform is involved in EPO-induced erythroid differentiation, of CD34+ progenitor cells, ribozymes designed to act against PKC-α mRNA and PKC-β2 mRNA were used. Similar to the PKC inhibitors staurosporine and calphostin C, the PKC-α ribozyme inhibited the EPO-induced erythroid differentiation of CD34+ cells. No inhibition was observed with the PKC-β2 ribozyme. Thus, this is the first time a crucial role for PKC-α in EPO-induced erythroid differentiation of hematopoietic progenitor cells has been demonstrated. Previously, PKC-α was found to be a determining factor in the commitment of macrophages. Transfection of murine bipotent GM-colony forming cells with a constitutively active PKC-α construct, PKAC, followed by G-CSF and SCF stimulation, increased the percentage of macrophages from 0% to 40% compared with nontransfected cells.39 Recently, Marchisio et al40 proposed that the down-regulation of most classical PKCs may be required for the induction of erythroid differentiation, as a weak expression of PKC-α, PKC-β1, PKC-β2, and PKC-γ were observed. In their study CD34+ cells were incubated with EPO for 9 days and then analyzed. Under these conditions, the early changes induced by EPO were not detected. Such early changes are known to be important in growth factor signaling. Notably, we also observed a decrease in the cytosolic level of PKC-α and PKC-β2 after 72 hours. Furthermore, Bassini et al41recently claimed that erythroid commitment induced by EPO does not seem to involve PKC activation but is accompanied by the down-regulation of specific isoforms, in particular PKC-ε. This was based on the observation that a PKC-ε peptide that specifically inhibits translocation of the isoform in cell lines increased the number of erythroid colonies from CD34+ cells. However, the specific inhibition of PKC-ε translocation in the CD34+ cells was not investigated.41 It is shown in the current study that EPO treatment of CD34+ cells down-regulates the expression of PKC-ε. In contrast, a significant increase was found in the expression and nuclear translocation of PKC-α and PKC-β2 after EPO stimulation of the CD34+ progenitor cells, providing evidence to support the activation and nuclear signaling of PKC-α and PKC-β2 in CD34+ cells. Our data suggest that the activation of PKC-α is important for EPO-induced erythroid differentiation of CD34+ progenitor cells from bone marrow. In accordance with our results, Beckman et al42 found that EPO induced rapid activation of PKC in the nuclei of erythroid progenitor cells from murine fetal livers. Furthermore, PKC-β1 and PKC-β2 were identified as the predominant nuclear isoforms in these cells stimulated by EPO.43 Klingmuller et al44suggested a role for PKC-ε, but not PKC-α, in the EPO-induced growth and differentiation of murine fetal liver. This was based on their observation that 18-hour TPA treatment depleted the activity of PKC-α to basal level in spleen cells, whereas more than 44% of PKC-ε activity occurred in spleen cells but did not impair EPO-induced MAPK activity. Thus, they suggest that EPO-mediated MAPK activation does not require PKC-α but that PKC-ε or other PKC isoforms may be involved.44 In contrast, we demonstrated in the current study that TPA treatment of CD34+ cells reduced the protein level of PKC-ε more than that of PKC-α, indicating different roles for the isoforms in these different progenitor cell populations. Li et al45 show that PKC-ε is involved in proliferation but that it has no influence on the differentiation of murine erythroleukemia clones. These results suggested that the biologic function of PKC isoforms depends on their pattern of expression and on the cell population. However, regardless of the precise role of PKC-ε on the EPO-induced erythroid differentiation of CD34+ cells from human bone marrow, our data suggested an important role for PKC-α. Further experiments are needed to establish the intracellular targets for PKC-α in CD34+cells.
Acknowledgments
The authors thank Lise Forfang for excellent technical assistance and Anne Pharo for providing CD34+ cells from mobilized peripheral blood. This work was supported by the Norwegian Cancer Society and the Norwegian Research Council.
Received May 19, 1999; accepted September 20, 1999.
Reprints:June Helen Myklebust, Department of Immunology, The Norwegian Radium Hospital, N-0310 Oslo, Norway; e-mail:junehm@ulrik.uio.no.
The publication costs of this article were defrayed in part by page charge payment. Therefore, and solely to indicate this fact, this article is hereby marked “advertisement” in accordance with 18 U.S.C. section 1734.








This feature is available to Subscribers Only
Sign In or Create an Account Close Modal