Abstract
Cytokines that stimulate inducible nitric oxide (NO) synthase can suppress the growth and differentiation of normal human bone marrow cells, including megakaryocytes. Since NO promotes apoptosis in other cell systems, we chose to study the determinants of apoptosis in megakaryocytic cells. We show that both exogenous and endogenous sources of NO can induce apoptosis in megakaryocytoid cell lines. The megakaryocyte growth factor thrombopoietin suppresses NO-induced apoptosis, whereas treatment with peroxynitrite, a cytotoxic product formed when NO reacts with superoxide, promotes apoptosis. Superoxide inhibitors suppress NO-induced apoptosis, and pretreatment with megakaryocyte growth and maturation factors attenuates NO-induced apoptosis. These data show that NO modulates megakaryocyte apoptosis and suggest that this process may occur in the cytokine-rich marrow milieu to regulate megakaryocyte turnover.
Increases in nitric oxide (NO) production as a result of inflammatory cytokine release can induce cytotoxicity through myriad mechanisms.1 One of the principal mechanisms of NO cytotoxic action appears to be the inhibition of energy metabolism through detrimental effects on mitochondrial respiration, glycolysis, and the citric acid cycle.2-5 Nitric oxide can bind to the oxygen-binding site of cytochrome oxidase, thereby inhibiting oxygen binding.5,6 Nitric oxide can also bind to the Fe-S clusters in molecules of the respiratory chain, including complex I/II and aconitase,7,8 further limiting cellular respiration. Perhaps the most obvious mechanism by which NO can induce cell death is through direct DNA damage leading to strand breaks. Nitric oxide–regulated apoptosis has been shown to result from the activation of many apoptotic effectors including p53,9,10stress-activated protein kinase (SAPKinase),11caspases,12-17 the Bcl-2 family of proteins,18,19 and cytochrome c.20 21
Nitric oxide evokes these apoptotic actions by several mechanisms, including deamination of cytosine and 5-methylcytosine in DNA, leading to strand breaks, and S-nitrosation of caspases at their active-site cysteine residues, leading to enzyme inhibition.14-17Nitric oxide has also been shown to induce apoptosis through 1 of its reaction products, peroxynitrite. When NO forms in the presence of superoxide, the highly toxic molecule peroxynitrite (ONOO−) results. In experiments in which cells are exposed to NO and superoxide using NO donors and to the redox cycler DMNQ (2,3-dimethoxy-1,4-naphthoquinone) or the hypoxanthine/xanthine oxidase system, respectively, apoptosis results.22 In addition, exposure of HL-60 cells to peroxynitrite leads to activation of PARP cleavage resulting in apoptosis23; peroxynitrite also leads to cytochrome c release24 and altered electron transport.25
The recently cloned ligand for the c-mpl receptor thrombopoietin (TPO) has been shown to be important for the growth, development, and ploidy of megakaryocyte progenitor cells.26 TPO is important for megakaryocyte maturation, producing megakaryocytes that are more mature with increased ploidy values and enhanced cytoplasmic maturation.26 One mechanism that has been proposed to explain TPO's ability to stimulate the growth of megakaryocytes is its ability to prevent apoptosis.27 Borge et al27 have shown, in a subpopulation of bone marrow Lin−Sca−1+megakaryocyte progenitor cells, that TPO prevents apoptosis induced by serum deprivation. TPO has also been shown to suppress apoptosis and to act as a survival factor in another human growth factor–dependent cell line, M07e,28 and to suppress apoptosis in primary human primitive CD34+CD38− bone marrow cells, thereby permitting the maintenance of the cells in culture for a prolonged period.29
In this study we sought to assess the role of NO on apoptosis in megakaryocytic cell lines. Using both endogenous and exogenous sources of NO, we assessed apoptosis with various methods that detect the extent of endonucleosomal cleavage. To address the role of peroxynitrite in NO-induced apoptosis in these cells, we either inhibited superoxide or treated cells with synthetic peroxynitrite. To determine the effects of growth and maturation factors on NO-induced apoptosis, we pretreated the cells with TPO, IL-11,30 or 5-hydroxytryptamine (serotonin) 72 hours before exposure to various sources of NO. By establishing that NO can induce apoptosis in megakaryocytes and that NO-induced apoptosis can be modulated by megakaryocyte maturation factors, we show that NO plays a pivotal role in regulating megakaryocyte turnover.
Materials and methods
Cell culture
Throughout these experiments, we used 2 megakaryocytic cell lines: the Meg-01 cell line, established from the bone marrow of a patient with blast crisis of Philadelphia chromosome–positive chronic myelogenous leukemia,31 and the HEL cell line, established from a patient with human erythroleukemia32 (purchased from American Tissue Type Collection, Rockville, MD). Both cell lines were grown in RPMI 1640 media (GIBCO, Grand Island, NY) supplemented with 10% fetal calf serum.32 For growth factor suppression experiments, Meg-01 cells were cultured in the presence of TPO (100 ng/mL) (gift from Amgen), interleukin-11 (IL-11) (100 μmol/L) (GIBCO), and/or 5-hydroxytryptamine (5-HT) (100 μmol/L) (GIBCO) for 72 hours before treatment with the NO donor or cytokine induction of iNOS. After this pretreatment, the cells were exposed to 10 to 100 μmol/L S-nitrosoglutathione (GSNO) for 90 minutes or exposed to 10 ng/mL IL-1β, 10 ng/mL tumor necrosis factor-α (TNF-α), 10 ng/mL interferon-γ (IFN-γ) (all from GIBCO), and 1 μg/mL lipopolysaccharide (Sigma, St Louis, MO) for 16 hours in the presence or absence of the iNOS inhibitor NG-nitro-monomethyl-L-arginine (100 μmol/L) (Sigma). In co-culture experiments, megakaryocytoid cells treated with the various growth factors were exposed to fibroblasts in which iNOS expression had been induced by cytokine pretreatment. For superoxide inhibition experiments, cells were pretreated with superoxide inhibitors, including oxypurinol, indomethacin, or superoxide dismutase (all purchased from Sigma), or with catalase, for 1 hour before exposure to NO. For cell synchronization experiments, the cells were grown without fetal bovine serum for 24 hours. In experiments designed to assess the role of cyclic guanosine monophosphate (cGMP), the cells were treated with 1 mmol/L 8-Br-cGMP (Sigma) for 2 hours or treated with 50 μmol/L methylene blue (Sigma) for 2 hours.
DNA isolation and terminal transferase labeling
DNA was extracted from 2×10⁶ cells by resuspending the cells in lysis buffer (50 mmol/L Tris-HCl, pH 8.0, 20 mmol/L EDTA, 1% sodium dodecyl sulphate [SDS]) and incubating them with shaking overnight at 50°C in the presence of 0.1 mg/mL proteinase K (GIBCO). DNA was then extracted with phenol/chloroform and precipitated in 100% ethanol. After determination of DNA concentration spectroscopically, 1 μg/sample was end-labeled using terminal transferase (2.5 U) (Boehringer Mannheim, Indianapolis, IN) and [32P] α-dideoxy adenosine triphosphate (50 μCi, 17 pmol; New England Nuclear, Boston, MA) by incubating at 37°C for 60 minutes. The reaction was then terminated using 0.5 mol/L EDTA, and the DNA was precipitated using 10 mmol/L ammonium acetate and 3 vol ice-cold ethanol. The DNA was then centrifuged, and the pellet was resuspended in Tris-EDTA buffer. The sample was loaded on a 2% agarose/TAE gel and resolved by electrophoresis (6.5 V/cm) for approximately 3 hours. After electrophoresis, the gel was dried without heating and then exposed to x-ray film for visualization of endonucleosomal cleavage (DNA laddering).33
DNA end-labeling of cells in situ (TUNEL method)
The cells were fixed onto microscope slides in 4% paraformaldehyde and then incubated in the presence of proteinase K for 30 minutes at 37°C. Twenty-five units of terminal transferase and 2.0 nmol biotin-16–dUTP in terminal transferase buffer (140 mmol/L sodium cacodylate, 25 mmol/L Tris-HCl, pH 8.0, 0.25 mg/mL bovine serum albumin, and 2.5 mmol/L cobalt chloride) were added to the sections and incubated for 1 hour at 37°C. Sections were incubated with stop buffer (300 mmol/L NaCl, 30 mmol/L trisodium citrate) for 15 minutes, rinsed with doubly distilled water, and immersed in phosphate-buffered saline (PBS). Streptavidin peroxidase was added to the section according to the manufacturer's instructions and incubated for 30 minutes. After PBS washings, the sections were stained with aminoethylcarbazole for 5 minutes. In negative controls, the terminal transferase was omitted from the labeling solution (Frag-EL Kit; Oncogene, Cambridge, MA).34
COMET assay for detection of cells containing damaged DNA
Apoptosis in megakaryocytoid cells was quantified by the single-cell microgel electrophoresis assay (COMET assay).35Megakaryocytoid cells were exposed to various concentrations of GSNO or cytokines known to stimulate iNOS expression. The cells were then embedded in situ in 1% agarose and exposed to alkaline lysis buffer (2.5 mol/L NaCl, 1% Na-lauryl sarcosinate, 100 mmol/L EDTA, 10 mmol/L Tris base, 1% hydrogen peroxide, and carbonyl-free Triton X-100) for 30 minutes, followed by 15 minutes equilibration in electrophoresis buffer containing 300 mmol/L NaOH, 10 mmol/L EDTA, pH 10, 0.1% hydroxyquinoline, and 0.02% dimethyl sulfoxide. The nuclei were subsequently electrophoresed for 25 minutes at 2 V/cm, followed by staining with YOYO-1 (3 μmol/L) and visualized with a fluorescence microscope equipped with a fluorescein isothiocyanate filter. Between 100 to 200 COMETs per treatment were scored in a blinded fashion and assigned as type A, B, or C by visual inspection based on the appearance of the nucleus and the presence of a “tail” (A, circular nucleus, no apoptosis; B, circular nucleus with tail, consistent with apoptosis; C, large nucleus with diffuse tail, consistent with apoptosis).35
p53 Immunoprecipitation and Western blotting
Cells were incubated with the NO donor or with cytokines for induction of iNOS to produce NO. After treatment, the cells were lysed for 20 minutes in lysis buffer (50 mmol/L Tris, pH 8.0, 5 mmol/L EDTA, 150 mmol/L NaCl, 0.5% Nonidet-40, and 1 mmol/L phenylmethylsulfonyl fluoride). Lysed cells were then centrifuged, and the supernatant was incubated with 50% (vol/vol) protein A–Sepharose for 30 minutes at 4°C followed by centrifugation for 15 minutes; p53 was immunoprecipitated overnight at 4°C by adding p53 antibody. Immune complexes were collected by centrifugation and washed 3 times with wash buffer. Finally, samples were resuspended in sample buffer (125 mmol/L Tris, pH 6.9, 2% SDS, 10% glycerin, 1 mmol/L dithiothreitol, and 0.002% bromophenol blue) and boiled for 5 minutes. Proteins were separated on a 10% SDS–polyacrylamide gel and blotted onto nitrocellulose membranes. The sheets were washed twice with PBS containing 0.1% Tween-20 before blocking the nonspecific binding sites with PBS and 5% powdered milk for 1 hour at room temperature. The p53 antibody (PharMingen, San Diego, CA) was added and incubated overnight at 4°C. The nitrocellulose sheets were washed 3 times and then incubated with antirat horseradish peroxidase–-conjugated antibody diluted in PBS/0.5% powered milk for 1 hour followed by the ECL kit detection (Amersham, Arlington Heights, IL).
Stress-activated protein kinase assay
Stress-activated protein kinase SAPK/JNK assay was determined using a commercial assay (New England Bio-Labs, Beverly, MA). This nonradioactive method uses an N-terminal c-Jun fusion protein bound to glutathione–Sepharose beads to precipitate SAPK/JNK specifically from cell lysates. The c-Jun protein contains a high-affinity binding site for SAPK/JNK located in proximity to 2 phosphorylation sites, Ser63 and Ser73. The precipitated protein was then used to perform a kinase reaction in the presence of cold adenosine triphosphate, and c-Jun phosphorylation was selectively measured using a phospho-specific c-Jun antibody.
CPP32 enzymatic activity
CPP32 (caspase-3) activity was determined using a commercial assay (Clontech, Palo Alto, CA) that provides a means of measuring CPP32 protease activity in mammalian cell lines. The method detects the shift in fluorescence emission of 7-amino-4-trifluoromethyl coumarin (AFC) when the AFC-substrate conjugate DEVD-AFC is cleaved by CPP32. The free AFC emits yellow-green fluorescence at 505 nm as compared with the blue fluorescence at 400 nm emitted by the uncleaved substrate. Comparison of the fluorescence produced by the apoptotic sample with an uninduced control allows the determination of the units of protease activity.
RT-PCR for iNOS
Total RNA was extracted from treated and untreated megakaryocytoid cells using RNAsol (Biotecx Labs, Houston, TX). Contaminating DNA was digested using RNase-free DNase I (Boehringer Mannheim). Reverse transcription was carried out using 150 ng total RNA in 20 μL reaction mixture containing 50 mmol/L Tris-HCl, pH 8.3, 75 mmol/L KCl, 3 mmol/L MgCl2, 10 mmol/L dithiothreitol, 0.5 mmol/L of each dNTP, 200 U Superscript reverse transcriptase (GIBCO), and 10 μg/mL oligo dT16. After incubation at 42°C for 1 hour, the reaction was stopped by incubation at 70°C for 5 minutes. A nested primer PCR reaction was carried out using 10 μL from the reverse transcription reaction in 10 mmol/L Tris-HCl, pH 8.3, 50 mmol/L KCl, 1.5 mmol/L MgCl2, 200 μmol/L of each dNTP, and 2.5 U Taq DNA polymerase (Boehringer Mannheim). Primer sequences used for the first amplification of iNOS were 5′catcatggaccaccactaggctga and 5′ccaggtgggacagcttctgatcaa, and for the second round of amplification they were 5′cctcccatgtctgggagcatcac and 5′ccagggcagtctccattgccaaac. Primers were added at a final concentration of 1.0 μmol/L, and amplification was performed in a DNA thermal cycler. A second PCR reaction was carried out using 10 μL of the original PCR mixture and the nested primer pair under the same conditions. Amplified products were analyzed by 1.5% agarose gel electrophoresis and visualized under UV illumination after staining with ethidium bromide.
Western blotting for Bcl-2 and Bax
Western blot analysis was performed according to the standard protocol. Cells were lysed in lysis buffer containing (0.1% Nonidet P-45, 50 mmol/L HEPES, pH 7.6, 50 mmol/L KCl, 10 mmol/L EGTA, 2 mmol/L MgCl2, 1 mmol/L dithiothreitol, and 1 mmol/L phenylmethylsulfonyl fluoride), centrifuged to collect the cell lysate, and resolved by SDS–polyacrylamide gel electrophoresis. After transfer to nitrocellulose, the filter was incubated with varying dilutions of the anti-Bax or anti-Bcl-2 antibody (PharMingen) followed by incubation with a 1:1000 dilution of secondary goat antirabbit horseradish peroxidase–conjugated antibody (Amersham). Bound antibody was visualized using the ECL kit (Amersham) according to the manufacturer's instructions.
Synthesis of GSNO
S-nitrosoglutathione was synthesized at 25°C by combining equimolar (200 mmol/L) concentrations of reduced glutathione and sodium nitrite in 0.5 mol/L HCl, as previously described.36
Synthesis of peroxynitrite
Peroxynitrite was prepared by combining 0.6 mol/L sodium nitrite with 1.75 mol/L hydrogen peroxide in the presence of 1 mol/L HCl and 1.5 mol/L NaOH. The UV spectrum of the solution was analyzed after 15 minutes at 302 nm for concentration determination (ελONOO− = 1670 mol/L−1 cm−1) and stored at −70°C until use.
Nitrite/nitrate analysis
Nitrate was converted to nitrite by incubation with nitrate reductase (Sigma) in the presence of NADPH (Sigma). Total nitrite was measured by the Griess reaction.37 Briefly, the sample was incubated with an equal volume of Griess reagent (naphthylethylenediamine dihydrochloride [0.1% wt/vol] plus sulfanilamide [1% wt/vol in 5% H3 PO4vol/vol]) at room temperature, and the absorbance was read at 540 nm. Nitrite concentration was determined using sodium nitrite as a standard.
Statistics
All values are presented as mean ± SD. Pairwise comparisons were performed using the Student t test. Groups of data were subjected to analysis of variance with post hoc Newman–Keul comparisons. P < .05 was considered statistically significant.
Results
S-nitrosoglutathione and DNA fragmentation
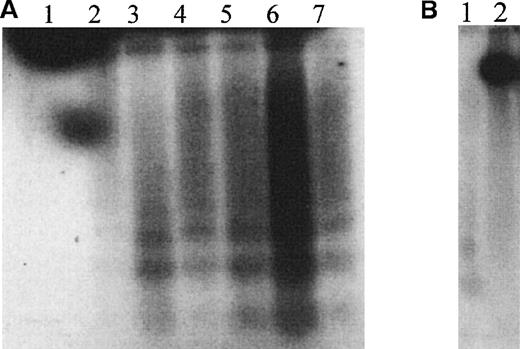
HEL cells treated with the NO donor GSNO exhibited “DNA laddering” that was detectable using terminal transferase radiolabeling (Figure 1A). Laddering was visible as early as 1 hour after treatment and was still present after 8 hours of exposure. Induction of endogenous iNOS by treatment with 10 ng/mL IL-1β, 10 ng/mL TNF-α, 10 ng/mL IFN-γ, and 1 μg/mL endotoxin also produced endonucleosomal cleavage of DNA, an effect that was prevented by simultaneous treatment of the induced cells with the NOS inhibitor NG-monomethyl-L-arginine (L-NMMA) (Figure1B).
GSNO and HEL cell endonucleosomal DNA cleavage.
(A) Autoradiographic analysis of total cellular DNA prepared from HEL cells after treatment with 100 μmol/L GSNO for different times and 3′-end labeled (1 μg DNA/lane). The characteristic endonucleosomal fragmentation of DNA into 185-bp multiples is visible as early as 30 minutes after treatment with 100 μmol/L GSNO. 1, Untreated HEL cells; 2, HEL cells treated with 100 μmol/L GSNO for 30 minutes; 3, for 1 hour; 4, for 2 hours; 5, for 3 hours; 6, for 4 hours; and 7, for 5 hours. (B) Autoradiographic analysis of total cellular DNA prepared from HEL cells after induction of endogenous iNOS, as described in “Materials and methods.” 1, Cytokine induction of iNOS; 2, cytokine induction of iNOS in the presence of L-NMMA.
DNA fragmentation by TUNEL labeling
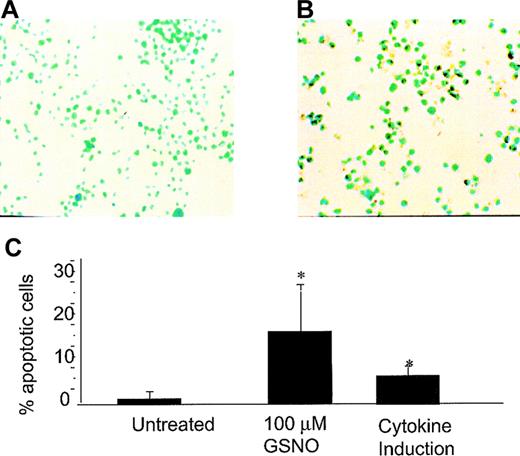
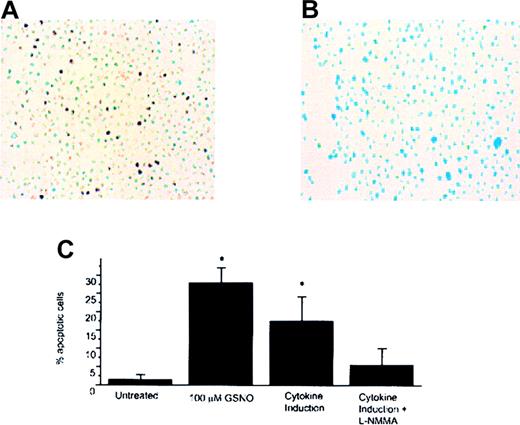
Using the TUNEL technique in which the free 3′-ends of DNA are labeled with dUTP–biotin by terminal transferase, we found that both GSNO donor treatment and iNOS induction produced TUNEL-positive cells in both cell lines tested (Meg-01 and HEL cells) (Figures2 and 3, respectively). Meg-01 cells exposed to 100 μmol/L GSNO were TUNEL-positive and had an apoptotic index (percentage apoptotic cells) of 17% as early as 30 minutes after treatment. Cytokine induction of iNOS in Meg-01 cells also produced TUNEL-positive cells with an apoptotic index of 8%, an effect not observed in uninduced cells (0% apoptotic index) (Figure 2C). HEL cells exposed to 100 μmol/L GNSO were TUNEL-positive and had an apoptotic index of 27% (Figure 3C). Cytokine induction of iNOS in HEL cells led to TUNEL positivity with an apoptotic index of 17%, an effect that was decreased by simultaneous treatment with L-NMMA (4% apoptotic index). To establish that cytokine induction led to transcriptional activation of iNOS under these experimental conditions, RT–PCR was used to monitor iNOS steady-state mRNA. After cells were induced to express iNOS mRNA by cytokine stimulation, a 230-bp product could be visualized using iNOS-specific primers (see Figure 5C). This product was not present in cells that were not induced to express iNOS by cytokine induction.
GSNO or iNOS induction and Meg-01 TUNEL assay.
(A) Untreated Meg-01 cells (YOYO-1 DNA stain; 40× magnification). (B) Meg-01 cells treated with 100 μmol/L GSNO showing TUNEL-positive cells (YOYO-1 DNA stain; 40× magnification). (C) Percentage apoptotic cells visible by TUNEL assay. To calculate the percentages in each case, 5 to 10 random fields were examined, and each bar graph on the plot represents the average of these experiments (*P < .05).
GSNO induction and HEL TUNEL assay.
(A) HEL cells treated with cytokines to stimulate the expression of iNOS and TUNEL-positive cells (YOYO-1 DNA stain; 40× magnification). (B) HEL cells treated with cytokines to stimulate expression of iNOS and incubated with 100 μmol/L L-NMMA showing decreased TUNEL-positive cell staining (YOYO-1 DNA stain; 40× magnification). (C) Percentage of apoptotic cells that were visible by TUNEL assay. 5 to 10 random fields were examined to calculate the percentages in each case, and each bar in the plot represents the average of 3 experiments (*P < .05).
Apoptosis in megakaryocytoid cells grown in co-culture with fibroblasts
Meg-01 cells grown in co-culture with fibroblasts induced to express iNOS were TUNEL-positive and had an apoptotic index of 33% compared with control Meg-01 cells co-cultured with uninduced fibroblasts (0% apoptotic index). The NOS inhibitor L-NMMA significantly attenuated the apoptotic response in Meg-01 cells co-cultured with fibroblasts induced to express iNOS (3% apoptotic index). To affirm that NO was generated by the fibroblasts and that its oxidative byproducts were present in the media, nitrite/nitrate (NOx) measurements were made on the conditioned media using the Griess reaction. We found a statistically significant increase in NOx (P < .001) measured as nitrite in the media of Meg-01 cells grown in co-culture with NO-producing fibroblasts (6.1 ± 3.5 μmol/L/mg per mL protein) in comparison to fibroblasts that were not induced to suppress iNOS (0.6 ± 0.02 μmol/L/mg per mL protein).
COMET assay
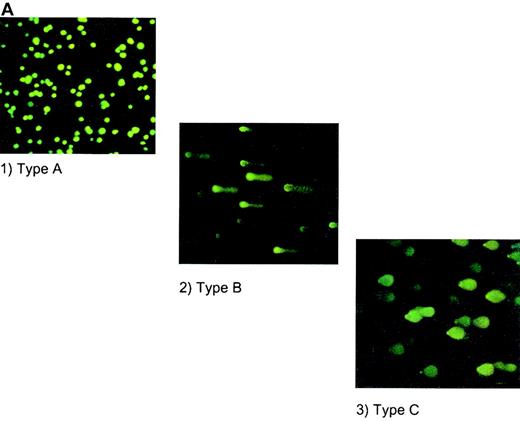
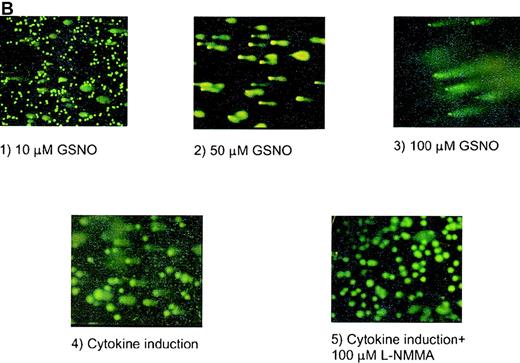
The highly sensitive COMET assay was also used to monitor apoptotic responses of human megakaryocytoid cell lines. In this assay, endonucleosomal fragmentation of DNA is identified as a tail extending from the cell's nucleus after electrophoretic separation of the fragments and staining with YOYO-1 dye. The tails are grouped as types A, B, and C (Figure 4A) according to the extent of change in the morphology of the nucleus and the fragmented “tail.” Using this method, we observed that incubation of Meg-01 cells with GSNO, at concentrations as low as 10 μmol/L, for 1.5 hours produced apoptosis in 33% ± 10% of cells, whereas only 3% ± 1% of untreated cells were apoptotic. Similarly, cytokine induction of iNOS produced apoptosis in 66% ± 12% of cells, an effect that was prevented by coincubation with the NOS inhibitor, L-NMMA (Figure 4B). In co-culture experiments in which NO was produced by cytokine induction of iNOS in fibroblasts, 26% ± 4% of cells were apoptotic according to this assay (data not shown).
HEL cell COMET assay.
(A) Depiction of different types of COMETs. (B) HEL cells treated with (1) 10 μmol/L GSNO (10× magnification); (2) 50 μmol/L GSNO (40× magnification); (3) 100 μmol/L GSNO; (4) cytokines to stimulate iNOS; and (5) cytokines in the presence of L-NMMA. YOYO-1 DNA stain was used on all parts of Figure 4.
p53 immunoprecipitation and Western analysis
HEL cells stimulated to produce NO by iNOS induction or iNOS induction in conjunction with L-NMMA incubation showed no increase in p53 protein expression after treatment. HEL cells treated with 100 μmol/L GSNO for variable time periods, ranging from 30 minutes to 8 hours, also showed no increase in expression of p53 protein (data not shown). While these experiments were being conducted, Abo et al38 showed that cell lines established from patients with erythroblastic leukemia carry a mutation in the p53 gene that results in the up-regulation of p53 expression and a high basal level of p53, thereby potentially masking any possible effects of NO on the regulation of p53 expression.
SAPKinase assay
No up-regulation of SAPKinase activity could be detected after cytokine induction of iNOS. This activity was also not affected by co-incubation with the NOS inhibitor L-NMMA (data not shown.) In addition, no increase in SAPKinase activity was apparent after treatment with 100 μmol/L GSNO (data not shown).
CPP32 assay
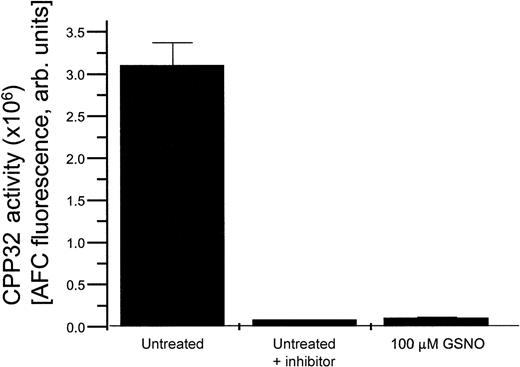
HEL cells exposed to various concentrations of GSNO in the presence or absence of the specific CPP32 enzymatic inhibitor DEVD all demonstrated a decrease in CPP32 enzymatic activity in comparison to untreated cells (Figure 5). This effect is likely caused by S-nitrosation of the active site cysteine present in CPP32, which suppresses its activity.15
HEL cell CPP32 activity.
CPP32 enzymatic activity present in untreated HEL cells, HEL cells treated with a CPP32 inhibitor, and HEL cells treated with 100 μmol/L GSNO.
HEL cell CPP32 activity.
CPP32 enzymatic activity present in untreated HEL cells, HEL cells treated with a CPP32 inhibitor, and HEL cells treated with 100 μmol/L GSNO.
Bax and Bcl-2 Western blot analysis
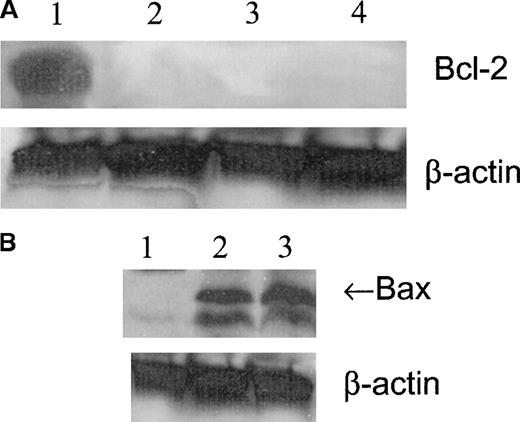
Western blot analysis showed that the expression of Bcl-2 was high in untreated cells and was not present after 1, 2, or 4 hours of treatment with 100 μmol/L GSNO (Figure6A). Bax expression was not detected in untreated cells but was visible after 1 hour of treatment with 100 μmol/L GSNO (Figure 6B). Based on these results, it appears that NO-induced apoptosis of megakaryocytoid cells is associated with a change in the balance of the expression of survival and of apoptotic members of the Bcl-2 family. The expression of the pro-apoptotic molecule Bax increases concomitantly with a decrease in the expression of the anti-apoptotic molecule Bcl-2, thereby promoting the apoptotic response.
Meg-01 cell Bcl-2 and Bax expression.
(A) Western blot analysis of Bcl-2 expression in Meg-01 cell lysates after treatment with 100 μmol/L GSNO for varying times. Lane 1, untreated cells; lane 2, 1 hour of treatment; lane 3, 2 hours of treatment; lane 4, 4 hours of treatment. (B) Western blot analysis of Bax expression in Meg-01 cell lysates after treatment with 100 μmol/L GSNO for varying times. Lane 1, untreated; lane 2, 1 hour of treatment; lane 3, 2 hours of treatment.
Effect of superoxide and peroxynitrite on nitric oxide–induced apoptosis
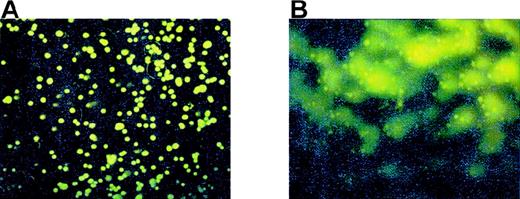
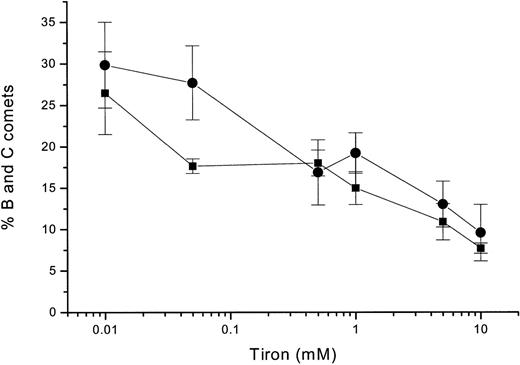
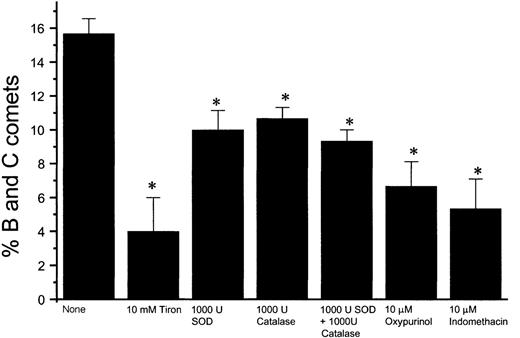
Using the COMET assay, we found that Meg-01 cell apoptosis occurs within 10 minutes of exposure to 8 μmol/L authentic peroxynitrite (Figure 7B). To determine whether the apoptosis we observed after exposure to NO could be related to the formation of peroxynitrite, we used Tiron, a chelator of superoxide. When cells were pretreated for 1 hour with Tiron before exposure to 10 μmol/L GSNO, there was a significant decrease in COMET-positive cells (Figure 8). When the cells were pretreated with Tiron before exposure to iNOS induction by cytokine treatment, there also was a statistically significant decrease in the percentage of B and C COMET in comparison with cells not pretreated with Tiron before iNOS induction (see Figure 10). In experiments in which HEL cells were grown in co-culture with NO-producing fibroblasts, pretreatment with 10 mmol/L Tiron decreased the percentage of B and C COMET compared with cells that were not pretreated before exposure to the fibroblast-derived NO (Figure9). Inhibition of apoptosis in HEL cells pretreated with Tiron was observed when other superoxide inhibitors were used, including superoxide dismutase, catalase, oxypurinol, and indomethacin (Figure 9).
Peroxynitrite and Meg-01 COMET formation.
(A) Control Meg-01 cells or (B) Meg-01 cells exposed to 8 μmol/L peroxynitrite for 10 minutes.
Peroxynitrite and Meg-01 COMET formation.
(A) Control Meg-01 cells or (B) Meg-01 cells exposed to 8 μmol/L peroxynitrite for 10 minutes.
HEL cells COMET formation and Tiron.
Percentage of B and C COMET after treatment of HEL cells with 10 μmol/L GSNO for 120 minutes in the presence of various concentrations of Tiron (circles). Percentage of B and C COMET after cytokine induction of iNOS in HEL cells for 16 hours in the presence of various concentrations of Tiron (squares). Each point represents the average of 3 experiments.
Effect of antioxidants on NO-induced HEL cell apoptosis.
Percentage of B and C COMET achieved by exposure to NO produced in co-culture by fibroblasts in which iNOS had been induced in the presence of various superoxide inhibitors, including superoxide dismutase (SOD), catalase, oxypurinol, indomethacin, and Tiron (*P < .02).
Suppression of nitric oxide–induced apoptosis by the megakaryocyte maturation factor, TPO
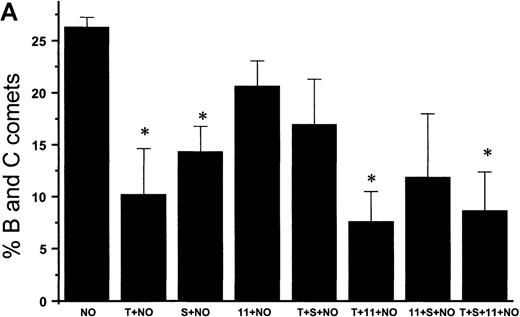
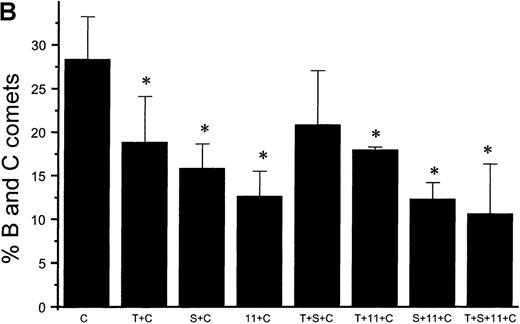
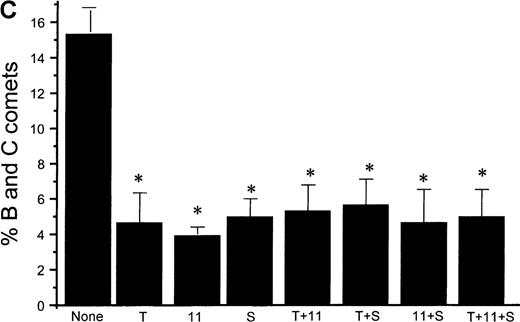
Using the COMET assay, we showed that pretreatment of HEL cells with TPO for 72 hours significantly reduced the percentage of apoptotic cells produced by 10 μmol/L GSNO or after iNOS induction (11% ± 7%, P < .001 and 3% ± 1%,P = .002, respectively, compared with control cells not treated with TPO) (Figures 10A and 10B). Pretreatment of HEL cells with 100 μmol/L IL-1β or 100 μmol/L 5HT (serotonin) alone or in combination with TPO also led to a significant decrease in the percentage of apoptotic cells produced by GSNO exposure. To study paracrine regulation of NO-induced apoptosis, HEL cells were grown in the presence of NO-producing fibroblasts. In these sets of experiments, we again observed a decrease in apoptosis after pretreatment of the cells with TPO alone or in combination with other maturation factors (4% ± 2%) (Figure 10C).
NO-induced HEL cell apoptosis and effect of TPO.
(A) Percentage of B and C COMET produced by treatment with 10 μmol/L GSNO (NO) in the presence or absence of 100 ng/mL TPO (T), 100 μmol/L IL-11,11 or 100 μmol/L serotonin (S) pretreatment. (B) Percentage of B and C COMET produced by treatment with cytokines (C) to induce iNOS in the presence or absence of TPO IL-11 or serotonin. (C) Percentage of B and C COMET achieved by exposure to NO produced by co-culture with fibroblasts in which iNOS had been induced, in the presence of TPO, IL-11, or serotonin. In all experiments, treatment with TPO, IL-11, or serotonin in the absence of a source of NO did not lead to the production of B and C COMET (0%). Each bar represents the average of 3 experiments (*P < .05).
Discussion
We have established that NO can induce apoptosis in 2 megakaryocytoid cell lines, Meg-01 and HEL cells. We found that both exogenous and endogenous sources of NO can regulate apoptosis in these cell lines. A potential paracrine source of endogenous NO was demonstrated by co-culture with cytokine-induced fibroblasts, a representative cell of the bone marrow stroma. We have also shown that a potential mechanism by which NO induces apoptosis in megakaryocytes involves the modulation of the Bcl-2 family of proteins. In addition, we have shown that the apoptotic effect of NO in these cell lines is not dependent on caspase-3 activation, a phenomenon recently observed in several other types.39-42 Megakaryocyte maturation factors, including TPO, can suppress NO-induced apoptosis. To establish whether the apoptotic response is the result of peroxynitrite formation, we pretreated the cells with the superoxide inhibitor Tiron and showed a decreased apoptotic response.
Although NO-induced apoptosis has been observed in other cell systems, its implications in megakaryocytopoiesis are particularly worthy of consideration. Because megakaryocytes are responsible for platelet production, any factors that influence the development and maturation of the megakaryocyte may provide insights into the process of platelet formation (thrombopoiesis). Based on the fact that induction of iNOS activity can result in a decrease in bone marrow stem cell colony-forming units,43 we chose to explore whether 1 factor may influence megakaryocyte apoptosis and potentially platelet formation, namely NO. Inducible NOS has been implicated as a negative regulator of megakaryocyte development because certain cytokines that stimulate iNOS expression (INF-γ and TNF-α) have been found to inhibit megakaryocyte maturation and to suppress hematopoiesis.44 In addition, the expression of various inflammatory stimuli and cytokines can suppress the growth and differentiation of normal human bone marrow cells.43Together, these observations suggest that iNOS is an important regulator of megakaryocytopoiesis.
It is interesting to note that in these megakaryocytoid cells, NO-induced apoptosis appears to be caspase independent. Recent evidence suggests that caspase activity inhibits apoptosis by S-nitrosation of the caspase active site.15 Our results run counter to this view because NO suppresses caspase activity yet promotes apoptosis in these megakaryocytoid cells. Thus, the role of NO as both an inducer and a suppressor of apoptosis represents yet another Janus-like activity of this ubiquitous molecule that appears to be cell-type specific.
Our results establish that NO works in concert with megakaryocyte maturation factors to modulate megakaryocyte turnover and, by inference, platelet formation. When the megakaryocytoid cells were pretreated with megakaryocyte maturation factors, there was a decrease in the apoptotic response to NO. One such factor, TPO, has been shown to regulate megakaryocyte apoptosis and promote cell survival. Ritchie and colleagues29 suggest that treatment with TPO leads to a conformational change in the promoter region of p53. The authors state that wild-type p53 exists as a conformationally flexible phosphoprotein that undergoes a conformational change in the presence of growth factor stimulation such that it has a diminished ability to mediate apoptosis.29 These investigators showed that along with changes in p53, TPO also led to down-regulation of Bax protein expression in M07e cells. Thus, the authors have provided 2 mechanisms by which TPO may suppress apoptosis in megakaryocytes and, thereby, potentiate cell survival.
Based on the importance of megakaryocyte maturation factors in the survival of megakaryocytes, the stage of megakaryocytopoiesis during which the megakaryocyte is exposed to NO may be critical for cell survival. The presence of maturation factors such as TPO could therefore be essential to protect a cell from NO-induced apoptosis. Once the megakaryocytes reach a critical stage of maturation, however, these maturation factors may no longer be protective, and apoptosis may occur. The idea of a window of time during which maturation factors exert their effects is not unfounded. There have been reports showing that the presence of TPO during early megakaryocytopoiesis is essential for cell survival, yet once the megakaryocyte has fully matured and has entered the terminal stage of platelet formation, the presence of TPO no longer has a protective effect. Borge et al30 showed that regardless of whether TPO was present, the megakaryocytes eventually reached a commitment point for platelet production beyond which TPO no longer played a role in cell survival.
The loss of a survival response to TPO coincides with the current theories of megakaryocyte senescence in association with platelet production. It has been suggested that the process by which megakaryocytes produce platelets involves apoptosis.45Whether this apoptosis directly results in platelet formation is unknown. When megakaryocytes have completed the process of thrombopoiesis, however, they senesce and undergo apoptosis. In either case, the results we present here suggest that NO, as an inducer of apoptosis, may play a role in defining the terminal stages of megakaryocyte maturation (and, by implication, platelet formation).
We have also shown that apoptosis is partly caused by the formation of peroxynitrite. The cytotoxic effects of peroxynitrite involve initiation of lipid peroxidation, oxidation of sulfhydryl groups, and inactivation of respiratory enzymes in the mitochondrial electron transport chain.46 The observation that some cells appear to be protected from apoptosis on exposure to NO whereas others are killed by exposure to NO has been explained on the basis of the ability of NO to react with other molecules in its environment. The response of a cell to NO has been linked to the cell's ability to release oxygen radicals simultaneously, specifically superoxide, and, thereby, to produce peroxynitrite, removing free NO from the cellular environment in the process. Sandau et al47 established that the balanced, simultaneous generation of both radicals is nondestructive for mesangial cells or macrophages, whereas the unopposed production of either radical on its own can result in induction of apoptosis. If either form is produced in excess, the cell will not survive. Survival appeared to depend on the level of intracellular glutathione (GSH) because the depletion of GSH by preincubation with buthionine sulfoximine resulted in cell death. In addition, increasing intracellular concentrations of GSH with glutathione monoethyl ester attenuated apoptotic responses in vascular smooth muscle cells.48 Thus, it appears that GSH is important for the detoxification of these oxidative and nitrosative species. By pretreating the cells with factors that reduce the formation of superoxide, we were able to suppress, but not eliminate, the apoptotic response. Yet there remained a level of apoptosis related directly to NO. In addition, peroxynitrite itself was able to evoke an apoptotic response in this system, complicating the interpretation of the role of each of these species in megakaryocytoid cell death. We interpret these data in aggregate to suggest that the protective effect of superoxide scavenging may not necessarily be related to the protective role of GSH in other models.
We have, therefore, established that NO regulates megakaryocyte apoptosis. Work is ongoing to attempt to relate NO-induced apoptosis to the stages of megakaryocyte maturation, specifically to the terminal stages during which platelets are formed.
Acknowledgment
The authors thank Stephanie Tribuna for expert technical assistance.
Supported in part by National Institutes of Health grants HL48743, HL55993, HL58976, and HL61795, and by a Merit Review Award from the U.S. Veterans Administration.
Reprints:Joseph Loscalzo, Evans Department of Medicine, Boston University School of Medicine, 700 Albany St, W507, Boston, MA 02118; e-mail: jloscalz@bu.edu.
The publication costs of this article were defrayed in part by page charge payment. Therefore, and solely to indicate this fact, this article is hereby marked “advertisement” in accordance with 18 U.S.C. section 1734.

This feature is available to Subscribers Only
Sign In or Create an Account Close Modal