Abstract
Because thrombin-treated tumor cell-induced metastasis increases tumor nodule volume12 greater than nodule number, we studied the effect of thrombin on tumor cell growth in vitro and in vivo (murine B16F10 melanoma, human HCT8 colon carcinoma, DU145 prostate carcinoma). Tumor cell growth was measured after 3 to 7 days in 1% fetal calf serum (FCS) + RPMI 1640. We found that, whereas relatively low concentrations of thrombin, 0.1 to 0.5 U/mL (1-5 nmol/L) enhance tumor cell growth in vitro approximately 2- to 3-fold, higher concentrations, 0.5 to 1 U/mL (5-10 nmol/L) impaired cell growth approximately 2- to 4-fold. Impaired cell growth was associated with cell cycle arrest at G2M and increased pre-GoDNA, as well as apoptosis, measured by tumor cell binding to Annexin V and propidium iodide. Apoptosis was reversed with the general caspase inhibitor, FK-011. The enhancing and inhibiting effects were specific for thrombin (reversed with inactive diisopropyl-fluorophosphate [DFP]-thrombin) and mediated via the protease-activated receptor 1 (PAR-1). PAR-1 activation was demonstrated by (1) use of a cell line, B16F10, devoid of the 3 other thrombin receptors, PAR-3, PAR-4, and GPIb; and (2) greater sensitivity of PAR-1 transfected B16F10 and HCT8 cells to impaired cell growth/apoptosis, 3- and 14-fold, respectively. Thus, thrombin has a bimodal effect on PAR-1 in tumor cells: enhanced growth at low concentration, impaired growth/apoptosis at higher concentration.
Thrombin, a serine protease generated after endothelial cell damage, is a multifunctional protein involved in a variety of biologic functions, including blood coagulation, platelet adhesion, platelet aggregation, fibroblast and smooth muscle cell mitogenesis, and tumor metastasis.1,3-5 The role of thrombin in stimulating tumor cell adhesion to platelets,1,4endothelial cells,5 fibronectin,1,4 and von Willebrand factor1,4 is well documented, and probably contributes to the 10- to 156-fold increase in experimental pulmonary metastasis noted after injection of thrombin-treated syngeneic tumor cells into the tail vein of mice.1 Because recent studies indirectly suggested that thrombin may also be enhancing tumor cell growth, as well as adhesion in an experimental pulmonary metastasis model,2 we examined the direct effect of thrombin on tumor cell growth in vitro.
In studying the action of thrombin on tumor cell growth in vitro, we unexpectedly noted impaired tumor cell growth with concentrations of thrombin at approximately 0.5 to 1 U/mL (5-10 nmol/L) for 72 hours, in contrast to enhanced tumor cell growth at 0.1 to 0.5 U/mL (1-5 nmol/L) during the same period. In this report, we show that both the impaired and enhanced tumor cell growth is secondary to activation of the thrombin PAR-1. We further demonstrate that the impaired tumor cell growth in vitro is associated with the arrest of cell growth at G2M in the cell cycle and induction of apoptosis. Materials and methods
Tumor cell lines, tissue culture media, and reagents
B16F10 murine melanoma cells, HCT8 human colon adenocarcinoma, and CHRF-128 human megakaryocytic leukemic cells were obtained and cultured in RPMI 1640, as described previously1,6-8 in the presence of 1% or 10% FCS. Human DU145 prostate cells were obtained from American Type Culture Collection, Rockville, MD. Human thrombin, 3000 μ/mg, and thrombin receptor activation peptide, SFLLRNPNDKYEPF, propidium iodide, DNAse-free RNAse, and NP40 were obtained from Sigma (St Louis, MO). DFP-thrombin was obtained from Hematologic Technologies, Inc, Essex Junction, VT. The general fluoromethyl ketone caspase inhibitor FK-011, Boc-Asp (OMe)-FMK,9 10 was obtained from Enzyme Systems Products, Livermore, CA.
Tumor cell growth assays
One × 104 to 1 × 10⁶ tumor cells were starved for 24 hours in the absence of FCS and then incubated in 96-well microtiter plates or 5-mL plastic flasks for 1 to 7 days in the presence of 1% or 10% FCS + RPMI 1640, penicillin, and streptomycin. Cell growth was assayed indirectly by the MTT assay11 with a Cell Proliferation kit II (XTT) supplied by Boehringer Mannheim, as directed by the manufacturer, or by the Calcein AM (c-1430) method,2 vital dye fluorgenic cellular esterase assay (Molecular Probes), or directly by phase microscopy, counting the number of cells per well after removal with ethylenediamine tetraacetic acid (EDTA). Cell cycle studies were performed with tumor cells incubated for 36 hours at 37°C and washed in phosphate-buffered saline (PBS). Cells were then suspended in 1 mL containing 50 μg propidium iodide, 0.1 mg DNAse-free RNAse, 1 mg NP40 detergent, and 1 mg trisodium citrate and incubated for 15 minutes at room temperature before assay by fluorescence flow cytometry.
Reverse transcriptase-polymerase chain reaction
The RNAs tested were treated with deoxyribonuclease 1 (Perkin Elmer Cetus, Branchburg, NJ) to eliminate contaminating DNA. RNA was extracted with the ultraspec RNA Isolation System (Biotexc, Houston TX). The primer pair used for PAR-4 was identical to that used by Xu et al12: (sense) 5′-GGYGCCCGCCCTCTATGG at base pairs (bp) 412 to 429 and (antisense) 5′-TCGCGAGGTTCATCAGCA at bp 516 to 533 designed to give a 121-bp product. The primer pair used for murine PAR-4 was (sense) 5′-CTCACTACTGGACTCTGTTTGGTGG at bp 610 to 634 and (antisense) 5′TGGGCACATAGGCTCCATAGAG-3 at bp 988 to 1009 designed to give a 399-bp product.13 The primer pair for murine β actin was (sense) 5′-ATGAAGATCCTGACCCGAGCG at bp 490 to 509 and (antisense) 5′-TACTTGCGCTCAGGAGGAGC at bp 913 to 932 designed to give a 443-bp product.
Two micrograms of RNA was converted to cDNA with 10 U/mL Moloney murine leukemia virus (MMLV) reverse transcriptase, 100 nmol/L dNTP, 100 pmol/L of random hexamer, and 10 μL of 5 × reverse transcription (RT) buffer at 37°C for 1 hour in a total volume of 50 μL. Two microliters of the synthesized cDNA was used as a template in the polymerase chain reaction (PCR) containing 2 μ of Taq DNA polymerase, 50 nmol/L each of dNTPs, and 50 pmol/L of primers in a total volume of 50 μL. Amplification cycles consisted of 1.3 minutes at 94°C, 2 minutes at 60°C, and 2 minutes at 70°C for 35 cycles. RT-PCR products were analyzed by 1.8% agarose gel electrophoresis.
B16F10 cells.
Bluescript plasmid containing the murine PAR-1 cDNA was kindly provided by Dr S. Coughlin (University of California, San Francisco). An approximately 1.5-kb Xba1 fragment containing the complete coding sequence was inserted into the expression vector pcDNA3 (In Vitrogen). A positive transfectant (S14) was selected by Geneticin resistance and verified by Northern blotting, as well as immunohistochemistry with an antibody against PAR-1 as described previously.2
HCT8 cells.
The human wild-type PAR-1 was kindly supplied by Dr S. Coughlin in a pBJ1 plasmid containing the FLAG epitope at the amino terminal end of PAR-1.15 Positive transfectants were selected by Geneticin resistance and verified by Northern blotting, as well as immunoblot.
Immunoblotting
Sixty micrograms of protein extract from cell lysates was applied to a 12.5% SDS-polyacrylamide gel and electroblotted onto nitrocellulose membranes. Expression of the human PAR-1 transfectants were analyzed by the luminescence method (Amersham Life Science) with an M1–anti-FLAG antibody (Kodak Scientific Imaging System, 1 μg/mL), followed by goat antimouse antibody conjugated to horseradish peroxidase (Sigma).
Apoptosis measurements
Apoptosis was measured by flow cytometry, using a fluorescein isothiocyanate (FITC) conjugate of Annexin V and propidium iodide (Oncogene Research Products, Cambridge, MA). Annexin V binds to early apoptotic, as well as late apoptotic/necrotic cells. Propidium iodide binds to late apoptotic/necrotic cells. Treated cells were removed with trypsin-EDTA, washed twice with 0.01 mol/L PBS, pH 7.4, centrifuged, and then treated as directed by the manufacturer.
Results
Effect of thrombin exposure time on impaired cell growth
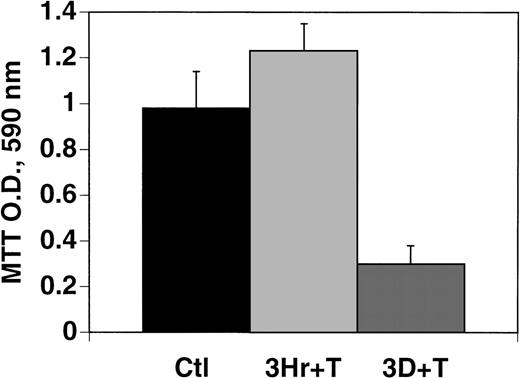
B16F10 cells were incubated with 1 U/mL of thrombin for 72 hours or for 3 hours, followed by washing in RPMI media and then incubated for 72 hours. Figure 1 demonstrates that the 72-hour exposure of thrombin resulted in a 70% decrease in cell growth (P = .01), compared with no decrease after 3 hours of thrombin exposure, followed by washing and 72 hours of further incubation, as well as 24 hours of thrombin exposure (data not shown). Impaired cell growth was associated with the rounding of cells that became detached from the plate. Both detached and attached cells were harvested together in the assay. Detached cells were dead as determined by trypan blue exclusion.
Effect of thrombin exposure time on B16F10 growth after 72 hours of culture.
One × 104 B16F10 cells were starved of FCS for 24 hours and then incubated in RPMI + 1% FCS with 1 U/mL thrombin. One aliquot (bar 2) was washed in RPMI + 1% FCS after 3 hours and then incubated for 72 hours in the wash media. Another aliquot (bar 3) was incubated for 72 hours with 1 U/mL thrombin. Control cells (bar 1) were incubated for 72 hours without thrombin. Optical density refers to color development with the MTT assay at 490 nm after incubation for 24 hours at 37°C in 5% CO2. SEM is given for the mean of quadruplicate measurements of 3 different cell clones.
Effect of thrombin concentration on cell growth
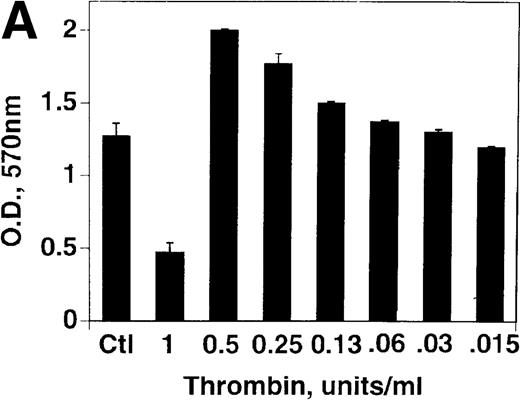
B16F10 cells were next incubated with various concentrations of thrombin for 72 hours. Figure 2A demonstrates a 62% decrease in cell growth at 1 U/mL thrombin (P = .03), compared with a 57% increase in growth at 0.5 U/mL (P = .002), with decreasing concentration resulting in decreased enhancement. An analysis of thrombin concentrations between 0.5 and 1 U/mL revealed a graded decrease in cell growth (data not shown). Similar results were noted with HCT8 cells with a 50% decrease in cell growth at 2 U/mL thrombin and a 63% increase in growth at 0.25 U/mL, Figure 2B. A similar 58% impairment of growth was noted with a megakaryocyte cell line (CHRF) after 1 U/mL thrombin (representative of 2 experiments).
Effect of thrombin concentration on cell growth.
(A) B16F10 cells were prepared as in Figure 1 and incubated for 72 hours in the absence and presence of various concentrations of thrombin. SEM is given for 4 different cell clones. (B) Similar experiment with HCT8 cells, 1 clone.
Effect of thrombin concentration on cell growth.
(A) B16F10 cells were prepared as in Figure 1 and incubated for 72 hours in the absence and presence of various concentrations of thrombin. SEM is given for 4 different cell clones. (B) Similar experiment with HCT8 cells, 1 clone.
Specificity of thrombin effect on cell growth
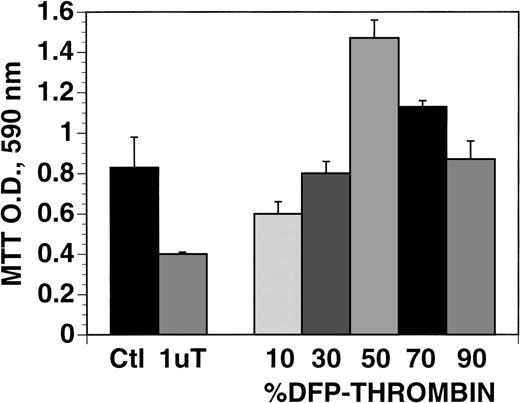
Specificity of the thrombin effect on B16F10 cell growth was confirmed by competitive inhibition experiments with inactive DFP-thrombin that competes with active thrombin for PAR-1 without activating the receptor. Active thrombin at 1 U/mL impairs tumor cell growth by approximately 50% in Figure 3. Various percentage mixtures of increasing DFP-thrombin with 1 U/mL active thrombin over a 72-hour incubation resulted in enhanced cell growth of 83% at a 1:1 mixture (P < .02) as predicted. Further increases in DFP-thrombin were less effective because less active thrombin was now available for its enhancing effect on cell growth.
Effect of DFP-thrombin on thrombin-induced cell growth inhibition.
B16F10 cells were incubated without or with 1 U/mL thrombin (bars 1 and 2) as well as various mixtures of DFP-thrombin plus active thrombin varying from 10% to 90% DFP-thrombin, totaling 1 U/mL thrombin in each well for 72 hours. SEM is given for 3 different clones.
Effect of serum concentration on cell growth in the presence of thrombin
Impaired cell growth of B16F10 cells (−50%,P = .03, 1.07 ± 0.2 vs 0.53 ± 0.02 optical density) was noted with 1% serum plus 1 U/mL thrombin for 72 hours, whereas enhanced growth (+ 68%, P = .02, 1.03 ± 0.07 vs 1.73 ± 0.09) was noted in 10% serum with 1 U/mL thrombin. This protective effect of serum could be overcome with 2 U/mL thrombin (−48%, P < .01, 1.03 ± .067 vs 0.54 ± 0.067). Data are from 3 different experiments, performed in quadruplicate.
Direct measurement of tumor cell number at varying concentrations of thrombin
Figure 4 demonstrates a 2.1-fold increase in B16F10 cell number with 0.5 U/mL thrombin after 7 days of exposure, with no increase in cell number using 1 U/mL.
Effect of thrombin on growth of B16F10 cells.
One × 106 cells, grown in 10% FCS were washed in RPMI, starved for 24 hours in the absence of FCS and then incubated for 1 to 7 days in the presence of 0, 0.25, 0.5, and 1 U/mL thrombin in 1% FCS.
Effect of thrombin on growth of B16F10 cells.
One × 106 cells, grown in 10% FCS were washed in RPMI, starved for 24 hours in the absence of FCS and then incubated for 1 to 7 days in the presence of 0, 0.25, 0.5, and 1 U/mL thrombin in 1% FCS.
Thrombin-induced impaired tumor cell growth operates through the PAR-1 receptor and requires intact thrombin.
B16F10 cells only contain the PAR-1 thrombin receptor. GPIb and PAR-3 were not detectable by RT-PCR in a previous analysis,2 and PAR-4 was not detectable by RT-PCR in this study, under conditions in which it is detectable in mouse spleen cells (Figure5). Negative results were also obtained in HCT8 cells under conditions in which it was detectable in human platelets and CHRF cells (data not shown). Nevertheless, the 14mer thrombin receptor activation peptide (TRAP) had no impaired growth effect at concentrations as high as 1 mmol/L (data not shown). Differential activation of cells by thrombin and TRAP have been reported.16 17 This is compatible with thrombin operating through another receptor or mechanism. However, this was not supported by experiments demonstrating the absence of the newly described PAR-4 thrombin receptor in both cell lines.
Absence of PAR-4 in B16F10 cells.
Lane M (mw markers), lanes 1 to 3 (Actin), lanes 4 to 6 (PAR-4), lanes 1 and 4 (B16F10 cells), lanes 2 and 5 (water blank), lanes 3 and 6 (mouse spleen cells). Similar negative results for PAR-4 was obtained with HCT8 cells.
Absence of PAR-4 in B16F10 cells.
Lane M (mw markers), lanes 1 to 3 (Actin), lanes 4 to 6 (PAR-4), lanes 1 and 4 (B16F10 cells), lanes 2 and 5 (water blank), lanes 3 and 6 (mouse spleen cells). Similar negative results for PAR-4 was obtained with HCT8 cells.
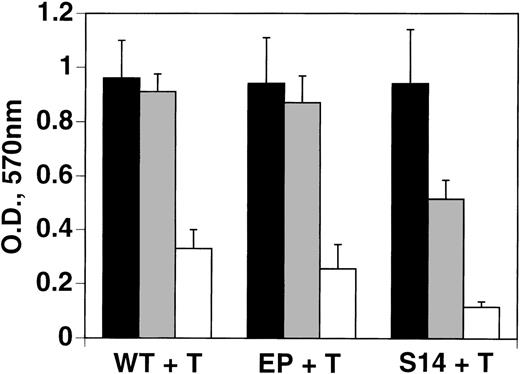
Further support for thrombin-induced impaired growth operating through the PAR-1 receptor was obtained from experiments with B16F10 cells (S14) transfected with PAR-1. These cells were 2.6- to 3.3-fold more sensitive to thrombin-induced impaired cell growth, compared with transfected empty plasmid or wild-type cells, respectively (Figure6). This was further confirmed after 1 day of incubation, wherein PAR-1–transfected cells showed a 60% impairment of growth, with 1 U/mL thrombin, compared with no change with wild-type or mock-transfected cells (data not shown).
Increased sensitivity of PAR-1-transfected B16F10 tumor cells to thrombin-induced impaired cell growth.
Wild-type (WT), empty plasmid-transfectant (EP), and PAR-1–transfected B16F10 cells (S14) were treated with 0, 0.5, and 1 U/mL thrombin (T) for 72 hours as in Figure 1, and then analyzed by the MTT assay. SEM is given for experiments performed in quadruplicate. Student ttest for difference between EP versus S14 at 0.5 U/mL thrombin,P < .02; S14 at 0 versus 0.5 U/mL, P < .05; WT or EP versus S14 at 1 U/mL, P < .01.
Similar results were obtained with HCT8 cells transfected with the human thrombin receptor. Figure 7A (column 3) demonstrates successful transfection of the wild-type human thrombin receptor into HCT8 cells. Figure 7B demonstrates a 13.5-fold greater sensitivity to impaired cell growth with transfected cells after 2 days of thrombin treatment at 1 U/mL; 2-fold greater sensitivity was noted after 1 day of thrombin exposure (data not shown).
Increased sensitivity of PAR-1–transfected HCT8 tumor cells to thrombin-induced impaired cell growth.
(A) Immunoblot of PAR-1 transfected cells with PAR-1–tagged anti-FLAG antibody. Lane 1, wild-type cells; lane 2, empty plasmid-transfected cells; lane 3, wild-type PAR-1 cells. (B) Wild-type PAR-1 transfectants were incubated with various concentrations of thrombin for 2 days. Control bars (black) depict empty vector transfection, whereas gray bars depict PAR-1 transfection. SEM is given for experiments performed in quadruplicate.
Thrombin-induced tumor cell growth is associated with cell cycle arrest at G2M.
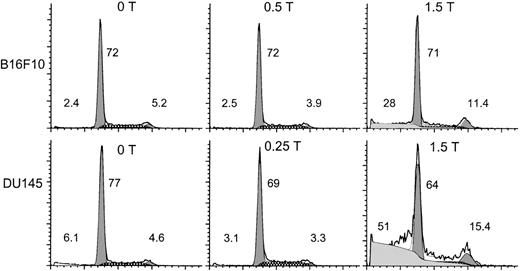
Figure 8 demonstrates “high-dose” thrombin-induced cell cycle arrest of B16F10 and DU145 cells at G2M of 2.2- and 3.3-fold respectively, with enhanced pre-Go DNA of approximately 12- and 8-fold, respectively, at 36 hours (compared with no thrombin treatment). The increase in pre-Go DNA suggested the induction of apoptosis. This was confirmed by Annexin V assay and caspase inhibition experiments (see below).
Thrombin induces cell cycle arrest at G2M.
B16F10 (S14) and DU145 cells were incubated with various concentrations of thrombin for 36 hours, washed in PBS, and then assayed for propidium iodide binding via flow cytometry. The heavy line refers to the raw data. The shaded areas refer to the computer simulated peaks of the cell cycle from left to right at pre-Go, Go-G1, and G2M, respectively. The hatched areas refer to the S phase. The fine line refers to the sum of the raw data and the computer simulated peaks. The number on the far left refers to the percentage total pre-Go cells measured. The 2 numbers on the right refer to the percentage distribution of cells in cycle for Go-G1 and G2M, respectively. The Go-G1, G2M, and S cells equal 100%.
Thrombin-induced impaired tumor cell growth is associated with the induction of apoptosis.
Figure 9 demonstrates apoptosis and cell death at 1.5 U/mL thrombin. Note the absence of apoptosis at 9 hours of incubation, onset at 19 hours and induction of 30% cell death at 24 hours of incubation.
Thrombin induction of apoptosis demonstrated by Annexin V assay.
PAR-1–transfected B16F10 (S14) cells were incubated without thrombin or with thrombin: 0.25 and 1.5 U/mL for 9, 19, and 24 hours and the degree of Annexin V and propidium iodide binding determined by flow cytometry. Annexin V binds to early apoptotis and late apoptotic/necrotic cells. Propidium iodide binds to late apoptotic/necrotic cells. Percentage of cells in the upper and lower right quadrants is given.
Effect of caspase inhibitor on apoptosis of B16F10 cells induced by 1U/mL thrombin.
Figure 10 demonstrates prevention of thrombin-induced apoptosis of B16F10 cells with the caspase inhibitor, FK-011, which inhibits all caspases. Note the inhibition of cell growth with 2 U/mL of thrombin of 79% (P = .03) and prevention of this effect with 40 μmol/L, as well as 80 μmol/L FK-011 (P < .01), to 57% and 77% of control, respectively. Similar results were noted with DU145 cells in which cell growth was inhibited 80% with 1.5 U/mL of thrombin (under similar conditions of incubation as with B16F10 cells), which was partially corrected with 40 to 80 μmol/L FK-011 to 36% inhibition (P = .001, 2 experiments performed in quadruplicate).
Effect of caspase inhibitor, FK-011 on thrombin-induced apoptosis.
B16F10 cells were prepared as in Figure 1 and incubated in the absence of FK (bar 1), 40 μmol/L FK (bar 2), 80 μmol/L FK (bar 3), 2 U/mL thrombin (bar 4), thrombin + 40 μmol/L FK (bar 5), or thrombin + 80 μmol/L FK (bar 6). SEM is given for 3 clones.
Discussion
Our studies demonstrate for the first time, a role for thrombin in the induction of tumor cell impaired growth and apoptosis at higher thrombin concentrations (0.5-1 U/mL) than those required for tumor cell mitogenesis in 4 tumor cell lines studied: B16F10, HCT8, CHRF, and DU145 cells. This is documented by (1) impaired growth by MTT and Calcein assays at 72 hours; (2) absent thrombin stimulation of cell growth at 7 days of assay, compared with control cells; (3) cell cycle arrest at G2M with enhanced pre-Go DNA accumulation; (4) Annexin V binding at 19 hours with 30% cell death at 24 hours; and (5) inhibition of thrombin-induced impaired cell growth and apoptosis with caspase inhibitor FK-011, which inhibits all caspases.10 Interestingly, cell cycle arrest at G2M has recently been reported to precede the induction of apoptosis by irradiation of lymphoblastic leukemia cells18and vinblastine treatment of human small-cell lung carcinoma, MS1 cells,19 suggesting that arrest at this stage facilitates the induction of apoptosis.
The effect of thrombin on tumor cell impaired growth and apoptosis, such as its effect on pulmonary metastasis,2 was induced via the tumor cell PAR-1 thrombin receptor,20,21 described on tumor cells.5,22-24 This is supported by the (1) use of a tumor cell line, B16F10 in which other known thrombin receptors, GPIb, PAR-3, and PAR-4, are absent2; and (2) enhanced sensitivity to thrombin-induced impaired cell growth in B16F10 and HCT8 cells successfully transfected with PAR-1.
This report also clearly demonstrates for the first time, thrombin enhanced tumor cell growth at relatively low thrombin concentration (0.1-0.5 U/mL) as measured by MTT and Calcein assays at 3 days of cell culture, as well as intact cell enumeration after 7 days of culture. The effect of thrombin was more pronounced at 7 days, compared with 3 days, suggesting the possibility of autocrine cytokine release. These studies on tumor cells treated with thrombin at 0.1 to 0.5 U/mL are concordant with earlier studies on thrombin-induced growth of fibroblasts and smooth muscle cells,25-30 as well as more recent studies suggesting a role for thrombin-induced tumor growth rather than or in addition to enhanced tumor cell adhesion from the increased volume of tumor nodules noted in the induction of thrombin-stimulated experimental pulmonary metastasis,1,2as well as preliminary studies indicating enhanced tumor cell nodule growth after subcutaneous injection of B16F10 cells treated with low-dose thrombin. It should be pointed out that the enhanced tumor growth and metastasis studies previously reported2 used 1 U/mL thrombin for activation of tumor cells. However, this was exposure for 1 hour, followed by extensive washing. As demonstrated in Figure 1, prolonged exposure to thrombin was required for the impaired growth effect.
The mechanism of PAR-1 ligation-induced mitogenesis versus impaired growth/apoptosis remains to be established. It is clear, however, that prolonged thrombin exposure is required for the cell cycle arrest and apoptotic effect, suggesting a continuous stimulation of newly synthesized and/or surface transported PAR-1.31 Recent studies indicate the induction of caspases 1, 2, and 3 by “high-dose” thrombin.32 It should be recognized that the maximum reversal of impaired cell growth obtained with the general caspase inhibitor was approximately 75%. This would suggest the possibility of an additional mechanism of impaired cell growth induced by high-dose thrombin.
The theoretical clinical implications of these observations are apparent. Tumor cells are unique in that they have constitutively active tissue factor on their surface.8,33 This could induce thrombin generation, which, in turn, could stimulate tumor cell growth, adhesion and, possibly, invasion. Thus a “vicious” autocrine cycle is established. It is of interest that tissue factor expression correlates with hematogenous metastases in melanoma cells34-36 and is associated with the leading edge of invasive breast carcinomas,37 although tissue factor can also stimulate tumor growth independently of thrombin generation via the induction of vascular endothelial growth factor (VEGF) and angiogenesis.38,39 In addition, enzymatically active thrombin has been reported to be present on surgically removed tumor specimens, including malignant melanoma, by affinity-ligand histochemical analysis,40 and thrombin-receptor overexpression has recently been reported in malignant-invasive breast tumor cell lines in vitro, as well as human breast metastatic tissue in vivo.41 In this regard, it is of interest that low-grade intravascular coagulation has been observed in most patients with solid tumors,42-45 60% of cancer patients at the time of diagnosis, progresses with greater tumor burden, and is associated with a poor prognosis.45 We therefore suggest that inhibition of PAR-1 receptor signaling by receptor blockade or ligand inhibition/neutralization could lead to decreased mitogenesis and adhesion. Continuous stimulation of PAR-1 receptor signaling via insertion of a constitutively active PAR-1 into tumor cells could lead to apoptosis and tumor regression.
Note added in proof. SFLLRN (2 mmol/L), in the presence of protease inhibitors PMSF (1 mmol/L) and leupeptin (2 μg/mL) added daily, inhibits growth of B16F10 cells to the same extent as 1.5 U/mL thrombin after 72 hrs incubation.
Supported by NIH grant HL-13336-26 and grants from the Helen Polonsky Research Fund and the Dorothy and Seymour Weinstein Research Fund.
Reprints:Simon Karpatkin, New York University Medical School, 550 First Ave, New York, NY 10016; e-mail:simon.karpatkin@med.nyu.edu.
The publication costs of this article were defrayed in part by page charge payment. Therefore, and solely to indicate this fact, this article is hereby marked “advertisement” in accordance with 18 U.S.C. section 1734.








This feature is available to Subscribers Only
Sign In or Create an Account Close Modal