Abstract
Primitive, proliferating hematopoietic progenitors (defined as cytokine low-responding primitive progenitors; CLRPP), isolated from human CD34+ cells, expressed endoglin (CD105) and produced transforming growth factor-β1 (TGF-β1). Culture of CLRPP in serum-free conditions with anti-TGF-β1 monoclonal antibody produced a substantial decrease in bcl-2 protein/RNA levels and a significant reduction of cloning and long-term culture-initiating cell (LTC-IC) activities. GATA-1 and PU.1 RNA levels were significantly up-regulated in anti-TGF-β1–treated CLRPP, which generated an increased number of cells expressing CD15/CD11b/glycophorin-A. The described effects of TGF-β1 neutralization were observed in the absence of any relevant effect on cell cycle; number of cell divisions; p53, c-myc, and p21 RNA levels; bcl-xL and bax protein levels; and c-myc/p16/p21/p107/Rb cell cycle–related protein levels. A relevant increase in p27 protein levels was observed in anti-TGF-β1–treated CLRPP, suggesting a role for p27 in the regulation of the hematopoietic potential. The present study on human progenitors and previously reported data on TGF-β1 knockout mice suggest that, at the autocrine level, the cell cycle inhibitor TGF-β1 plays an important role in regulating the survival and differentiation of primitive proliferating hematopoietic progenitors by cell cycle–independent mechanisms.
The molecular mechanisms underlying the survival and function of primitive precursors during hematopoiesis are largely unknown. Several studies have shown that bcl-2, c-myc, and p53 are involved in the regulation of survival and proliferation of human cells.1-3 The transcriptional regulation of bcl-2 and c-myc in the hematopoietic system is, in part, under the control of various hematopoietic cytokines and their receptors, which concomitantly exert well-known differentiating signals.4-7 Less is known about the regulation of p53 in hematopoietic progenitors.2 The response of hematopoietic precursors to cytokines determines a stage-specific molecular profile that is characterized by the expression of considerable levels of bcl-2, p53, and c-myc in more primitive precursors while differentiating progenitors down-modulated the expression of these genes.8 In harmony with these findings, concomitant expression of bcl-2, p53, and c-myc genes has been suggested by Ryan et al9 as being the molecular state by which precursors survive and proliferate and maintain stable hematopoietic functions, as revealed by their studies on bcl-2/c-myc/p53 cotransfected DP16-1 murine erythroleukemia cells. In reference to this, a key aspect for a better understanding of hematopoiesis is represented by the identification of the putative intrinsic mechanisms through which primitive precursors maintain their specific functional/molecular profile despite the presence of powerful differentiating stimuli. The present study examined the role of autocrine levels of the cell cycle inhibitor10transforming growth factor-β1 (TGF-β1) in the maintenance of cloning/long-term culture-initiating cell (LTC-IC) activities and bcl-2/p53/c-myc expression in a population of primitive hematopoietic precursors (operationally defined as cytokine low-responding primitive progenitors; CLRPP), which homogeneously express detectable levels of endoglin (CD105; a component of TGF-β1 and TGF—β3 receptor complex). The results demonstrated that neutralization of autocrine TGF-β1 by adequate amounts of a specific monoclonal antibody or inhibition of autocrine production by antisense oligonucleotides decreased CLRPP cloning/LTC-IC activities and bcl-2 expression and up-regulated their p27 expression without any significant modification of cell cycle status, short-term proliferating capacity, c-myc/p53 expression, and p16/p21/p107/Rb cell cycle–related protein expression.
Materials and methods
Isolation of CD34+ hematopoietic precursors
Aliquots of leukapheresis products, collected under mobilizing conditions, were subjected to gradient fractionation and subsequent CD34+ cell isolation, as previously described.11 The study was approved by the Hospital Investigational Review Board and all patients/donors gave their informed consent. For this study, only those isolated products that exceeded 95% in purity were considered adequate and processed for the subsequent experimental steps.
Functional identification and isolation of primitive hematopoietic progenitors
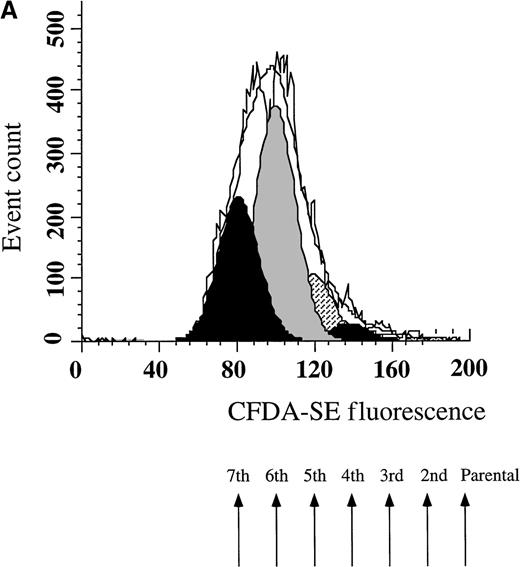
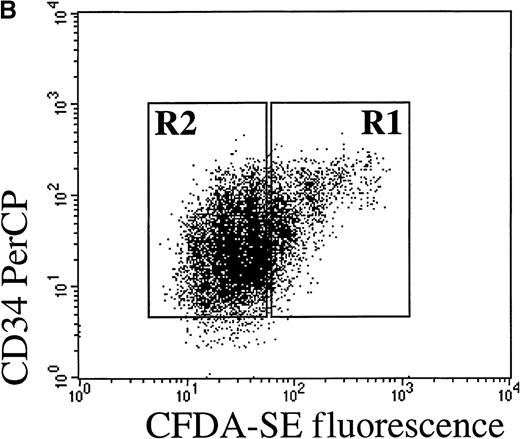
Fresh isolated CD34+ cells were loaded with the fluorescent dye 5,6-carboxyfluorescein diacetate succinimidyl ester (CFDA-SE; Molecular Probe, Eugene, OR) and cultured for 8 days, as described previously.11 Briefly, on day 8 primitive precursors were identified as those cultured progenitors, which, as indicated by the progressive halving of CFDA-SE fluorescence (green fluorescence), experienced no more than 5 subsequent cell divisions and were isolated by flow cytometric cell sorting (Figure1A and B). These cells were defined as CLRPP and their functional and molecular properties are detailed in Table 1.
Flow cytometric cell sorting.
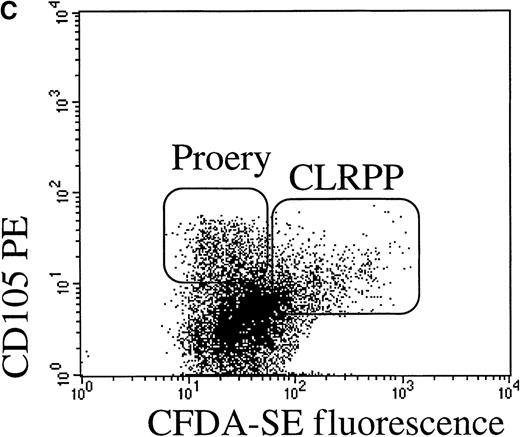
(A) Flow cytometry identified distinct cell generations following 8-day culture (see Materials and methods for details) of fresh isolated CD34+ cells using CFDA-SE fluorescent dye and Modfit LT software (Verity Software House). Each arrow indicates a distinct cell generation or parental cells and the numbers indicate their frequency in the analyzed cells (expressed as a percentage). (B) Sorting strategy to isolate CLRPP from fresh isolated CD34+ cells cultured for 8 days. CLRPP were sorted on R1 window, setting the sorting windows on the basis of the threshold values of green fluorescence identified previously by the Modfit software for each cell generation. In the typical experiment shown in this figure, CFDA-SE-loaded cultured progenitors were costained with CD34 PerCP to document the maintenance of high levels of CD34 expression on R1 sorted CLRPP. (C) Similarly, costaining with CD105 PE shows the expression of intermediate levels of CD105 antigen on CLRPP and intermediate to high levels of CD105 expression on highly proliferating proerythroblasts (Proery).
Functional characteristics and molecular profile of fresh isolated CD34+ and functionally isolated CLRPP
| . | CD34+ . | CLRPP . |
|---|---|---|
| CD34% | 96 | 99 |
| CFU-GM/1000 cells | 60 | 270 |
| BFU-E/1000 cells | 40 | 240 |
| LTC-IC frequency | 1:400 | 1:100 |
| SG2M% | 3 | 30 |
| GATA-1 RNA (relative adsorbance)* | 0.912 | 0.651 |
| PU.1 RNA (relative adsorbance)* | 0.767 | 0.674 |
| bcl-2 protein (relative adsorbance)† | 0.425 | 0.967 |
| bcl-xL protein (relative adsorbance)† | 0.122 | 0.562 |
Results are expressed as the average values observed in 6 different isolation experiments established with cells collected from 6 different patients.
Expressed as the relative adsorbance ratios between the RNA levels of the gene of interest and that of β-actin.
Expressed as the relative adsorbance ratios between the protein levels of the molecule of interest and that of actin at Western blot analysis.
Culture of CLRPP in the presence or the absence of anti–TGF-β1 neutralizing antibody, TGF-β1 antisense oligonucleotides, or recombinant TGF-β1
Preliminary CLRPP cultures were carried out in the presence of 25% fetal bovine serum (FBS) or replacing FBS with 25% Bit H9500 serum substitute (Stem Cell Technologies, Vancouver, Canada) to ascertain whether serum-free conditions support autocrine TGF-β1 production in CLRPP cultured for 72 hours in Iscove's modified Dulbecco's medium (IMDM) supplemented with cytokines. In subsequent experiments, isolated CLRPP were cultured at 37°C for 72 hours in a fully humidified 5%CO2/95% air atmosphere in serum-free complete growth medium consisting of IMDM supplemented with 25% Bit H9500 serum substitute (Stem Cell Technologies), granulocyte colony-stimulating factor (G-CSF; 20 ng/mL; Sigma Chemical, St. Louis, MO), granulocyte macrophage colony-stimulating factor (GM-CSF; 20 ng/mL; Schering Plough, Milan, Italy), interleukin-3 (IL-3; 20 ng/mL; Genzyme, Cambridge, MA), stem cell factor (SCF; 10 ng/mL; Amgen, Thousand Oaks, CA), Flt3 ligand (10 ng/mL; Genzyme), erythropoietin (EPO; 4 IU/mL; R&D Systems, Oxon, UK), and thrombopoietin (TPO; 10 ng/mL; Genzyme), in the presence or the absence of doses of anti-TGF-β1 neutralizing monoclonal antibody (mAb; clone 9016.2; R&D Systems) ranging from 0.1 to 20 μg/mL (identical doses of irrelevant isotype-matched mouse immunoglobulins were used as controls in parallel cultures) and of different doses of TGF-β1 antisense oligonucleotides (ranging from 3 to 15 μmol/L; identical doses of sense oligonucleotides were used as control in parallel cultures).12 Parallel growth experiments were performed in the presence of 1 ng/mL recombinant human TGF-β1 (R&D Systems). In each experimental condition, CLRPP were seeded in 24-well plates at the concentration of 0.5 × 10⁵/mL in several replicate wells. After 72 hours of culture, cells were recovered for counting, functional assays, and phenotypic, kinetic, and molecular analyses. Using the above-described culture conditions, some CLRPP cultures were prolonged to 6 days to evaluate the number of nascent differentiating progenitors in control and in anti-TGF-β1–treated cultures.
Flow cytometric analysis of TGF-β1 content, CD105, CD34/bcl-2 protein expression, and cell cycle status of isolated and cultured CLRPP
Endoglin/CD105 expression and intracellular TGF-β1 were detected by flow cytometry in isolated and cultured CLRPP. Up to 1.5 × 10⁵ cells were mixed with 5 μL of a phycoerythrin-conjugated anti-CD105 (CD105 PE) mAb (clone SN6; Serotec, Oxford, UK) and incubated for 30 minutes at room temperature in the dark. Then, cells were washed twice with phosphate-buffered saline (PBS)-1% bovine serum albumin (BSA) and analyzed by flow cytometry. Before detection of intracellular TGF-β1 by flow cytometry, aliquots of cells were preincubated for 4 hours in complete growth medium containing 10 μg/mL brefeldin-A to block intracellular transport and enhance cytokine accumulation in the Golgi complex. After washings with PBS-1% BSA, aliquots of up to 1 × 10⁵ cells were resuspended in 100 uL of fixing solution (Fix and Perm, Caltag, Burlingame, CA) and incubated for 15 minutes at room temperature; after centrifugation with PBS-1% BSA, cells were resuspended in 100 μL of permeabilizing solution (Fix and Perm, Caltag) containing pretitrated saturating amounts of anti-TGF-β1 mAb (clone 9016.2; 0.1 μg for each test; R&D Systems). Cells labeled with anti-TGF-β1 were subsequently incubated with a PE-conjugated goat antimouse immunoglobulin (Immunotech, Marseilles, France) with a ratio of 1:40 to cell suspension. After extensive washings, cells were analyzed by flow cytometry. Staining experiments for flow cytometric detection of TGF-β1 protein were carried out omitting cell fixation and permeabilization to estimate the amount of TGF-β1 bound on cell membrane following extensive washings of serum-free and serum-containing cultures. For the simultaneous assessment of CD34 and bcl-2 expression, up to 1 × 10⁵ isolated and cultured CLRPP were first stained with pretitrated dilutions of PerCP-conjugated anti-CD34 mAb (1:10 to cell suspension; clone 8G12; Becton Dickinson, Mountain View, CA) for 30 minutes at room temperature, followed by fixation with Ortho Permeafix solution (Ortho Diagnostics, Raritan, NJ) for 40 minutes at room temperature. After washings in PBS-1% BSA, cells were incubated with saturating amounts of a PE-conjugated antihuman bcl-2 mAb (1:10 to cell suspension; clone bcl-2/100; Pharmingen, San Diego, CA) for 30 minutes at 4°C. After washings in PBS-1% BSA, cells were kept on ice until flow cytometry analysis. In some growth experiments, CLRPP were cultured for 6 days and then evaluated for the expression of CD15, CD11b, CD41a, and glycophorin-A differentiation antigens. Up to 2.5 × 10⁵ cells were incubated with 10 μL of anti-CD41aPE (Caltag) or antiglycophorin-A PE (Caltag) for single-color analysis or costained with 10 μL of anti-CD15FITC (Immunotech)/CD11bPE (Caltag) for dual-color analysis. In all staining experiments, background fluorescence was assessed using isotype-matched fluorochrome-conjugated irrelevant mouse immunoglobulins (Immunotech, Becton Dickinson, Pharmingen, Caltag) in direct assays or substituting the specific mAb with isotype-matched irrelevant mouse immunoglobulins (Immunotech) in indirect assays. Cell cycle status of CLRPP was evaluated before culture and every 9 hours as follows. Cells were incubated for 30 minutes at 4°C with 1 mL of DNA staining buffer (0.5% Nonidet P-40, 10 mg/mL propidium iodide -PI-, 11.25 Kunitz units RNAse, and 0.1% sodium azide, Sigma Chemical), protected from light, and then analyzed by flow cytometry. Calculations of cell cycle compartments were performed on a 1024-channel histogram with ModFit LT software (Verity Software House, Topsham, ME) for DNA content analysis. Finally, CFDA-SE fluorescence (green fluorescence) was analyzed by flow cytometry and the Proliferation Wizard option of ModFit LT software (Verity Software House) in 72-hour-cultured CLRPP as a measure of cell replication rate of these cells. All samples were run through a FACScan flow cytometer (Becton Dickinson).
Cloning and LTC-IC assays
Colony-forming cells (colony-forming unit granulocyte macrophage, CFU-GM; burst-forming unit-erythroid, BFU-E) were evaluated from isolated and cultured CLRPP by cloning assays, as previously described.13 The incidence of LTC-IC in control and study cultures was assayed using limiting dilution analysis and hematopoietic long-term culture on supportive stromal layers consisting of the genetically engineered murine stromal cells M2-10B4 (kindly provided by Connie Eaves, Terry Fox Laboratory, British Columbia Cancer Agency, Vancouver, Canada), as previously described.13
Semiquantitative reverse transcriptase-polymerase chain reaction (RT-PCR)
The messenger RNA (mRNA) expression levels of p53, c-myc, p21WAF1/Cip1, and bcl-2 were evaluated by RT-PCR on isolated and cultured CLRPP. RNA extraction was carried out with the RNeasy mini kit (Quiagen, Hilden, Germany) and RNA obtained from 20 000 cells was reverse transcribed, as previously described.11 Two microliters of these complementary DNA (cDNA) products were amplified with 1 U of Ampli Taq Gold (Perkin Elmer/Roche, Branchburg, NJ) in the presence of the specific primers for the mRNA of interest, together with the aldolase-A primers,14 used as internal control. Phytohemagglutinin (PHA)-stimulated lymphocytes were used as positive controls because they were previously shown to express detectable levels of all the markers studied in the present work. PCR reactions were carried out in the Gene Amp PCR system 9600 (Perkin Elmer) using 1 U of Ampli Taq Gold DNA polymerase in 5 mM MgCl2. A first incubation of 10 minutes at 95°C, 45 seconds at 65°C, and 1 minute at 72°C was followed by 27 cycles for p53 and by 28 cycles for c-myc, p21WAF1/Cip1, and bcl-2 performed as follows: 45 seconds at 95°C, 45 seconds at 65°C, and 1 minute at 72°C. The conditions were chosen so that none of the RNAs analyzed reached a plateau and so that the 2 sets of primers used in each reaction did not compete with each other. The PCR products were loaded onto 2% agarose gels and stained with ethidium bromide. Each set of reactions included a no-sample negative control. The ratio between the sample RNA to be determined and aldolase-A was calculated to normalize for initial variations in sample concentration and as a control for reaction efficiency. The sequences of the specific primers for bcl-2, aldolase A, c-myc, and p53 were previously described.14-16 The following primers were used for p21: 5′-CCCAGTGGACAGCGAGC-3′ and 5′-ACTGCAGGCTTCCTGTGGGC-3′, which yielded a 499 bp product. All oligonucleotide primers were synthesized by Pharmacia Biotech (Uppsala, Sweden). Analysis of GATA-1 and PU.1 expression levels was performed essentially as previously described, using β-actin as an internal control.17 PCR products were electrophoresed and transferred to Hybond membranes (Amersham International, Buckinghamshire, UK), which were then hybridized to the specific cDNAs. Images of the resulting radiographic films were acquired as described below. All values were normalized to their respective β-actin internal control.
Preparation of the tissue lysates and Western blotting analysis
Isolated or cultured CLRPP (1 × 10⁶) were lysed in 20 mmol/L Tris-HCl pH 7.4, 0.1 mol/L NaCl, 5 mmol/L MgCl2, 1% NP-40, 0.5% sodium deoxycholate, 50 mmol/L NaF, 2 mmol/L Na vanadate, 1 mmol/L phenylmethylsulfonyl fluoride (PMSF), 2 μg/mL leupeptin, and 2 kallikrein inhibitor units/mL aprotinin. The protein concentration was determined using the Bio-Rad Protein Assay (Bio-Rad Laboratories, Hercules, CA). Each protein sample (80 μg) was separated on a 5% to 15% polyacrylamide gradient sodium dodecyl sulfate (SDS) gel and electroblotted on polyvinyldene fluoride (PVDF) membranes (Millipore, Bedford, MA). Membranes were incubated with 6% nonfat dry milk in 1 × TBST (0.1 mol/L Trizma Base, 0.15 mol/L NaCl, 0.05% Tween 20, pH 7.4) for blocking and then with the primary antibody in 3% nonfat dry milk in 1× TBST. After incubation with the appropriate secondary antibody (goat antirabbit or goat antimouse horseradish peroxidase [HRP] conjugated, Bio-Rad), detection was performed with the ECL-Plus system (Amersham International) and the blots were exposed to X-AR-5 OMAT Kodak films. The blots were used up to 4 times by stripping at 50°C for 30 minutes in 100 mmol/L 2-mercaptoethanol, 2% SDS, and 62.5 mmol/L Tris-HCl pH 6.7, followed by extensive blocking and reprobing with a different antibody. The following antibodies were used for Western blotting: anti c-myc (clone N-262), p21 WAF1/Cip1 (clone C-19), p16Ink4 (clone C-20), bcl-xL (clone L-19), and bax (clone N-20) rabbit polyclonal antibodies from Santa Cruz Biotechnology Inc (Santa Cruz, CA); anti-p27KIP1 (clone G173-524), Rb (clone G3-245), and p107 (SD9) mouse mAb were all from Pharmingen. Anti-TGF-β1 mouse mAb (clone 9016.2) was from R&D Systems.
Image analysis and quantification
Images of the RT-PCR ethidium bromide–stained agarose gels, radiographic films, and Western blotting PVDF membranes were acquired with a Cohu CCD camera and quantification of the bands was performed by Phoretix 1 D (Phoretix International, Newcastle upon Tyne, UK). Band intensity was expressed as relative absorbance units. The bar graphs in the figures show the mean and standard deviation of all experiments. All values reported in the text and figure are ratios of relative absorbance units.
Data analysis
Comparisons between control and study cultures were performed by unpaired 2-tailed t test. A P < .05 was considered significant.
Results
Expression of CD105 (endoglin) and CD34/bcl-2 and autocrine production of TGF-β1 in isolated CLRPP
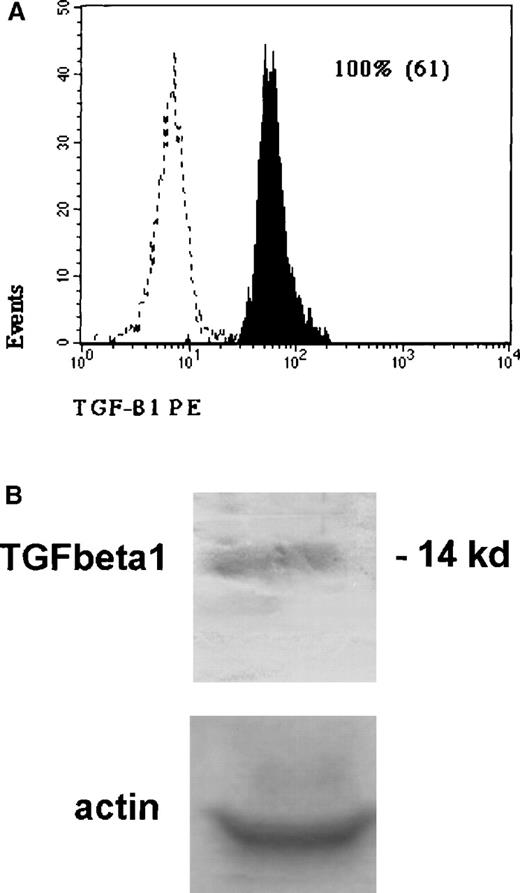
Functional, kinetic, and molecular properties of isolated CLRPP are shown in Table 1. CLRPP had very high cloning efficiency, ranging from 30% to 60%, with generation of colonies of multiple lineages and were significantly enriched in primitive LTC-IC (their frequency was consistently near 1:100). An average of 30% of CLRPP were in the proliferative compartments of the cell cycle. Expression of GATA-1 and PU.1 RNA was low in these cells, lower than that found in fresh isolated CD34+ cells, indicating the lack of an evident commitment into the differentiating lineages. Further characterization of these cells revealed that they expressed intermediate levels of endoglin (CD105; a component of the TGF-β1 and TGF-β3 receptor complex) (Figure 1C). Flow cytometric studies and Western blot analysis identified the presence of a considerable amount of intracellular TGF-β1 in CLRPP with 100% of cells containing TGF-β1 (Figure2A and B). Staining experiments carried out without cell fixation and permeabilization following extensive cell washings revealed that anti-TGF-β1 mAb does not react with CLRPP cultured in serum-free or serum-containing medium, indicating the absence of a detectable amount of TGF-β1 bound on cell membrane, which could interfere with the cytometric detection of the intracellular protein. As revealed by a preliminary set of cultures, the production of autocrine TGF-β1 was maintained throughout the whole culture period (72 hours) and also maintained in the absence of serum (data not shown). Thus, all subsequent experiments were carried out in the absence of serum, using Bit H9500 serum substitute. As previously reported, CLRPP coexpressed high levels of the CD34 progenitor antigen and considerable levels of the bcl-2 survival protein, with more than 50% of these cells consistently bcl-2+ (see also Table 1 and Figure 5).
Intracellular TGF-β1 in CLRPP.
(A) Flow cytometric detection of autocrine TGF-β1 in isolated CLRPP. Dotted lines represent the background fluorescence of isotypical controls; black histograms are the specific fluorescence generated by the presence of anti-TGF-β1 mAb (clone 9016.2). The numbers indicate the percentage of positive cells and in parentheses the mean fluorescence channel is indicated. Data are representative of 6 different experiments. (B) Western blot analysis of TGF-β1 protein in isolated CLRPP, showing the specific band of 14 kd.
Growth, cloning ability, and LTC-IC content of cultured CLRPP with or without TGF-β1 neutralization or inhibition by antisense oligonucleotides
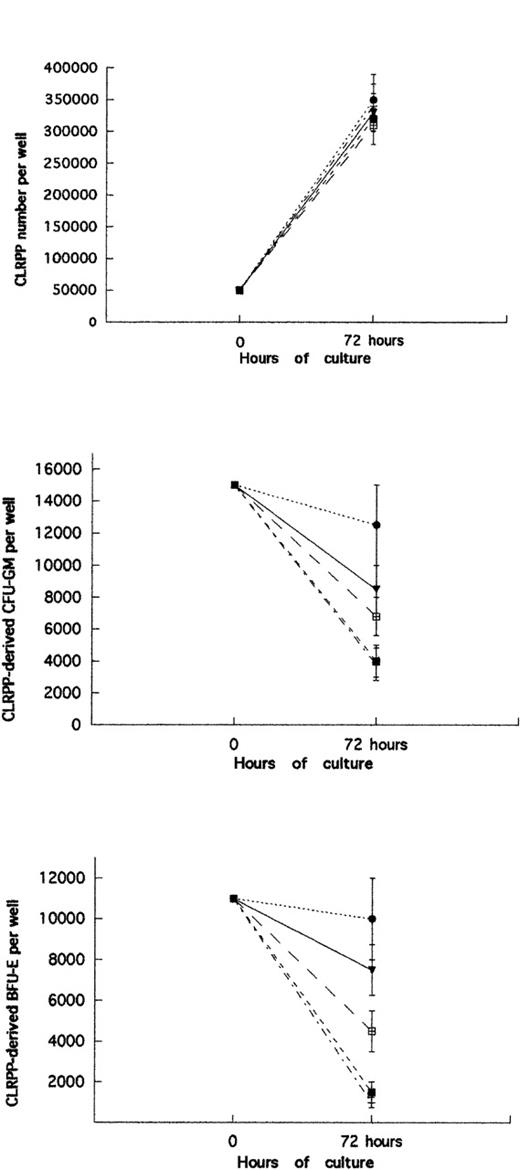
Growth of CLRPP in serum-free medium was not significantly perturbed by anti-TGF-β1 neutralizing antibody in a dose range from 0.1 to 20 μg/mL. After culturing CLRPP for 72 hours in serum-free conditions in the absence of any antibody or in the presence of specific anti-TGF-β1 or irrelevant isotype-matched mouse immunoglobulins, a 6-fold increase was observed in the starting cell number (Figure3; P > .05 for any experimental condition as compared to controls), without any relevant effect on CLRPP viability, as judged by flow cytometric propidium iodide viability testing. Subsequent experiments carried out in the presence of antisense or sense TGF-β1 oligonucleotides in a dose range from 3 to 15 μmol/L produced similar results, with no significant modification in cell number and viability as compared to untreated controls (data not shown). However, cloning assays revealed that the presence of a dose of anti-TGF-β1 equal to or higher than 1 μg/mL consistently decreased the frequency of CFU-GM and BFU-E, with the recovery of 16% to 53% of cloning cells as compared to controls (Figure 3; P < .0001 for a dose of anti-TGF-β1 ≥ 1 μg/mL, for both CFU-GM and BFU-E). The detrimental effect of TGF-β1 neutralization on the cloning fraction was revealed both by CFU-GM and by BFU-E reduction in the absence of any significant modification of the size of recovered colonies. CLRPP cultures in the presence of TGF-β1 antisense oligonucleotides (15 μmol/L) produced a minor reduction of cloning capacity as compared to anti-TGF-β1–treated cultures, with the recovery of an average of 70% (range 85-60%) of control colony number. We did not find any significant variation of cloning ability when CLRPP were cultured in the presence of irrelevant isotype-matched mouse immunoglobulins or TGF-β1 sense oligonucleotides. Table 2 shows the average LTC-IC frequencies observed in 72- hour cultured CLRPP, which revealed that the presence of anti-TGF-β1 at the dose of 10 μg/mL produced an 85% reduction of LTC-IC content.
CLRPP growth and CFU-GM/BFU-E content.
CLRPP growth (upper graph) and CLRPP-derived CFU-GM (center graph) and BFU-E (lower graph) contents were determined after 72 hours of culture in serum-free conditions in the presence or the absence of several doses of anti-TGF-β1 neutralizing mAb. P > .05 for any anti-TGF-β1 dose on CLRPP growth. P < .0001 for an anti-TGF-β1 dose ≥ 1 μg/mL on CLRPP-derived CFU-GM and BFU-E content. Parallel cultures in the presence of irrelevant isotype-matched mouse immunoglobulins showed comparable results to those observed in control CLRPP cultures. Results are expressed as the mean values ± SD observed in 4 different experiments. In each graph, • indicates the control; ▾, anti-TGF-β 0.1 μg/mL; □, anti-TGF-β 1 μg/mL; +, anti-TGF-β 10 μg/mL; ▪, anti-TGF-β 20 μg/mL.
LTC-IC content of control and anti-TGF-β1 treated (10 μg/mL) CLRPP after 72-hour serum-free cultures
| . | CLRPP . | Anti-TGF-β1 CLRPP . |
|---|---|---|
| LTC-IC frequency* | 1:100 ± 30 | 1:780 ± 100 |
| LTC-IC-derived CFU-GM/BFU-E ratio† | 10 ± 2 | 10 ± 3 |
| . | CLRPP . | Anti-TGF-β1 CLRPP . |
|---|---|---|
| LTC-IC frequency* | 1:100 ± 30 | 1:780 ± 100 |
| LTC-IC-derived CFU-GM/BFU-E ratio† | 10 ± 2 | 10 ± 3 |
Parallel cultures in the presence of identical doses of irrelevant isotype-matched mouse immunoglobulins showed comparable results to those observed in control CLRPP cultures. Results are presented as the average values ± SD observed in 4 different experiments established with cells collected from 4 different patients.
P < .001.
P > .05.
Bcl-2, p53, c-myc, and p21 gene expression in isolated and cultured CLRPP
Isolated CLRPP showed considerable bcl-2, p53, c-myc, and p21 RNA levels. Expressed as the relative adsorbance ratios between the RNA levels of the gene of interest and that of aldolase-a, bcl-2, p53, c-myc, and p21 levels were, on average, 1.5, 1.4, 1.3, and 0.5, respectively. After 72-hour culture, CLRPP showed bcl-2, p53, c-myc, and p21 levels similar to starting cells (Figure4). In the presence of anti-TGF-β1 neutralizing antibody (10 μg/mL), a significant reduction of bcl-2 RNA levels was observed in the absence of any significant modification of c-myc, p53, and p21 levels. On average, neutralization of TGF-β1 reduced the bcl-2 relative adsorbance ratio from 1.4 to 0.3 in cultured CLRPP. No gene expression modulations were observed in controls (10 μg/mL irrelevant isotype-matched mouse immunoglobulins). The presence of TGF-β1 antisense oligonucleotides at the dose of 15 μmol/L reduced bcl-2 RNA levels to the average value of 1 (expressed as relative adsorbance), as compared to control, TGF-β1 sense, and anti-TGF-β1 mAb-treated CLRPP, which had average values of 1.4, 1.6, and 0.3, respectively. Parallel 72-hour CLRPP cultures, prepared in the presence of 1 ng/mL TGF-β1, showed that TGF-β1 addition increased bcl-2 RNA levels from 1.4 to 2.7, on average. This bcl-2 modulation by exogenous TGF-β1 was observed in the absence of significant effects on cell proliferation (although a 20% reduction in cell number as compared to controls was observed), p53, c-myc, and p21 expression levels (data not shown), and CLRPP cloning ability (a slight decrease in cloning cell frequency was observed in 3 of 6 samples treated with TGF-β1). However, the increase of bcl-2 expression by exogenous TGF-β1 was quite variable, with no significant variations in 2 samples of 6 studied (data not shown) and a very high increase in 2 samples of 6 (4-fold increase as compared to bcl-2 expression found in controls; data not shown).
Levels of bcl-2, p53, c-myc, and p21.
RT-PCR analysis of bcl-2, p21, c-myc, and p53 was performed on 72-hour cultured CLRPP in the presence (anti–TGF-beta1) or the absence (Ctrl CLRPP) of anti-TGF-β1 mAb (10 μg/mL). Panels are photographs of ethidium bromide–stained gels. (PHA-stim.LymP indicates PHA-stimulated lymphocytes used as positive control; Neg.ctrl, no-sample negative control). The lower band in all panels is aldolase-A, which was coamplified with the other specific products and used as an internal control. Data are representative of 4 experiments. Parallel cultures in the presence of irrelevant isotype-matched mouse immunoglobulins showed comparable results to those observed in control CLRPP cultures. The bar graph shows the mean values ± SD expressed as the adsorbance ratios between the specific RNA and aldolase-A RNA level observed from 4 different experiments. P > .05 for p21, c-myc, and p53 RNA levels; P < .0001 for bcl-2 RNA levels.
Coexpression of CD34/bcl-2 and expression of differentiation antigens on cultured CLRPP
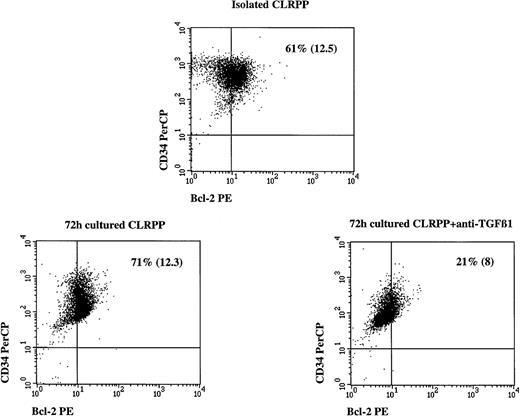
As revealed by RT-PCR and Western blot analyses, CLRPP had high levels of bcl-2. This result was confirmed by flow cytometry (Figure5). CLRPP, cultured for 72 hours in the presence or absence of 10 μg/mL anti-TGF-β1 neutralizing mAb, were evaluated for the simultaneous expression of CD34 progenitor marker and bcl-2 protein. Following culture, CLRPP maintained their CD34 expression both in control and anti-TGF-β1–treated cultures while the expression of bcl-2 protein was consistently and considerably reduced in anti-TGF-β1 treated CLRPP (68 ± 7% and 20 ± 5% bcl-2+ cells in control and anti-TGF-β1–treated CLRPP, respectively; P < .0001). Dual-color analysis showed a certain correlation between bcl-2 and CD34 expression, so that the dimmer CLRPP for bcl-2 in anti-TGF-β1–treated cultures concomitantly showed a certain down-modulation of CD34 antigen, suggesting a trend of these primitive cells toward differentiation (the mean fluorescence channel of CD34 staining decreased from the control value of 270 to the value of 120 observed in anti-TGF-β1 cultures, on average). Extension of serum-free CLRPP cultures to 6 days revealed that the frequency and the absolute number of nascent CD15+, CD11b+, and glycophorin-A+ cells were 2-fold higher in anti-TGF-β1–treated cells than in controls. However, because of the primitive nature of CLRPP, the frequency of CD15+, CD11b+, and glycophorin-A+ did not exceed 15%, 10%, and 5%, respectively, in any condition tested. At this time, no mature CD15+/CD11b+ and very rare CD41a+ cells were detected in control and study cultures. No significant changes in CLRPP cumulative cell number were observed in study cultures as compared to controls.
Flow cytometric detection of CD34 antigen and bcl-2 protein coexpression in isolated and cultured CLRPP.
Isolated CLRPP (upper cytogram) were cultured in serum-free conditions (see Materials and methods for details) in the absence (lower left cytogram) or in the presence (10 μg/mL; lower right cytogram) of an anti-TGF-β1 neutralizing mAb. Numbers indicate the percentage of double-positive CLRPP and in parentheses the mean bcl-2 fluorescence channel is shown for each experimental condition. Parallel cultures in the presence of irrelevant isotype-matched mouse immunoglobulins showed comparable results to those observed in control CLRPP cultures.P < .0001 comparing the number of bcl-2+ cells in the presence and the absence of anti-TGF-β1 mAb.
Cell cycle analysis and tracking of cell division number of cultured CLRPP
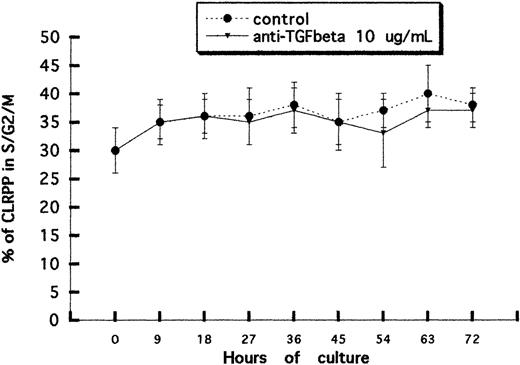
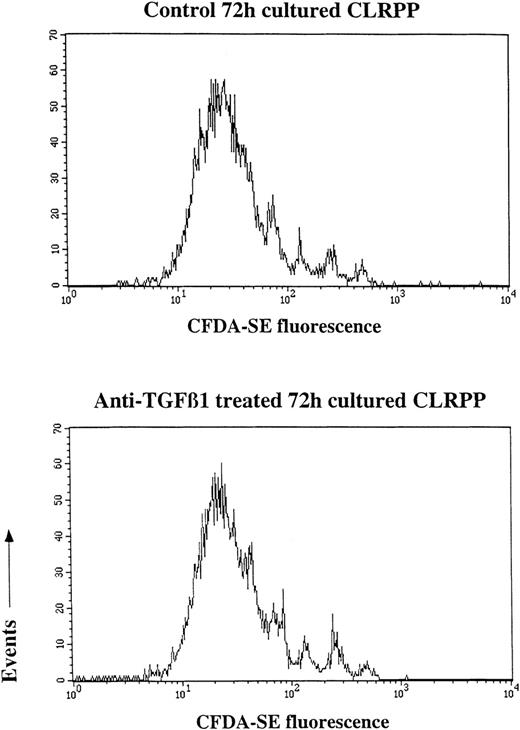
Cell cycle analysis was performed every 9 hours on CLRPP cultured in the presence or in the absence of 10 μg/mL anti-TGF-β1. As detailed in Figure 6, no significant variation of CLRPP distribution into the different cell cycle compartments was produced by the presence of anti-TGF-β1 antibody at the dose of 10 μg/mL. Tracking of cell division number by CFDA-SE fluorescent dye and flow cytometry demonstrated that TGF-β1 neutralization was not accompanied by any evident variation in the number of CLRPP divisions, as indicated by the overlapping green fluorescence histograms obtained in treated samples and their controls (Figure7).
Cell cycle analysis.
Graph shows the percentages of cells in the S/G2/M phase of the cell cycle during 72-hour serum-free cultures of CLRPP in the presence or the absence of anti-TGF-β1 neutralizing mAb (10 μg/mL). The average values ± SD observed every 9 hours in 4 different experiments were plotted in the graph. P > .05 comparing results observed at any time point for the different experimental conditions.
Histograms from CFDA-SE fluorescent dye.
Cell division numbers of control and study (treated with 10 μg/mL anti-TGF-β1 neutralizing mAb) CLRPP cultures were tracked by CFDA-SE fluorescent dye and flow cytometric analysis. CFDA-SE fluorescent profiles of control and anti-TGF-β1–treated CLRPP following 72 hours of culture were quite similar with the absence of relevant differences in the distribution of CLRPP into the distinct proliferating progeny. The histograms are representative of 4 different experiments.
Western blot analysis of c-myc, bcl-2, bcl-xL, bax, and p16/p21/p27/p107/Rb cell cycle–related proteins during CLRPP growth experiments
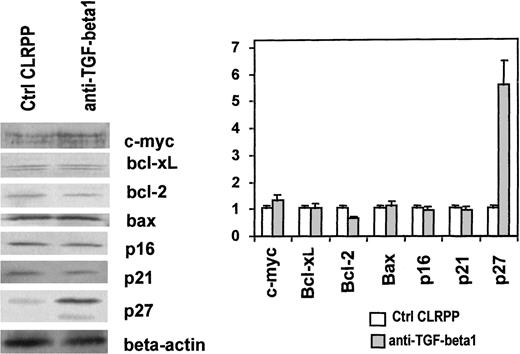
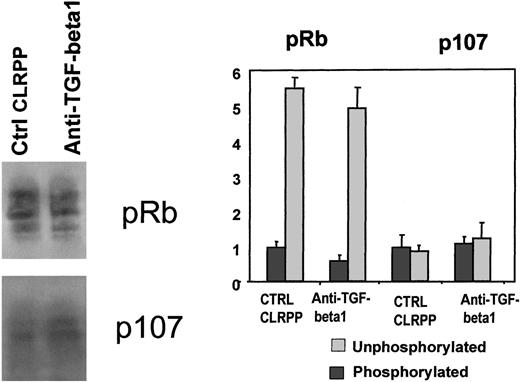
No significant change of c-myc, bax, bcl-xL, and p16/p21/p107/Rb cell cycle–related protein levels was observed in control and anti-TGF-β1–treated CLRPP by Western blot analysis (Figures8 and 9). Moreover, the ratios between hyperphosphorylated and hypophosphorylated Rb and p107 protein levels were comparable in control and study CLRPP cultures (Figure 9). Western blot analysis confirmed a reduction of bcl-2 levels in anti-TGF-β1–treated CLRPP (Figure 8;P < .01). A dramatic increase in p27 expression levels was observed in anti-TGF-β1–treated CLRPP with an average 5-fold increase as compared to control CLRPP (Figure 8; P < .0001)
Cell cycle–related protein levels.
Western blot analysis was performed for c-myc, bcl-xL, bcl-2, bax, p16, p21, and p27 protein levels in 72-hour cultured CLRPP in the presence (anti–TGF-beta1) or the absence (Ctrl CLRPP) of 10 μg/mL anti-TGF-β1 neutralizing antibody. Bar graph shows the mean ± SD relative adsorbance ratio between the protein of interest and actin observed in 4 different experiments. Parallel cultures in the presence of irrelevant isotype-matched mouse immunoglobulins showed comparable results to those observed in control CLRPP cultures. P > .05 for c-myc, bcl-xL, bax, p16, and p21 protein levels of control and study CLRPP; P < .01 for bcl-2 and P < .0001 for p27 protein levels.
Hyperphosphorylated and hypophosphorylated Rb and p107 protein levels.
Rb and p107 protein expression was assessed in 72-hour cultured CLRPP in the presence (anti-TGF-beta1) or the absence (Ctrl CLRPP) of anti-TGF-β1 neutralizing mAb (10 μg/mL). Panels represent 4 different experiments. Bar graph shows each protein level as the mean ± SD relative adsorbance ratio between the protein of interest and actin observed in 4 different experiments. P > .05 for both Rb and p107 in their hyperphosphorylated (Phosphorylated) and hypophosphorylated (Unphosphorylated) forms.
GATA-1 and PU.1 transcription factor RNA level in CLRPP cultured in the presence or absence of TGF-β1 neutralization
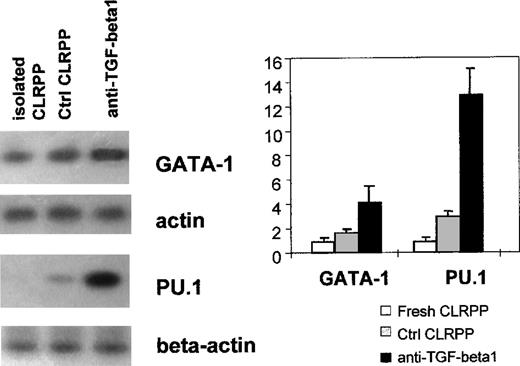
Analysis of the expression levels of GATA-1 and PU.1 transcription factors in CLRPP cultured for 72 hours was performed to evaluate the impact of TGF-β1 neutralization on the differentiating status of these primitive precursors. RNA analysis revealed that cells cultured in the presence of anti-TGF-β1 neutralizing antibody (10 μg/mL) had GATA-1 and PU.1 RNA levels consistently higher than those observed in control cultures (4.2 ± 0.8 versus 1.8 ± 0.2 and 13 ± 1.7 versus 2.5 ± 0.2, respectively,P < .0001; Figure 10) despite the maintenance of CD34 expression on their cell surface (Figure 5).
Expression levels of GATA-1 and PU.1 transcription factors in CLRPP.
GATA-1 and PU.1 RNA levels were determined by RT-PCR of isolated, 72-hour cultured control (Ctrl CLRPP) and anti-TGF-β1 treated (10 μg/mL; anti-TGF-beta1) CLRPP. The RT-PCR products were separated on agarose gel, transferred to filter, and hybridized with the specific probes for GATA-1, PU.1, and β-actin. β-Actin was coamplified with the genes of interest as an internal control. Bar graph shows the RNA levels expressed as the mean ± SD adsorbance ratios between the RNA of interest and that of β-actin observed in 4 different experiments. Parallel cultures in the presence of irrelevant isotype-matched mouse immunoglobulins showed comparable results to those observed in control CLRPP cultures.P < .0001 for GATA-1 and PU.1 RNA levels of 72-hour cultured control and anti-TGF-β1–treated CLRPP.
Discussion
Molecular characterization of primitive hematopoietic progenitors
Recent reports underlined the existence of molecular patterns associated with the undifferentiated status of hematopoietic progenitors, characterized by considerable expression of the survival protein bcl-xL and by the induction of bcl-2 expression after cytokine exposure.18 Studies on hematopoietic cell lines revealed that cotransfection of bcl-2, p53, and c-myc could guarantee prolonged survival and extensive proliferative ability to DP16-1 murine erythroleukemia cell line.9 This effect recalls the picture attributed to candidate stem cells and primitive precursors. In line with these observations, we recently demonstrated that primitive circulating hematopoietic precursors, functionally isolated following cytokine stimulation by tracking of cell division number, associate primitive functional properties with high expression of bcl-2, bcl-xL, c-myc, and p53.8 The above-mentioned population of primitive precursors (operationally defined as CLRPP) expressed intermediate levels of endoglin (CD105; a component of the TGF-β receptor complex) and produced a considerable amount of autocrine TGF-β1 (as revealed by flow cytometry and Western blotting). In the light of these findings, we verified the existence of an autocrine loop for TGF-β1 in CLRPP and the role of this autocrine multifunctional cytokine in maintaining the functional properties and the molecular status of these cells.
Autocrine TGF-β1 supports bcl-2 expression and cloning/LTC-IC activities in proliferating progenitors
Transforming growth factor-β1 is a well-known inhibitor of primitive hematopoiesis19-21 and, when exogenously added, delays cell cycle transition from the G0/G1 to the S phase by inducing high levels of p15, p27, and p21 cyclin-dependent kinase (CDK) inhibitors22 and maintaining retinoblastoma and p107 proteins in the hypophosphorylated state.23,24 Furthermore, suppression or neutralization of autocrine TGF-β1 releases primitive blood progenitors from quiescence.19,25,26 The present study indicated that inactivation of the endogenous TGF-β1 by specific neutralizing mAbs significantly reduced the cloning ability of cultured CLRPP, decreasing by more than half the colony-forming cells of all lineages and by 85% primitive LTC-IC. We also found that TGF-β1 neutralization resulted in the reduction of both bcl-2 RNA and protein levels. Using TGF-β1 antisense oligonucleotides, an appreciable, albeit less evident, reduction both of bcl-2 expression and cloning cell number was found. The lower effectiveness of antisense is not unexpected and the cause could lie either in a suboptimal dose of oligonucleotides used (a nontoxic dosage, as described by Hatzfeld et al19 ranging from 3 to 15 μmol/L) or in the presence of an excess of secreted maturating latent TGF-β1 forms.27 Collectively, our data fit well with studies on embryonic rat hippocampal neurons and mouse neonate cortical neurons, which indicated that TGF-β1 is responsible for maintenance/induction of bcl-2 expression in these cells, representing a mechanism for regulation of survival and protection from stress produced by oxidative injury or removal of trophic factors.28,29 Moreover, a recent report showed bcl-2 up-modulation in normal murine hematopoietic precursors and Ba/F3 cell line following exposure to exogenous TGF-β1.30 Bcl-2 is an essential survival factor for leukemic and normal hematopoietic progenitors, able to preserve cloning ability in cultured normal precursors.31,32 Our findings confirm and extend previous studies on bcl-2 functions in hematopoietic cells31 32 and link bcl-2 regulation to autocrine production of TGF-β1 in primitive progenitors. The specific influence of TGF-β1 on bcl-2 expression was revealed by the unaltered expression of p53, c-myc, bcl-xL, and bax in anti-TGF-β1–treated CLRPP, compared to control CLRPP.
Effects of autocrine TGF-β1 on cell cycle and cell cycle–related proteins
The absence of significant modulation of the expression of some CDK inhibitors such as p16 and p21 or Rb and p107 demonstrated that bcl-2 modulation by TGF-β1 neutralization does not cause detectable changes in these cell cycle-regulating proteins. These results were confirmed by the analysis of the cycling status and the number of cell divisions of control and study cultures, which demonstrated that modulation of bcl-2 gene occurred without any perturbation of progenitor cycling activity. Hence, we can argue that the autocrine amount of TGF-β1 is unable, in the presence of a rich cocktail of stimulatory cytokines, to negatively modulate cell cycle status while it contributes to the maintenance of adequate bcl-2 expression in these cells, dissociating its previously described cell cycle–related activities19-26 from these newly observed survival functions. In fact, the aforementioned experimental evidence suggests that TGF-β1 can exert distinct effects, inhibiting in a dose-dependent manner cell cycle entry of quiescent precursors21 and regulating survival when acting at autocrine levels on cycling progenitors. Up-modulation of p27 protein in anti-TGF-β1–treated CLRPP was partially unexpected because this CDK inhibitor is increasingly expressed in TGF-β1-arrested mink Mv 1 Lu epithelial cells.33 On the other hand, Ravitz et al34 showed that exogenous TGF-β1 induced DNA synthesis in C3H10T1/2 mouse fibroblasts with a concomitant p27 down-modulation, suggesting that different cell types may use these inhibitors in different ways. A recent study suggested complex functions for p27 during hematopoietic differentiation, which include subcellular redistribution and, possibly, switch of binding partners with the consequent formation of either active or inactive cyclin/CDK complexes, despite the presence of constant levels of total p27 protein.35 However, in line with previous studies that showed an increase of total p27 levels on terminal differentiation,36 our present results suggest that p27 up-modulation in anti-TGF-β1–treated CLRPP may be consequent to a premature induction of differentiation produced by autocrine TGF-β1 deprivation and may contribute to the loss of hematopoietic potential observed in these precursors. Collectively, our findings fit well with the major hematopoietic defect observed in TGF-β1 knockout mice in which yolk sac anemia develops because of a 90% reduction of absolute blood cell number.37 The occurrence of blood cell hypoplasia in TGF-β1 knockout mice rather than hyperplasia (as could be expected due to the previously described inhibitory activity of TGF-β1 on hematopoietic cell proliferation19-21) supports the hypothesis that, in vivo, TGF-β1 also regulates hematopoietic cell survival and differentiation. Hence, the hematopoietic defect of TGF-β1 knockout mice could result from the loss of multiple actions exerted by TGF-β1 on stem/progenitor cells in vivo, which translated into continuous escape from quiescence of stem cells (with the consequent exhaustion of the stem cell pool due to the absence of TGF-β1 inhibitory activity19,25 26) and premature death and differentiation of cycling progenitors (due to the lack of these newly observed survival functions of autocrine TGF-β1).
Neutralization of autocrine TGF-β1 affects the differentiating status of primitive progenitors
Analysis of GATA-1 and PU.1 indicated that the decrease in cloning ability and bcl-2 expression was accompanied by a substantial increase in the expression levels of these differentiation-related transcription factors (PU.1 for the granulocytic/monocytic and GATA-1 for erythroid/megakaryocytic pathways38). The differentiating trend of anti-TGF-β1–treated CLRPP was confirmed by a certain down-modulation of the CD34 antigen (whose expression was in part correlated to bcl-2) and by the appearance of a 2-fold higher number of CD15+, CD11b+, and glycophorin-A+ cells in anti-TGF-β1–treated cultures as compared to controls. Finally, the reduction of LTC-IC frequency confirmed the relevant loss of hematopoietic potential in anti-TGF-β1–treated CLRPP.
In conclusion, the present study confirms an autocrine loop for TGF-β1 in cytokine-stimulated primitive progenitors; the neutralization of autocrine TGF-β1 significantly affects bcl-2 and p27 expression of these precursors, impairing their hematopoietic potential and starting differentiating programs in the absence of relevant effects on the cell cycle. Recent studies carried out in vitro on hematopoietic cell lines,39,40 in vivo on TGF-β1 knockout mice,37 and the present study suggest that the cell cycle inhibitor TGF-β1 has a cell cycle–independent role in the regulation of progenitor survival and differentiation. A study on the effects of autocrine TGF-β1 on primitive, unstimulated, fresh isolated CD34+/CD105+ cells (which comprise all CD34+/CD38− cells from all sources of hematopoietic cells41) is in progress to investigate the effects of this multifunctional cytokine on a class of quiescent hematopoietic precursors, which includes repopulating cells that may get lost following in vitro cultures.42 43
Supported in part by a grant from Associazione Italiana per la Ricerca sul Cancro (AIRC).
Reprints:Luca Pierelli, Servizio di Ematologia ed Emotrasfusione, Universita' Cattolica del Sacro Cuore, Largo A.Gemelli 8, 00168 Roma, Italy.
The publication costs of this article were defrayed in part by page charge payment. Therefore, and solely to indicate this fact, this article is hereby marked “advertisement” in accordance with 18 U.S.C. section 1734.


This feature is available to Subscribers Only
Sign In or Create an Account Close Modal