Heparin-induced thrombocytopenia with thrombosis (HITT) is associated with antibodies specific for complexes consisting of heparin and platelet factor 4 (PF4). Studies in individual patients with HITT have demonstrated immunoglobulin (Ig) class switching from IgM to the IgG or IgA isotypes. This transition is thought to require helper T cells, but no studies of the cellular or molecular basis of this process have yet been reported. To characterize T-cell involvement in HITT, peripheral blood mononuclear cells (PBMC) from two patients with classical HITT obtained shortly after the acute episode were restimulated with heparin:PF4 complexes, PF4 alone, heparin alone, and medium alone in the presence of autologous antigen-presenting cells (APC). Responding T cells were then examined using the technique of “spectratyping,” in which sequences encoding CDR3 domains of individual V beta (BV) families are amplified and separated by gel electrophoresis. After 14 days in culture with antigen (heparin:PF4 complexes), but not after culture with PF4, heparin, or medium alone, patient cells, but not cells from normal subjects, preferentially expressed T-cell receptor (TCR)-containing β chains of the BV 5.1 family. Nucleotide sequencing of BV 5.1 TCR CDR3 showed that each patient had a personal repertoire, but also shared a tetrapeptide motif (PGTG). These findings provide evidence that the humoral immune response associated with HITT is driven by helper T cells that presumably recognize peptides derived from PF4. Identification of a common β-chain CDR3 motif in responding T cells from each of two patients suggests that a limited number of helper TCRs may be used to mount an antibody response to heparin:PF4 complexes. TCR spectratyping appears to offer a new way to examine the molecular basis of pathologic immune responses and may be useful in further studies of HITT and other immune-mediated hematologic disorders.
HEPARIN-INDUCED thrombocytopenia with thrombosis (HITT) is a major complication of treatment with unfractionated heparin. Although the molecular basis of this disorder is not yet fully understood, it is now known that HITT is closely associated with the production of antibodies specific for complexes containing heparin and platelet factor 4 (PF4), a heparin-binding protein normally found in platelet α granules,1-4 and it is thought that immune complexes consisting of antibody, PF4, and heparin play a key role in pathogenesis.2,5 More than one third of patients treated with unfractionated heparin during open heart surgery produce antibodies reactive with heparin:PF4 complexes,6 7 but for reasons that are not yet clear, only a minority develop immune thrombocytopenia and/or thrombosis. Although the two components of the immunogenic complexes (heparin and PF4) are normal body constituents, antibodies reactive with heparin:PF4 complexes have not yet been described in persons not exposed to heparin exogenously.
In patients who mount a humoral immune response to heparin:PF4 complexes, a primary IgM response is usually followed by secondary formation of IgG and/or IgA antibodies, indicating involvement of T-helper cells.6,8 A newly developed technique, spectratyping, enables analysis of T-cell receptor (TCR) utilization during in vitro stimulation by antigen.9 We used this approach to analyze the response of T cells from patients with HITT to heparin:PF4 complexes processed by autologous antigen-presenting cells (APC) during in vitro culture. In two HITT patients, we observed expansion of T cells expressing TCR with V beta (BV) chains of the 5.1 family and, by sequencing, identified a shared CDR3 peptide motif. These findings indicate that complexes of heparin:PF4 can specifically drive a T-cell response in peripheral blood mononuclear cells (PBMC) from patients with HITT in an in vitro culture and suggest possible commonality of this response in different patients. Spectratyping, combined with the determination of nucleotide sequences in TCR complementarity-determining regions (CDR) regions of responding T cells, appears to offer a useful means to examine the molecular basis of the cellular immune response in HITT and other immune hematologic disorders.
MATERIALS AND METHODS
Patients.
Patient 1 was a 50-year-old woman who presented with a right femoral artery thrombosis. Thrombolytic therapy was unsuccessful and an ilial femoral bypass graft was implanted with partial restoration of venous return. She was treated with unfractionated porcine heparin, but the graft thrombosed after 1 week, which led to gangrene in the lower leg that required an above-knee amputation. About 1 week later, while still on heparin, she developed a deep vein thrombosis in the left leg and a decrease in platelet count to 30,000/μL. A serotonin release assay10 was “borderline” positive, but her serum gave a strongly positive reaction against complexes of heparin: PF4 in an enzyme-linked immunosorbent assay (ELISA),2 and heparin was discontinued. She later experienced a pulmonary embolus, after which an inferior vena caval filter was put in place. She was discharged 1 month after surgery and is currently doing well.
Patient 2 was a 69-year-old woman who presented with acute onset of pain in the left foot. Physical examination showed ischemia of the left lower leg and contrast studies demonstrated atherosclerotic changes in the aorta. It was concluded that she had had an arterial embolus, possibly from an atherosclerotic plaque, and thrombolytic therapy and heparin were instituted. Over a period of 1 week, the patient’s platelet level decreased progressively from normal to 30,000/μL, at which time she developed thrombosis of the left lower leg. Strongly positive reactions for heparin-induced antibodies were obtained by serotonin release10 and heparin:PF4 ELISA2tests. Heparin was discontinued, after which the platelet count returned to normal in 4 days. However, a left below-knee amputation was necessary because of gangrenous changes. About 10 days later, decreased blood flow and cyanosis developed in the right lower leg without associated thrombocytopenia. She was treated with local infusion of urokinase and plasma exchange for 3 successive days, after which circulation was restored. She was discharged after 1 month and is currently doing well.
Informed consent, approved by the Human Research Review committee of the Blood Research Institute, was obtained for procurement of all blood samples.
Culture conditions.
A quantity of 3 × 10⁶ PBMC was cultured in RPMI medium at 106 cells/mL supplemented with 1 mmol/Ll-glutamine and 10% fetal bovine serum (FBS) in six-well flat bottom plates at 37°C in a humidified 5% CO2incubator. Cultures were maintained for a total of 14 days. An equal number of irradiated (3,000 rad) autologous PBMC as a source of APC was added on day 7. Recombinant human IL-2 (Genzyme, Cambridge, MA) 50 IU/mL was added every 3 days to all cultures. The cultured PBMC were challenged upon initial plating and every 3 days thereafter with unfractionated heparin (0.25 U/mL final), purified human PF4 (5 μg/mL final), heparin:PF4 complexes (0.25 IU/mL added to PF4 5.0 μg/mL), or media alone.
RNA and cDNA preparation.
Fourteen-day and noncultured PBMC were harvested or thawed for RNA preparation using the guanidium hydrochloride-containing Trizol Reagent (Life Technologies, GIBCO-BRL, Gaithersburg, MD). First-strand cDNA synthesis was performed using oligo (dT) as a primer for reverse transcription (RT) of 1 μg total RNA using MMLV-RT (Moloney murine leukemia virus-reverse transcriptase; Life Technologies) as described previously.11
Polymerase chain reaction (PCR) amplification.
PCR amplification was performed according to Maslanka et al.9 Briefly, cDNA was amplified for 30 cycles under nonsaturating PCR conditions with a panel of TCR BV family-specific primers, and a β-chain constant primer in duplex or simplex (for BV 6.1 and 6.2) reactions using 24 TCR BV family-specific primers and pairings as previously described.9 The common constant primer was labeled at the 5′ end with 5′-6 carboxyfluorescein (6-FAM). In addition to the TCR BV family-specific and constant primers, each reaction contained a β-actin–specific primer pair producing a 6-FAM–labeled 230-bp product as an internal PCR control for verification of cDNA integrity and the fidelity of the PCR reactions. The β-actin primer sequences were 5′-CCCTGTACGCCTCTGGCCGTACCAC-3′ (6-FAM labeled) and 5′-CACGGCATCGTCACCAACTGGG-3′, and were added to a final concentration of 0.025 μmol/L.
TCR spectratyping.
TCR spectratyping was performed as described by Maslanka et al.9 Briefly, an equivalent volume of PCR-labeled product was mixed with formamide dye-loading buffer, heated at 94°C for 2 minutes, and applied to a pre-run 5% acrylamide-urea sequencing gel. Gels were run for 110 minutes at 40 W. After resolution on the gel, the labeled PCR product was analyzed with a Molecular Dynamics FluorImager 575 (Sunnyvale, CA). TCR spectratyping of a healthy PBMC repertoire typically results in a banding pattern composed of between seven and eight bands at three-nucleotide base intervals, reflecting the correct “in-frame” nature of functionally rearranged β-chain TCR gene products. The limited number of PCR cycles used (30) leads to the generation of PCR products with a distribution representative of the starting material, ie, a Gaussian distribution.9 Each band in a spectratype, while uniform in size, is heterogeneous with respect to the nucleotide sequences it contains, as would be expected, given the high degree of diversity required of TCR CDR3 regions.
PCR product cloning and DNA sequencing.
The TCR β-chain PCR products corresponding to specific spectratype bands were cloned using a T/A Cloning Kit (Invitrogen, San Diego, CA) for PCR fragment cloning. Entire PCR reactions were purified using a QIAquick PCR Purification Kit (Qiagen, Chatsworth CA) before cloning. This approach produced a spectrum of clones representative of all band species and their relative frequencies within a particular spectratype PCR reaction. DNA sequence analysis of clones was performed using a Taq Dye Deoxy-Terminator Cycle Sequencing Kit (Applied Biosystems, Foster City, CA). We define the unique TCR BV CDR3 nucleotide sequences determined in this manner to be a “TCR BV clonotype” or simply “clonotype.”
Electroblot hybridization.
Oligonucleotide clonotype-specific probes to TCR CDR3 of interest were designed based on the DNA sequence of predominant BV 5.1 species derived from patients 1 and 2. The sequences for the probes used are underlined in Fig 4. Each clonotype-specific probe, as well as a BV constant region primer used in each TCR spectratyping PCR reaction, was radiolabeled using 32PγATP (Dupont NEN, Boston, MA), polynucleotide kinase and endlabeling buffer according to the manufacturer’s recommendation (New England Biolabs, Beverly, MA). The BV constant region primer sequence was 5′-CTGTGTTTGAGCCATCAGAAGC-3′. Spectratypes were electroblotted from acrylamide gels onto positively charged nylon membranes (Boehringer Mannheim, Indianapolis, IN) and UV-crosslinked using the auto crosslink setting on a Stratalinker UV 1800 (Stratagene, La Jolla, CA). Electroblots were subsequently hybridized overnight with agitation at 42°C with32P-labeled clonotype-specific probe in a solution containing: 10× Denhardt’s solution, 5× SSC (1× SSC = NaCl 0.15 mol/L, Na3 citrate · 2H2O 0.0015 mol/L; pH 7.0), 7% sodium dodecyl sulfate (SDS), 20 mmol/L Na2HPO4, and 100 μg/mL denatured herring sperm DNA. Posthybridization, the electroblots were washed twice for 10 minutes at 42°C in a solution containing 3× SSC, 5% SDS, and 70 mmol/L phosphate buffer pH 7.0, followed by two additional washes at 42°C in a solution containing 1× SSC and 1% SDS. After a brief rinse in 2× SSC, the electroblots were subjected to autoradiography and analyzed using a Molecular Dynamics PhosphoImager (Sunnyvale, CA).
After clonotype-specific probe hybridization and autoradiography, the radiolabeled probe was stripped from the electroblots with an alkaline stripping solution (0.2 N NaOH, 0.1% SDS) at 37°C for 20 minutes before rehybridizing as described earlier with a second clonotype-specific probe or the BV constant region-specific probe. Complete stripping of each previous probe was verified by autoradiography.
RESULTS
TCR BV spectratypes of noncultured PBMC from the two patients were similar to those of T cells from normal controls.
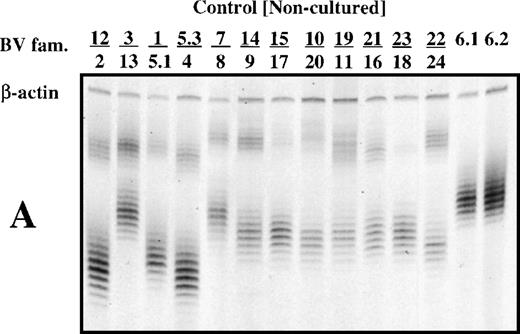
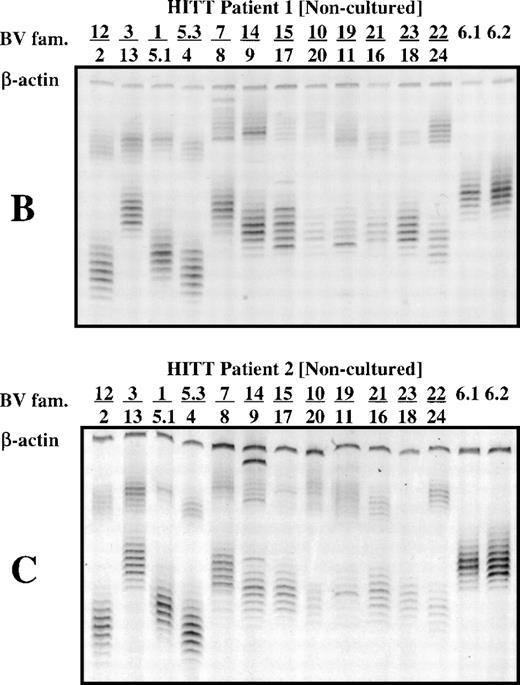
Depending on the extent of the T-cell response, it might be possible to distinguish T cells of interest by a direct comparison of PBMC from a patient experiencing HITT with those from a normal subject. To test this, the TCR β-chain spectratypes of PBMC from patients 1 and 2 and from normal subjects were analyzed. In most cases, spectratypes consisted of seven or eight bands for each BV family, differing in size by 3 bp and having an intensity distribution that was approximately Gaussian (Fig 1A, B, and C). Only an occasional deviation from this pattern was observed in the spectratypes of noncultured PBMCs, as seen for the BV 14 family of patient 2, where a high-intensity band appears at the high end of the size distribution (Fig 1C, Lane 14/19).
T-cell receptor spectratype analysis (multiplex PCR) of 26 BV families using noncultured PBMC from a normal subject (A) and from patients 1 and 2 (B and C). Primers specific for β-actin were included in each reaction mixture as a check on fidelity. Bands in each group differ from each other by 3 bp in length because only T cells with productive (in phase) VDJ rearrangements are found in the peripheral blood.
T-cell receptor spectratype analysis (multiplex PCR) of 26 BV families using noncultured PBMC from a normal subject (A) and from patients 1 and 2 (B and C). Primers specific for β-actin were included in each reaction mixture as a check on fidelity. Bands in each group differ from each other by 3 bp in length because only T cells with productive (in phase) VDJ rearrangements are found in the peripheral blood.
After stimulation of patient PBMC with heparin:PF4 complexes, there was selection for T cells expressing transcripts of the TCR BV 5.1 subfamily.
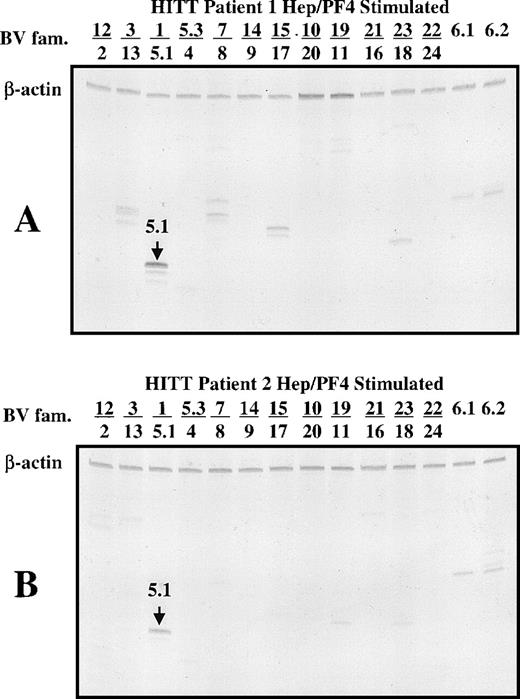
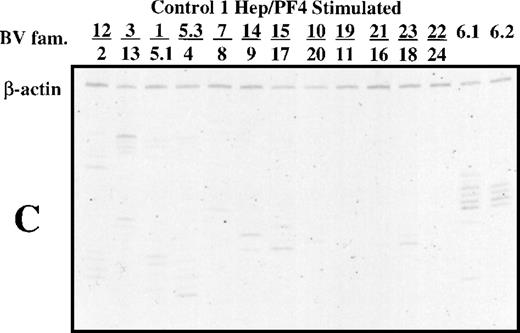
As shown in Fig 2A and B, bands that corresponded to members of the BV 5.1 family were prominent in spectratypes derived from PBMC of the two patients cultured for 14 days in the presence of heparin:PF4 complexes. When there is a considerable expansion of one size class of CDR3 and the amount of cDNA used is high, it is possible to saturate the signal from the expanded band artifactually increase the signal from other components. To check this possibility, templates were diluted as much as 100-fold before spectratype analysis. As shown in Fig 2, the BV 5.1 band is easily observed at dilutions of 1:100 (Fig 2A) and 1:10 (Fig 2B). No such pattern was observed in PBMC from either patient cultured with PF4 alone, with heparin alone, or with buffer (data not shown). Spectratype analysis of serially diluted DNA templates from normal subjects whose PBMC were cultured under the same conditions failed to show selection for any BV families. In the example shown (Fig 2C), which was developed at a dilution of 1:10, a few scattered, faint bands are seen, but there was no focusing of a BV 5.1 band. In patient 1, narrowing of the TCR spectratype to one or two prominent bands was also observed in BV families 13, 8, 17, 18, 6.1, and 6.2 (Fig 2A). Quantitation of the various PCR products using ImageQuant software (Molecular Dynamics) after normalization against the internal cDNA control (β-actin) showed that the dominant PCR products were those of the BV 5.1 family. Similarly, in patient 2, using a 1:10 dilution of cDNA template, bands of the BV 5.1 family were found to dominate weaker bands from the BV 12, 3, 11, 18, 6.1, and 6.2 families (Fig 2B). These findings indicate that patient T cells that survived in culture for 14 days in the presence of heparin:PF4 complexes preferentially utilized the BV 5.1 gene for expression of the β component of their TCR. In contrast, no particular pattern of receptor utilization was seen in normal PBMC cultured with heparin:PF4 or in patient cells cultured with PF4 alone or heparin alone.
Polyacrylamide gel shows TCR spectratype analysis of T cells from patient 1 (A), patient 2 (B), and a normal subject (C) after 14 days of culture in the presence of heparin:PF4. The spectratypes shown were generated using template cDNA diluted 1:100 (patient 1) and 1:10 (patient 2 and normal subject) to illustrate the dominant PCR products.
Polyacrylamide gel shows TCR spectratype analysis of T cells from patient 1 (A), patient 2 (B), and a normal subject (C) after 14 days of culture in the presence of heparin:PF4. The spectratypes shown were generated using template cDNA diluted 1:100 (patient 1) and 1:10 (patient 2 and normal subject) to illustrate the dominant PCR products.
Sequence analysis of the dominant BV 5.1 TCR spectratype bands showed a CDR3 motif shared by both patients, which suggests antigen-driven skewing of the T-cell repertoire.
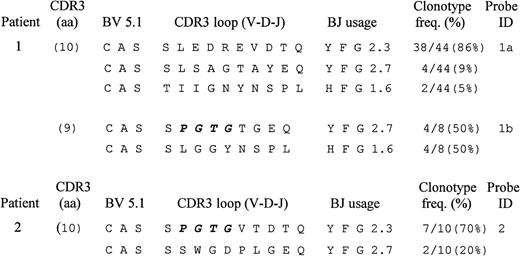
The fact that both patients utilized the BV5.1 family made it interesting to determine whether similar TCR CDR3 sequences were involved in the response in culture. This was accomplished by determining the sequences of the CDR3 for the BV5.1 PCR product. Each patient’s undiluted cDNA template derived from PBMC cultured in the presence of antigen (heparin:PF4) was amplified with primers specific for the BV 5.1 TCR family and was cloned and sequenced as described in Materials and Methods. Deduced amino acid sequences of the identified BV 5.1 CDR3 loops and adjacent regions are shown in Fig3. The dominant BV 5.1 PCR product from patient 1 encoded a CDR3 region 10 amino acids in length (using the nomenclature of Rock et al12), utilized BJ 2.3, and was represented at a frequency of 86% (38 of 44 sequenced clones) within the PCR product of this length. Minor clonotypes, encoding CDR3 regions of the same size, were identified at frequencies of 9% (four of 44 sequenced clones) and 5% (two of 44 sequenced clones). A second BV 5.1 PCR product encoding a CDR3 region nine amino acids in length was found to consist of two clonotypes, each at a frequency of 50% (four of eight sequenced clones), utilizing the BJ regions 2.7 or 1.6. Thus, three high-frequency (≥50%) clonotypes were found in patient 1. The dominant one was associated with the most prominent PCR product and had the CDR3 loop sequence SLEDREVDTQ joined to BJ 2.3. The remaining two had the CDR3 loop sequences SPGTGTGEQ and SLGGYNSPL joined to BJ 2.7 and 1.6, respectively.
Predicted amino acid sequences of BV 5.1 CDR 3 domains of T cells from patients 1 and 2 following 14 days of culture with antigen (heparin:PF4). For each unique sequence identified (clonotype), a portion of the BV and BJ regions and the complete CDR3 loop region is shown. “Clonotype frequency” is the percentage of clones sequenced that encoded the amino acid sequences shown. A common CDR3 loop region motif (P G T G) shared by responding T cells of the 2 patients is highlighted in bold.
Predicted amino acid sequences of BV 5.1 CDR 3 domains of T cells from patients 1 and 2 following 14 days of culture with antigen (heparin:PF4). For each unique sequence identified (clonotype), a portion of the BV and BJ regions and the complete CDR3 loop region is shown. “Clonotype frequency” is the percentage of clones sequenced that encoded the amino acid sequences shown. A common CDR3 loop region motif (P G T G) shared by responding T cells of the 2 patients is highlighted in bold.
The prominent BV 5.1 PCR product from patient 2 encoded a CDR3 region 10 amino acids in length, was present at a frequency of 70% (7 of 10 clones sequenced), and had the CDR3 sequence SPGTGVTDTQ, utilizing BJ 2.3. A second TCR clonotype encoding a CDR3 of the same length was present at a frequency of 20% (2 of 10 sequenced clones) and had the CDR3 sequence SSWGDPLGEQ, utilizing BJ 2.7. No other BV 5.1 PCR products were identified by cloning, despite the detection of a few other minor bands in spectratypes prepared from undiluted cDNA templates.
The shared BV 5.1 motif found in patients 1 and 2 consisted of four identical amino acid residues (PGTG) on the amino proximal side of the dominant TCR clonotype CDR3 region having the amino acid sequences SPGTGTGEQ in the case of patient 1 (Probe 1b, Fig4) and SPGTGVTDTQ in the case of patient 2 (Probe 2, Fig 4). Examination of the DNA sequence for each of the CDR3 regions showed that nucleotide sequences encoding the first and second amino acids (PG) in each CDR3 were generated by random introduction of nucleotides during V(D)J recombination of the TCR β chain, while the next two amino acids (TG) were derived from a D region (D1.1) contribution during V(D)J recombination. This finding suggests that there was selection for T cells bearing a common TCR motif during 14 days of culture with antigen (heparin:PF4 complexes). The common serine residue preceding the PGTG motif is not considered to be a component of the motif because it originates from a genomic DNA sequence of the BV 5.1 gene, rather than from a random recombination event.
DNA and predicted amino acid sequences of TCR BV 5.1 clonotypes selected for hybridization experiments. For each clonotype, a portion of the BV and BJ regions and the complete CDR3 loop region is shown. The CDR3 length and BJ utilization are indicated for each clonotype. CDR3-specific oligonucleotide probe names are shown on the left and the sequence for each is underlined. A shared CDR3 loop region motif (P G T G) present in both HITT patients is highlighted in bold.
DNA and predicted amino acid sequences of TCR BV 5.1 clonotypes selected for hybridization experiments. For each clonotype, a portion of the BV and BJ regions and the complete CDR3 loop region is shown. The CDR3 length and BJ utilization are indicated for each clonotype. CDR3-specific oligonucleotide probe names are shown on the left and the sequence for each is underlined. A shared CDR3 loop region motif (P G T G) present in both HITT patients is highlighted in bold.
The dominant clonotypes are specific for heparin:PF4 complexes.
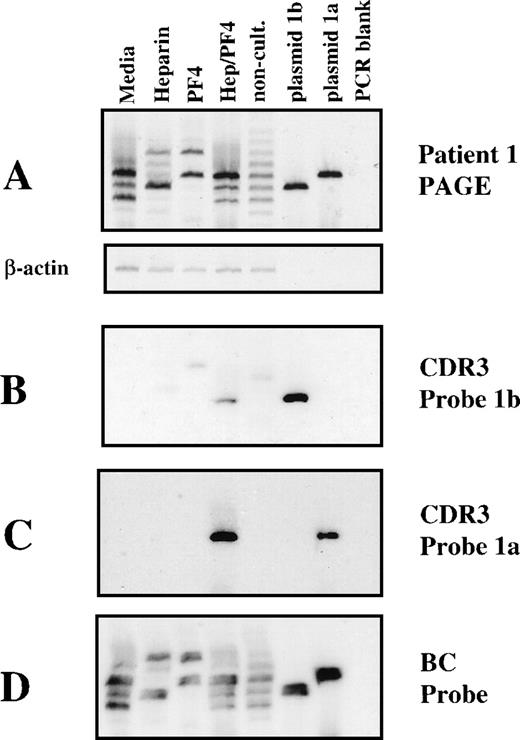
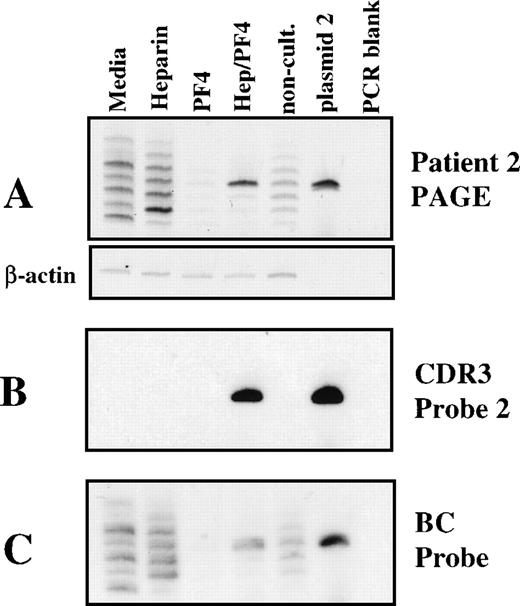
Although the clonotype sequences were determined in cultures containing heparin:PF4, it was important to test for their specificity. To do so, probes identifying each clonotype were used to test the results of cultures in which T cells were stimulated with heparin, PF4, media alone, or heparin:PF4 complexes. BV 5.1 TCR spectratypes of PBMC from patients 1 and 2, uncultured and cultured under various conditions, are shown in Figs 5A and6A. With noncultured cells, a Gaussian distribution was obtained as expected, whereas patterns obtained from cells cultured with media alone, heparin alone, PF4 alone, or heparin:PF4 complexes consisted of several prominent bands of various sizes with no apparent relationship one to another. The sporadic appearance of other bands in Figs 5A and 6A is a consequence of specific or nonspecific stimulation of T cells subsets. In the case of nonspecific stimulation, T-cell subsets may survive or expand in response to some component of the culture medium other than specific antigen. This type of “chatter” in the spectratype signal is typically observed when nondiluted 14-day–cultured DNA templates are tested (Figs 5A and 6A). Figures 5A (plasmid 1a, plasmid 1b lanes) and 6A (plasmid 2 lane) show bands obtained by direct amplification of DNA in plasmids carrying the BV 5.1 CDR3 sequences identified by cloning (see Fig 4). The clonotype content of bands derived from T cells cultured under different conditions (Figs 5A and6A) was then examined by exposing the gels to radiolabeled probes complementary to the dominant BV 5.1 CDR3 nucleotide sequences. As shown in Fig 5B and C, probes complementary to the dominant clonotypes identified in patient 1 (Fig 4, sequences 1a and 1b) hybridized only with bands obtained after culture with heparin:PF4 complexes and with the appropriate plasmids. Similarly, the probe specific for the dominant clonotype identified in patient 2 (Fig 4, sequence 2) hybridized only with a single band obtained after culture with antigen (heparin:PF4) and with the appropriate plasmid.
Analysis of clonotype specificity of cultured PBMC from patient 1. (A) Fluorescent spectratype. The nature of the sample analyzed is identified above each lane. The first 4 lanes are from 14-day cultures containing no addition (media), media alone, heparin alone (heparin), PF4 alone (PF4), or heparin:PF4 complexes (Hep/PF4). The next lane is from uncultured PBMC. The next 2 lanes are from the plasmid DNA clones used to generate the clonotype sequences. The lane marked “PCR blank” is a water control. The actin control amplification is shown as a separate subpanel. (B) Hybridization of DNA from the gel shown in A with a probe for clonotype 1b (radioautogram). The gel was electroblotted onto a nylon membrane and treated as described in Materials and Methods. (C) Rehybridization of the electroblot with a probe specific for clonotype 1a. The membrane was stripped of the previous probe and rehybridized as described. (D) Rehybridization of the membrane with a TCR β constant region probe after stripping of the previous probe.
Analysis of clonotype specificity of cultured PBMC from patient 1. (A) Fluorescent spectratype. The nature of the sample analyzed is identified above each lane. The first 4 lanes are from 14-day cultures containing no addition (media), media alone, heparin alone (heparin), PF4 alone (PF4), or heparin:PF4 complexes (Hep/PF4). The next lane is from uncultured PBMC. The next 2 lanes are from the plasmid DNA clones used to generate the clonotype sequences. The lane marked “PCR blank” is a water control. The actin control amplification is shown as a separate subpanel. (B) Hybridization of DNA from the gel shown in A with a probe for clonotype 1b (radioautogram). The gel was electroblotted onto a nylon membrane and treated as described in Materials and Methods. (C) Rehybridization of the electroblot with a probe specific for clonotype 1a. The membrane was stripped of the previous probe and rehybridized as described. (D) Rehybridization of the membrane with a TCR β constant region probe after stripping of the previous probe.
Analysis of clonotype specificity of cultured PBMC from patient 2. The lanes are labeled as described in Fig 5, except that only 1 plasmid control is included. (A) Spectratype gel. The actin control amplification is shown as a separate subpanel. (B) Hybridization of the DNA from the gel shown in A with a probe for clonotype 2. (C) Rehybridization of the membrane with a TCR β constant region probe after stripping of the previous probe.
Analysis of clonotype specificity of cultured PBMC from patient 2. The lanes are labeled as described in Fig 5, except that only 1 plasmid control is included. (A) Spectratype gel. The actin control amplification is shown as a separate subpanel. (B) Hybridization of the DNA from the gel shown in A with a probe for clonotype 2. (C) Rehybridization of the membrane with a TCR β constant region probe after stripping of the previous probe.
None of the tested probes hybridized with bands of the same size or other sizes identified in control cultures except for very weak interaction of Probe 1b with a band 9 bp larger from cells cultured with PF4 alone and one 6 bp larger from noncultured cells (Fig 5B). No additional bands were identified even after prolonged autoradiograph exposures (7 days). As a check on the integrity of the spectratype gels, the blots were stripped of probe and were rehybridized with a radiolabeled oligonucleotide specific for the β-chain constant region present in each PCR product. All bands visible in the original gels (Figs 5A and 6A) were recognized by this probe (Figs 5D and 6C), which indicates that all were present when blotting with the clonotype-specific probes was performed. An exception is the faint band in Lane 3 (PF4 only) of Fig 6A, which was not recognized in 6C because the amount of DNA present was below the threshold level for detection in the electroblot/stringency hybridization protocol employed. Since, within the limits of detection, the clonotype-specific probes exhibited little or no binding to the bands identified in spectratypes from control cultures (heparin alone, PF4 alone, medium alone), these results argue strongly that the high-frequency clonotypes observed in patients 1 and 2 after 14 days of culture were the result of specific stimulation by complexes of heparin and PF4.
DISCUSSION
It is now clear that heparin-induced thrombocytopenia/thrombosis is almost invariably associated with antibodies that recognize epitopes on heparin:PF4 complexes.5,13,14 The heparin molecule itself appears not to be targeted, because polyanionic macromolecules like polyvinyl phosphate that have no structural relationship to heparin also form complexes with PF4 that contain the full spectrum of target antigens.15 On the basis of these and other recent observations,16 it seems almost certain that HITT antibodies recognize conformational determinants that are created on PF4 when it binds to a linear, polyanionic molecule of length sufficient to span about half the circumference of the PF4 tetramer.15 Although studies of the humoral immune response have yielded important information about the nature of the B-cell involvement in HITT, studies to characterize the contribution of T cells have not yet been reported. It is likely that the antibody response associated with HITT is dependent on T-cell help, because PF4 is a protein antigen, antibodies associated with clinical disease are usually of high titer,8 and the most abundant antibody species identified in patients are usually of the IgG or IgA isotypes.8 17 The purpose of our investigation was to determine whether a T-cell response to heparin:PF4 complexes could be demonstrated in vitro, and if so, whether the components of the T-cell repertoire involved in this response could be identified.
Our approach to identification of T cells responding to heparin:PF4 complexes was to restimulate T cells from the peripheral blood of patients with recent HITT. The responding repertoire was analyzed by CDR3 length analysis of the expressed TCR β-chain genes using spectratyping.9,11 A typical spectratype shows a Gaussian distribution of bands with a 3-bp spacing characteristic of a complex repertoire of in-frame TCR rearrangements. Upon culture, the repertoire will shift depending on the loss, persistence, or expansion of T cells upon contact with antigen. We have used this approach to define responses to major histocompatability complex (MHC) class II alloantigens18 to class I–restricted cytotoxic responses,19 and to platelet glycoprotein (GP)IIIa polymorphisms associated with neonatal alloimmune thrombocytopenia.20 However, the experiments reported here are the first in which a complex antigen has been used for stimulation of T cells in culture.
As expected from what is known about the diversity of the TCR repertoire, TCR spectratypes from unstimulated PBMC of the HITT patients studied did not differ significantly from those of normal subjects (Fig 1A, B, and C). However, after stimulation in culture for 14 days in the presence of heparin:PF4 complexes, spectratypes prepared from the T cells of both patients demonstrated persistence of TCR band belonging to the BV 5.1 family (Fig 2). These bands appeared to reflect a specific T-cell response to heparin:PF4 complexes, since they were not observed in cultures containing PF4, heparin, or medium alone.
To investigate the character of the BV 5.1 TCR in responding T cells, the cDNA templates derived from patient cells cultured in the presence of antigen were amplified with primers specific for BV 5.1, and the PCR products were cloned and sequenced. In patient 1, dominant PCR products that encoded a CDR3 10 amino acids in length (86% frequency) and two others that encoded CDR3 nine amino acids in length (each 50% in frequency) were identified. In patient 2, two dominant clonotypes were identified, each encoding a CDR3 10 amino acids in length at frequencies of 70% and 20%, respectively. A nine–amino acid CDR3 from patient 1 and a 10–amino acid CDR3 from patient 2 were of particular interest because they shared peptide motif (PGTG) in their predicted amino acid sequences. By analyzing the identified nucleotide sequences and comparing them with germ-line sequences, it was determined that the hexanucleotide encoding the first and second amino acids (PG) of each tetrapeptide resulted from random introduction of nucleotides during V(D)J recombination of the TCR β chain, whereas the next two amino acids (TG) were the result of a D region (D1.1) contribution (Fig 4). Identification of a common CDR3 motif in the TCR of responding T cells is generally accepted as an indication of a common antigenic stimulus. There have been multiple reports of the conservation of CDR3 motifs in T cells stimulated with known antigens or antigenic peptides.21-30 We have demonstrated motif conservation in T cells stimulated with peptides derived from platelet GPIIIa (β3 integrin)20 and with influenza M1 peptide.19 We interpret our finding of selection for the same CDR motif, constructed from different gene elements in patients with HITT, as an indication that at least one portion of the processed heparin:PF4 complex is recognized by T cells by both patients. The 10–amino acid CDR3 from patient 1, which did not display the motif, could be viewed as a private response specific for that individual.31
Additional evidence that the TCR motifs identified in responding T cells of the patients were antigen-specific was obtained by preparing radiolabeled oligonucleotides complementary to the dominant clonotypes and using these to probe BV 5.1 spectratypes obtained from cultured and noncultured PBMCs. These probes hybridized only with bands of the expected size derived from PBMC cultured in the presence of heparin:PF4 complexes and not with bands derived from uncultured PBMC or from PBMC cultured with PF4, heparin, or medium alone. This finding argues strongly that the high frequency clonotypes observed in both patients after 14 days of culture with heparin:PF4 complexes were the result of specific antigen stimulation. Together, our observations indicate that the helper T-cell response associated with humoral immunity to heparin:PF4 complexes, a hallmark of HITT, can be reproduced in in vitro culture and suggest that further studies in patients with HITT may permit the patterns of T-cell reactivity associated with this condition to be identified.
A question closely related to the specific T-cell response in HITT is the nature of the immunogenic stimulus. Helper T cells are triggered by peptides presented in the context of class II human leukocyte antigen (HLA) molecules on the surface of antigen-presenting cells.32 PF4 released from platelets is presumably processed into peptides, which are presented regularly to T cells in the body, yet antibodies reactive with PF4 are almost never found in normal subjects.2 When heparin is infused, it forms complexes with a reservoir of PF4 normally associated with glycosaminoglycans (GAG) molecules displayed on the luminal surface of endothelial cells.33 How these complexes are metabolized is not known, but it can be speculated that when macrophages process PF4 complexed with heparin, peptides not ordinarily seen by the immune system are generated and presented to helper T cells (cryptic epitopes). Sensitization to “cryptic” epitopes has been documented in murine models of autoimmunity,34,35 in which species the response to one peptide can diversify over time, leading to recognition of other domains on an autoantigen to which there was previous T-cell tolerance.36-39 Our model for studying T-cell responsiveness in HITT should lend itself to future studies of the mechanisms by which peptides derived from PF4 elicit specific T-cell responses.
Supported by Grants No. HL-13629 and HL-44612 from the National Heart, Lung, and Blood Institute.
The publication costs of this article were defrayed in part by page charge payment. This article must therefore be hereby marked “advertisement” in accordance with 18 U.S.C. section 1734 solely to indicate this fact.
REFERENCES
Author notes
Address reprint requests to R.H. Aster, MD, Blood Research Institute, 8727 Watertown Plank Rd, Milwaukee, WI 53226-3548.


This feature is available to Subscribers Only
Sign In or Create an Account Close Modal