Abstract
Dendritic cells (DC) are the main stimulators of primary T-cell responses and, thus, probably play a role in the immune reactions after stem cell transplantation. Very little is known about DC in cord blood (CB) and about their potential involvement in the low incidence and severity of acute graft-versus-host disease after CB transplantation. Here, CBDC were identified as a HLA-DR+ cell population, lacking the CD3, CD11b, CD14, CD16, CD19, CD34, CD56, and glycophorin A lineage markers (lin). This lin−/HLA-DR+population represented 0.3% ± 0.1% (mean ± SD; range, 0.1% to 0.6%; n = 15) of CB mononuclear cells, and CB contained 5.4 ± 3.2 × 10³ CBDC/mL (1.8 to 13.0 × 10³; n = 15). CBDC expressed CD4, CD11a, CD18, CD45RA, CD50, CD54, and CD123, but showed no expression of CD1a, CD11c, CD33, CD40, CD45R0, CD80, CD83, and CD86 and only limited expression of CD58, CD102, and CD116. Despite this immature phenotype, immunomagnetically lin−-enriched CBDC were potent stimulators of allogeneic CB T cells. As few as 266 ± 107 (193 to 530; n = 10) lin−/HLA-DR+ CBDC stimulated a significant response. However, CBDC failed to take up protein or peptide antigens. Thus, in CB there is a prevalence of a DC subpopulation, resembling the CD11c− DC identified in tonsils, the so-called plasmacytoid T cells, which may exert a function distinct from the CD11c+ DC subpopulation.
CORD BLOOD (CB) has emerged as an alternative source of transplantable stem cells; over 600 CB transplantations have been performed.1-3 Remarkably, even for HLA-antigen disparate grafts, the incidence and severity of acute graft-versus-host disease (GVHD) have been low, with the underlying mechanism unknown.
During the afferent phase of GVHD, donor T cells recognizing host antigens are activated, which then either directly mediate or orchestrate the efferent phase of the disease, concurrent with a dysregulation of cytokines.4 CB T cells have normal proliferative responses to primary allostimulation,5 and the frequencies of alloreactive helper and cytotoxic T-cell precursors in CB are similar to or exceed that in adult peripheral blood (PB).6 However, CB T cells are mainly antigen-inexperienced, consistent with their recent thymic emigration.5,7 Thus, the majority of CB T cells have to be activated by dendritic cells (DC), which probably represent the only antigen-presenting cells capable of stimulating a primary T-cell response.8 9
In human PB,10,11 DC have been identified as an HLA-DR+ cell population, lacking expression of antigens typical for other cell lineages (lin−), and based on the expression of CD11c,12 CD33,13 and CD123,14 subpopulations have been described. Although the lin−/HLA-DR+ PBDC have well-developed antigen-uptake capacity15 and stimulate a T-cell response in an allogeneic mixed leukocyte reaction (MLR),10,16,17 this resting or immature DC population lacks or reveals only limited expression of costimulatory molecules, including CD40, CD80, and CD86.10,11,16,17Maturation/activation of PBDC is induced by tissue culture and results in upregulation of the CD40, CD80, and CD86 molecules,10,11,16,17 consistent with a higher T-cell stimulatory activity,11,12,18 but a decrease in the antigen-uptake capacity.15
In addition to their T-cell stimulatory activity, DC also play an important role in T-lymphopoiesis during negative selection of thymocytes19 and have been implicated in peripheral tolerance induction.20,21 Although donor DC are involved in solid-organ graft rejection,22 very little is known about the potential role of donor DC in stem cell transplantation–associated GVHD via indirect presentation of host antigens or peripheral tolerance induction.23
In CB, Langerhans cell–like, Birbeck granules containing cells have been described,24 and an immaturity of the DC compartment has been suggested from the analysis of unseparated, cultured, low-density CB cells.25 However, the frequency, functional state, and immunstimulatory competence of CBDC, which have not been subjected to tissue culture during isolation, are unknown. Therefore, the phenotype and T-cell stimulatory activity of CBDC were characterized directly without prior tissue culture.
MATERIALS AND METHODS
Monoclonal antibodies (MoAb).
The mouse MoAb recognizing the CD3 (UCHT-1; IgG1), CD11a (25.3.1; IgG1), CD11b (BEAR 1; IgG1), CD11c (BU15; IgG1), CD14 (RMO52; IgG2a), CD16 (3G8, IgG1), CD18 (7E4; IgG1), CD19 (J4.119; IgG1), CD34 (QBEND 10; IgG1), CD40 (mAb89; IgG1), CD50 (HP2/19; IgG2a), CD54 (84H10; IgG1), CD56 (C218; IgG1), CD58 (AICD58; IgG2a), CD80 (MAB104; IgG1), CD102 (B-T1; IgG1), glycophorin A (D2.10; IgG1) and isotype controls, phycoerythrin (PE)-conjugated MoAb to CD3 (UCHT-1; IgG1), CD14 (RMO52; IgG2a), CD83 (HB15a; IgG2b), and isotype controls (IgG1, IgG2a), fluorescein-conjugated F(ab′)2 goat anti-mouse IgG + IgM and MoAb to CD4 (13B8.2; IgG1), CD33 (906; IgG2b), CD45R0 (UCHL1; IgG2a), and CD45RA (ALB11, IgG1) were purchased from Coulter (Krefeld, Germany). MoAb to CD86 (FUN-1; IgG1), PE-conjugated anti–HLA-DR (G46-6; IgG2a), and IgG2b isotype control were obtained from Pharmingen (San Diego, CA); MoAb to CD1a (SK9, IgG2b) from Becton Dickinson (Heidelberg, Germany); and MoAb to CD116 (S-20; IgG2a) and CD123 (S-12; IgG1) from Santa Cruz Biotechnology (Santa Cruz, CA). The CD34 progenitor cell isolation kit was purchased from Miltenyi Biotec (Bergisch Gladbach, Germany).
Cell preparation: CBDC, monocytes, and T cells.
Collection of CB in the obstetric departments was performed with the informed consent of the mothers as described previously.26The CB units had a mean (±SD) volume of 60.5 ± 11.5 mL (range, 35 to 95 mL; n = 89) and a white blood cell (WBC) count of 6.0 ± 3.4 × 10⁸ (range, 1.3 to 13.0 × 10⁸; n = 20).
CBDC were isolated according to a slightly modified protocol described previously for PBDC.16 17 Briefly, CB mononuclear cells (CBMC) were rosetted with neuraminidase-treated (Boehringer-Mannheim, Mannheim, Germany) sheep red blood cells (SRBC; Froschek, Mülheim, Germany), and the SRBC− fraction was immunomagnetically depleted of cells positive for the lineage markers CD3, CD11b, CD14, CD16, CD19, CD34, CD56, and glycophorin A using CS depletion columns on a VarioMACS (Miltenyi Biotec). The anti-CD34 reagent was included due to the higher frequency of CD34+ cells in CB compared with PB and their copurification with the lin−/HLA-DR+ CBDC (data not shown).
Monocytes were isolated from the SRBC− fraction by immunomagnetic enrichment of CD14+ cells, using VS+ separation columns on a VarioMACS. The purity of monocyte preparations was 95.4% ± 3.5% (n = 5) as determined by flow cytometry (data not shown).
T cells were isolated from CBMC by rosetting with SRBC (16 hours, 4°C), followed by Ficoll gradient separation and ammoniumchloride lysis of SRBC. Enriched T-cell populations were 74.0% ± 15.4% CD3+ (n = 56; data not shown).
Cell counts were determined on an Abbott Cell-Dyn 3500 analyzer (Abbott, Wiesbaden, Germany), except for immunomagnetically depleted populations for which cell counts were determined manually by trypan blue exclusion.
Immunostaining.
Cells were incubated with saturating concentrations of MoAb for 15 minutes on ice, before labeling with fluorescein-conjugated F(ab′)2 goat anti-mouse IgG + IgM. Next, cells were incubated for 5 minutes at room temperature in 10% mouse serum (Sigma, St Louis, MO), labeled with PE-conjugated MoAb, and then analyzed on an EPICS Elite flow cytometer (Coulter). For staining of CB nucleated cells, samples were treated with fluorescence-activated cell sorter lysing solution before analysis as recommended (Becton Dickinson).
Allogeneic mixed leukocyte reaction (MLR).
Graded doses of lin−-enriched CB cells or monocytes were cocultured with 105 allogeneic CB T cells in a final volume of 200 μL in round-bottom 96-well plates (Greiner, Nürtingen, Germany). After 5 days of culture in RPMI-1640 (GIBCO/Life Technologies, Eggenstein, Germany) supplemented with 10% heat-inactivated fetal calf serum (GIBCO/Life Technologies), 2 mmol/L L-glutamine, 100 U/mL penicillin, and 100 μg/mL streptomycin at 37°C and 5% CO2, cells were pulsed with 5′-bromo-2′deoxy-uridine (BrdU) for 16 hours, and BrdU uptake was determined as recommended by the manufacturer (Boehringer-Mannheim). The two-tailed Student’s t-test was used to determine the statistical significance of data.
Antigen uptake.
Lin−-enriched cells, SRBC− cells, and SRBC+ cells were incubated for 15 minutes at 4°C or 37°C and then pulsed with fluorescein isothiocyanate (FITC)-conjugated Alzheimer’s disease amyloid A4 protein precursor derived peptide (1 μmol/L; DAEFRHDSGYEVHHQKLVFFAEDVGSNKGAIIGLMVGGVV27) or bovine serum albumin (BSA, 5 mmol/L; Molecular Probes, Leiden, The Netherlands) for 60 minutes. At the same time, PE-conjugated MoAb to HLA-DR (lin−-enriched cells), CD14 (SRBC−cells), or CD3 (SRBC+ cells) were added. Next, cells were washed with ice-cold phosphate-buffered saline and fixed with 0.5% formaldehyde in Isoton II solution (Coulter), before flow cytometry analysis.
RESULTS
Frequency and isolation of CBDC.
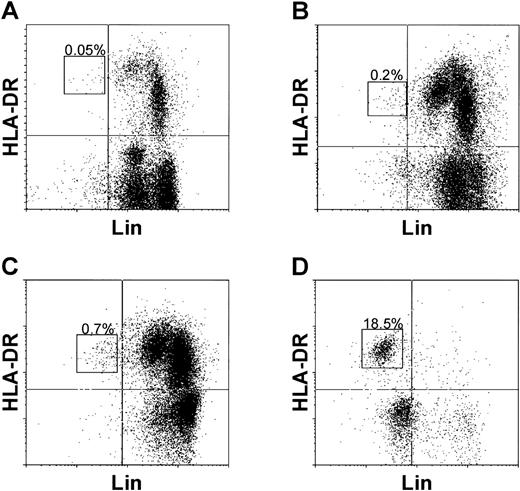
To identify CBDC, CB nucleated cells (Fig1A) and CBMC (Fig 1B) were double labeled with a cocktail of lin-specific (CD3, CD11b, CD14, CD16, CD19, CD34, CD56, and glycophorin A) MoAb and anti–HLA-DR. The lin−/HLA-DR+ CBDC represented below 0.1% (n = 7) and 0.3% ± 0.1% (mean ± SD; n = 15) of CB nucleated cells and CBMC, respectively (Table 1). Calculated for each unit from the percentages of CBDC and CBMC/mL, CB contained 5.4 ± 3.2 × 10³ CBDC/mL (range, 1.8 to 13.0 × 10³; n = 15).
Identification and frequency of lin−/HLA-DR+ CBDC. CB nucleated cells (A), mononuclear cells (B), SRBC− cells (C), and lin−-enriched cells (D) were double labeled with the lineage marker (CD3, CD11b, CD14, CD16, CD19, CD34, CD56, and glycophorin A) specific MoAb and anti–HLA-DR. CBDC are indicated by rectangles and the percentages of lin−/HLA-DR+ CBDC are shown. The quadrants were set according to isotype controls.
Identification and frequency of lin−/HLA-DR+ CBDC. CB nucleated cells (A), mononuclear cells (B), SRBC− cells (C), and lin−-enriched cells (D) were double labeled with the lineage marker (CD3, CD11b, CD14, CD16, CD19, CD34, CD56, and glycophorin A) specific MoAb and anti–HLA-DR. CBDC are indicated by rectangles and the percentages of lin−/HLA-DR+ CBDC are shown. The quadrants were set according to isotype controls.
Lin−/HLA-DR+ CBDC: Frequency, Enrichment, and Recovery in the Course of Isolation
| . | WBC ×107 . | % WBC Recovery . | % HLA-DR+ . | % Lin−/ HLA-DR+ . | CBDC ×105 . | Fold CBDC Enrichment . | % CBDC Recovery . |
|---|---|---|---|---|---|---|---|
| CB | 60.3 ± 33.5 | 100 | 11.5 ± 2.1 | <0.1% | |||
| (13.1-130.4) | (7.7-14.8) | (0.01-0.05) | |||||
| n = 20 | n = 7 | n = 7 | |||||
| CBMC | 12.1 ± 8.1 | 18.5 ± 6.7 | 36.5 ± 8.3 | 0.3 ± 0.1 | 3.4 ± 2.4 | 1 | 100 |
| (0.7-38.0) | (8.6-33.5) | (25.5-55.0) | (0.1-0.6) | (1.0-9.1) | |||
| n = 36 | n = 17 | n = 15 | n = 15 | n = 15 | |||
| SRBC− | 5.2 ± 3.4 | 6.2 ± 2.4 | 63.4 ± 10.2 | 0.5 ± 0.2 | 1.4 ± 0.8 | 2.0 ± 0.7 | 59.5 ± 20.4 |
| (0.4-20.5) | (2.3-9.7) | (48.8-82.1) | (0.2-0.8) | (0.3-3.0) | (0.7-3.1) | (26.9-84.4) | |
| n = 66 | n = 11 | n = 9 | n = 9 | n = 9 | n = 8 | n = 8 | |
| Lin−-enriched | 0.04 ± 0.04 | 0.03 ± 0.01 | 42.4 ± 21.8 | 27.1 ± 18.2 | 0.8 ± 0.7 | 110.4 ± 61.2 | 34.6 ± 21.4 |
| (0.001-0.17) | (0.01-0.04) | (12.8-89.3) | (4.6-70.9) | (0.03-3.0) | (43.0-253.3) | (8.8-71.6) | |
| n = 40 | n = 7 | n = 37 | n = 37 | n = 35 | n = 9 | n = 8 |
In the course of CBDC isolation, CB nucleated cells, CBMC, SRBC− cells, and lin−-enriched cells were double labeled with lin-specific (CD3, CD11b, CD14, CD16, CD19, CD34, CD56, and glycophorin A) MoAb and anti–HLA-DR and analyzed by flow cytometry. WBC counts were determined as described in Materials and Methods. Results are shown as mean ± SD of the number of experiments indicated and ranges are displayed in parentheses.
For CBDC isolation, lin− cells were enriched from CBMC by depletion of SRBC-rosetting cells, followed by immunomagnetic depletion of lin+ cells (Table 1). In the SRBC−fraction (Fig 1C), lin−/HLA-DR+ CBDC represented 0.5% ± 0.2% (n = 9). Immunomagnetic depletion (Fig1D) resulted in a lin− purity of 58.9% ± 19.8% (range, 18.9% to 89.4%; n = 41), with 27.1% ± 18.2% lin−/HLA-DR+ CBDC (n = 37). Thus, CBDC could be enriched 110.4 ± 61.2-fold (n = 9) from CBMC. The total cellular recovery was 0.03% ± 0.01% (n = 7), with a CBDC recovery from CBMC of 34.6% ± 21.4% (n = 8), yielding 0.8 ± 0.7 × 10⁵ CBDC per CB unit or 1.3 ± 1.2 × 10³CBDC/mL CB (range, 0.1 to 5.5 × 10³/mL; n = 35).
Functional competence of lin−/HLA-DR+ CBDC.
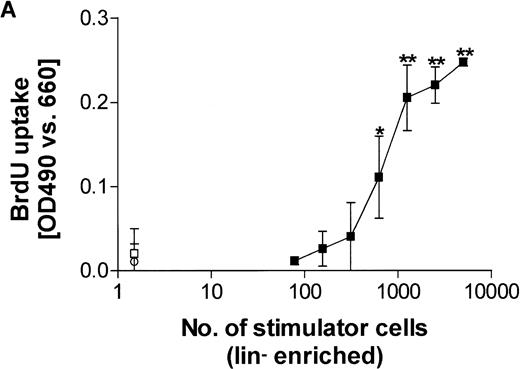
To determine the stimulatory capacity of lin−-enriched CB cells, graded doses of lin−-enriched cells were cocultured with 105 allogeneic CB T cells, and after 5 days BrdU uptake was determined. A representative experiment is shown in Fig2A. Lin− CB cells revealed potent allostimulatory activity, and 2,557 ± 2,077 (range, 313 to 5,000; n = 11) lin−-enriched cells stimulated a significant T-cell response.
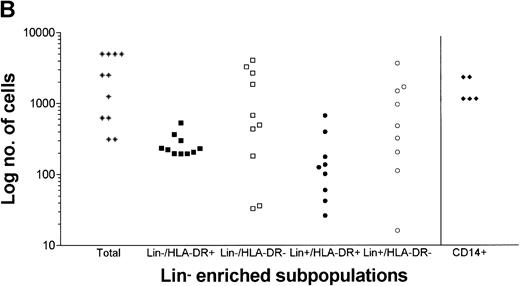
T-cell stimulatory capacity of CBDC. (A) Graded doses of lin−- (CD3, CD11b, CD14, CD16, CD19, CD34, CD56, and glycophorin A negative) enriched CB cells were cocultured with 105 allogeneic CB T cells and after 5 days, BrdU uptake was determined (▪). Results are presented as mean ± SD of triplicates. Background BrdU uptake of lin−-enriched cells (□) and T cells (○) alone are shown. Statistical significance (**P < .01 and *P < .05) is indicated. (B) For the minimal number of lin− enriched stimulator cells (total, 2,557 ± 2,077; n = 11), which stimulated a significant response, the cell numbers of the lin−/HLA-DR+ (266 ± 107; n = 10), lin−/HLA-DR− (1,362 ± 1,476; n = 10), lin+/HLA-DR+ (192 ± 210; n = 9), and lin+/HLA-DR−(991 ± 1,168; n = 9) subpopulations, composing the lin−-enriched cells, are shown. The numbers of CD14+ monocytes (1,627 ± 642; n = 5) required for significant stimulation are indicated for comparison.
T-cell stimulatory capacity of CBDC. (A) Graded doses of lin−- (CD3, CD11b, CD14, CD16, CD19, CD34, CD56, and glycophorin A negative) enriched CB cells were cocultured with 105 allogeneic CB T cells and after 5 days, BrdU uptake was determined (▪). Results are presented as mean ± SD of triplicates. Background BrdU uptake of lin−-enriched cells (□) and T cells (○) alone are shown. Statistical significance (**P < .01 and *P < .05) is indicated. (B) For the minimal number of lin− enriched stimulator cells (total, 2,557 ± 2,077; n = 11), which stimulated a significant response, the cell numbers of the lin−/HLA-DR+ (266 ± 107; n = 10), lin−/HLA-DR− (1,362 ± 1,476; n = 10), lin+/HLA-DR+ (192 ± 210; n = 9), and lin+/HLA-DR−(991 ± 1,168; n = 9) subpopulations, composing the lin−-enriched cells, are shown. The numbers of CD14+ monocytes (1,627 ± 642; n = 5) required for significant stimulation are indicated for comparison.
When the cell numbers of the individual subpopulations (lin−/HLA-DR+, lin−/HLA-DR−, lin+/HLA-DR+, and lin+/HLA-DR−) were determined, composing the minimal numbers of lin−-enriched stimulator cells required for a significant response, only the number of lin−/HLA-DR+ CBDC correlated with the stimulatory capacity of lin−-enriched cells (Fig 2B). In 10 independent experiments, 266 ± 107 (193 to 530) lin−/HLA-DR+ CBDC were present in the stimulator population, which induced a significant response of allogeneic CB T cells. CB monocytes showed a lower stimulatory activity, and 1,627 ± 642 (range, 1,155 to 2,330; n = 5) CD14+ monocytes were required for the stimulation of a significant allogeneic CB T-cell response (Fig 2B).
Phenotype of directly isolated CBDC.
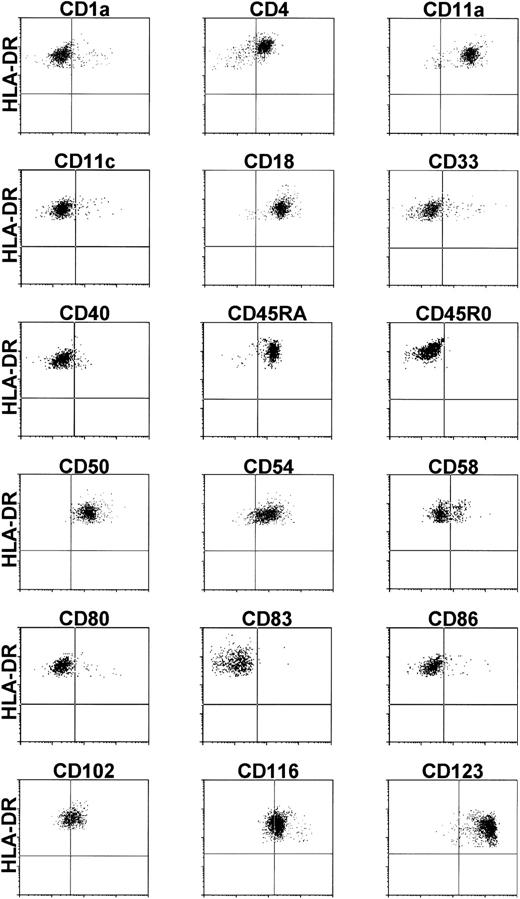
To determine the expression of adhesion and costimulatory molecules on CBDC, lin−-enriched CB cells were double labeled with the individual MoAb and anti–HLA-DR. A representative compilation of results of at least three independent experiments is shown in Fig3. CBDC expressed CD4, CD11a, CD18, CD45RA, CD50, CD54, and CD123; showed no expression of CD1a, CD11c, CD33, CD40, CD45R0, CD80, CD83, and CD86; and showed weak expression or at least expression on a subpopulation of CD58, CD102, and CD116.
Phenotype of CBDC. Lin− (CD3, CD11b, CD14, CD16, CD19, CD34, CD56, and glycophorin A negative) enriched CB cells were double labeled with the MoAb specific for the molecules indicated and anti–HLA-DR. Lin−/HLA-DR+ CBDC were gated electronically. The quadrants were set according to isotype controls.
Phenotype of CBDC. Lin− (CD3, CD11b, CD14, CD16, CD19, CD34, CD56, and glycophorin A negative) enriched CB cells were double labeled with the MoAb specific for the molecules indicated and anti–HLA-DR. Lin−/HLA-DR+ CBDC were gated electronically. The quadrants were set according to isotype controls.
Antigen uptake capability of CBDC.
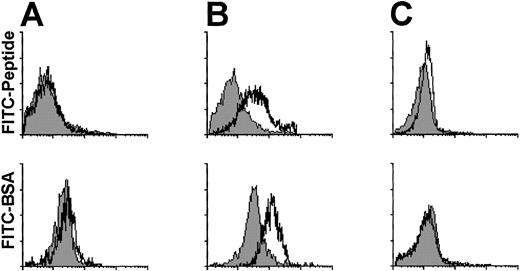
The peptide- and protein-uptake capability of CBDC was evaluated by flow cytometry (Fig 4). After 60 minutes of antigen pulse at 4°C and 37°C, only for monocytes (Fig 4B), but not for CBDC (Fig 4A) or T cells (Fig 4C), an uptake of FITC-conjugated peptide or BSA was detected.
Antigen uptake capability of CBDC. Lin−(CD3, CD11b, CD14, CD16, CD19, CD34, CD56, and glycophorin A negative) enriched CB cells (A), SRBC− cells (B), and SRBC+ cells (C) were pulsed for 60 minutes at 4°C (filled histograms) or 37°C (open histograms) with FITC-conjugated peptide (upper panel) or BSA (lower panel) in the presence of MoAb to HLA-DR (A), CD14 (B), and CD3 (C), respectively. FITC fluorescence of gated HLA-DR+, CD14+, and CD3+ cells is shown on an arbitrary 4-log scale.
Antigen uptake capability of CBDC. Lin−(CD3, CD11b, CD14, CD16, CD19, CD34, CD56, and glycophorin A negative) enriched CB cells (A), SRBC− cells (B), and SRBC+ cells (C) were pulsed for 60 minutes at 4°C (filled histograms) or 37°C (open histograms) with FITC-conjugated peptide (upper panel) or BSA (lower panel) in the presence of MoAb to HLA-DR (A), CD14 (B), and CD3 (C), respectively. FITC fluorescence of gated HLA-DR+, CD14+, and CD3+ cells is shown on an arbitrary 4-log scale.
DISCUSSION
Fresh CBDC were identified as a lin−/HLA-DR+population, representing 0.3% ± 0.1% of CBMC. Thus, there were approximately 5,000 CBDC/mL CB. A frequency of DC below 1% also has been suggested for PB,9,12 and HLA-DR+/lin−/CD123high PBDC represent 0.47% ± 0.14% of PBMC.14 In contrast to PB lin-specific MoAb cocktails,11,12 for CB anti-CD34 MoAb had to be included, due to the higher frequency of CD34+ cells in CB that coexpressed HLA-DR. The lin−/HLA-DR+ CBDC were enriched by immunomagnetic depletion of lin+ cells, and a final purity of 27.1% ± 18.2% with a recovery of 34.6% ± 21.4% was achieved. Lin−/HLA-DR− cells were the major contaminating population. It may be possible to further improve CBDC purity by inclusion of a CD45R0-specific MoAb, which was positive on lin−/HLA-DR−–contaminating cells (data not shown) but not on CBDC, which has been reported by O’Doherty et al11 for the isolation of PBDC. However, since CD45RA and CD45R0 expression discriminates DC subpopulations and changes with DC activation/maturation,11 DC subpopulations may be lost using this approach. Crosslinking of surface molecules on DC may alter their phenotype and functional activity. Therefore, positive selection (eg, for CD4) to further improve DC purity was not used.
Lin−-enriched CB cells stimulated a proliferative response of allogeneic CB T cells and only the number of lin−/HLA-DR+ cells correlated with the stimulatory capacity of lin− enriched preparations. Approximately 250 lin−/HLA-DR+ cells were required for the stimulation of a significant response, in contrast to approximately 1,600 monocytes. Thus, CBDC appear to be functionally competent and are potent stimulators on a per cell basis. Whether they stimulate a T-cell response to the same extent and quality (eg, cytokine production) as their counterparts in PB requires further investigation. However, studies by Roncarolo et al5 have shown that the stimulatory capacity of CBMC in an allogeneic MLR is reduced compared with PBMC. Furthermore, Hunt et al25 have reported a reduced accessory cell activity of cultured, unseparated low-density CB cells for T-cell mitogenic responses, and from these results have suggested an functional immaturity of CBDC.
Activation/maturation of PBDC is accompanied by pronounced changes in surface molecule expression, consistent with a transition from antigen uptake to antigen presentation/T-cell stimulation.9-12,16-18 Here, fresh CBDC displayed a phenotype similar to resting/immature PBDC. They expressed the CD4, CD11a, CD18, CD45RA, CD50, and CD54 molecules, but revealed no expression of CD1a, CD40, CD45R0, CD80, CD83, and CD86, and only limited expression of CD58 and CD102. The stimulation of allogeneic T-cell proliferation in the absence of costimulatory molecule CD40, CD80, and CD86 expression suggests that they are upregulated in the course of the MLR, either due to tissue culture conditions or to T-cell feedback signaling. Similar results have been reported for PBDC, and inhibition studies have shown a functional contribution of CD40 and CD86 to PBDC T-cell stimulation despite initial lack of CD40 and CD86 expression.16,17 Furthermore, reverse transcription-polymerase chain reaction analysis has suggested the upregulation of CD80 on PBDC in the course of the MLR.16
Interestingly, lin−/HLA-DR+ CBDC were CD11c−/CD33−/CD116low/CD123highand, thus, displayed a phenotype comparable to the recently described DC population in T-cell–rich extrafollicular areas of tonsils, the so-called plasmacytoid T cells.14,28 Like this DC population in tonsils,28 CBDC failed to take up peptide or protein antigens. A similar DC population also has been described in PB,12-14 although CD11c− DC account only for approximately 50% of PBDC.12 Thus, there is a prevalence of CD11c− DC in CB compared with PB, although preliminary results suggest that at least in some CB, a minor population of lindim/HLA-DRhigh/CD11c+ cells is detectable. Whether CBDC belong to a lymphoid lineage of DC and require interleukin-3 for survival as suggested by Grouard et al28for the plasmacytoid T cells in tonsils, or to a myeloid lineage as shown by Olweus et al14 for HLA-DR+/lin−/CD123+ DC, or whether they are identical to the CD11c−/CD116low/CD123high DC2 described previously, which in contrast to CD11c+/CD116high/CD123low DC1 preferentially induce a TH2 response, remains to be determined. However, like the CD11c− DC in tonsils,28 CBDC seem to differ functionally from other DC subpopulations because they lack antigen uptake capacity, and consistent with this observation, Olweus et al14 suggested that HLA-DR+/lin−/CD123+ DC can migrate to lymphoid tissues independently of inflammation and foreign antigens and without initiating an immune response.
ACKNOWLEDGMENT
We thank all gynecology and obstetric departments participating in the Düsseldorf cord blood banking program.
Supported by a grant from the German José Carreras Leukemia Foundation and by EU-DGX EUROCORD.
The publication costs of this article were defrayed in part by page charge payment. This article must therefore be hereby marked “advertisement” in accordance with 18 U.S.C. section 1734 solely to indicate this fact.
REFERENCES
Author notes
Address reprint requests to Peter Wernet, MD, Bone Marrow Donor Center, Heinrich Heine University Medical Center, Moorenstrasse 5, Bldg 14.80, 40225 Düsseldorf, Germany; e-mail:KMSZ@UNI-DUESSELDORF.DE.

This feature is available to Subscribers Only
Sign In or Create an Account Close Modal