Abstract
The 55-kD urokinase (uPA) receptor (uPAR, CD87) is capable of binding uPA and may be involved in regulating cell-associated plasminogen activation and pericellular proteolysis. While investigating the relationship between uPAR levels and plasmin generation, we found that uPA-catalyzed plasminogen activation is stimulated by cells which do not express uPAR. This uPAR-independent mechanism appears to be at least as effective in vitro as uPAR-dependent stimulation, such that stimulation on the order of 30-fold was observed, resulting from improvements in both apparent kcat and apparent Km. The mechanism depends on simultaneous binding of both uPA and plasminogen to the cell and requires the presence of the amino-terminal fragment (ATF), available in single chain and two chain high-molecular-weight uPA, but not low-molecular-weight uPA. Stimulation was observed in all leukemic cell lines investigated at similar optimum concentrations of 106to 107 cells/mL and may be more general. A mechanism is proposed whereby uPA can associate with binding sites on the cell surface of lower affinity, but higher capacity than uPAR, but these are sufficient to stimulate plasmin generation even at subphysiologic uPA concentrations. This mechanism is likely to operate under conditions commonly used for in vitro studies and may have some significance in vivo.
THE REGULATION OF plasmin generation by interactions of enzymes (plasminogen activators) and substrate (plasminogen) with fibrin has been extensively studied over many years. More recently, regulation of the plasminogen activation system by cell surface receptors has been explored. This has involved identifying cell surface components on a wide variety of cell types which are able to bind urokinase (uPA), tissue-type plasminogen activator (tPA), and plasminogen.1,2 Studies on uPA interactions with cells have largely focused on an approximately 55-kD receptor protein, uPAR (CD87). This is a highly glycosylated protein anchored to the cell membrane by a glycosylphosphatidylinositol linkage with a high affinity for active uPA, or the single chain proenzyme form, scuPA (or pro-uPA), binding the ligand via the amino terminal fragment (ATF).3
Early studies on the binding characteristics of uPAR on a variety of cell types were followed by kinetics studies, which correlated the binding of uPA and plasminogen to the cell surface with enhanced plasminogen generation.4,5 Further work has sought to identify a role for uPA/uPAR and the plasminogen activation system in the development, invasion, and metastasis of malignant tumors.6 In addition to a direct role in generating cell bound plasmin, uPAR operates in the clearance pathway for uPA/plasminogen activator inhibitor-1 (PAI-1) complexes when acting in concert with the α2-macroglobulin receptor/low-density lipoprotein (LDL)-receptor related protein (LRP).1,7 It is now also apparent that uPAR involvement in cell adhesion and migration is not restricted to regulation of proteolysis such that uPAR also binds directly to the extracellular matrix protein, vitronectin, in competition with PAI-1, and may have other roles in chemotaxis, interacting with integrins, and in the contact activation system.8-10 Thus, the precise significance of uPAR in the regulation of pericellular plasmin generation is not clear.
To gain a better understanding of how uPAR might regulate plasminogen activation kinetics in vitro and provide an indication of its role in vivo, we have performed a detailed kinetic analysis on a number of leukemic cell lines which had been previously well characterized for cellular receptor expression. Cell lines with known capacities for plasminogen binding and quantitated levels of uPAR expression, in addition to cells negative for uPAR, were used. Our results indicate that caution is necessary when interpreting results from kinetic studies using cells that express uPAR, as other mechanisms exist which can regulate pericellular plasminogen activation by uPA.
MATERIALS AND METHODS
Cell culture.
THP1, U937, Nalm6, and Molt4 cells were cultured in RPMI 1640 with 2 to 4 mmol/L glutamine, 7% to 10% fetal bovine serum, and 1 mmol/L sodium pyruvate (pyruvate excluded for U937 cells) (Sigma Chemical Co, Poole, UK, or Life Technologies Ltd, Paisley, UK). Cells were grown to a density of 1.5 × 10⁶ to 2.5 × 10⁷cells/mL in the presence of 5% CO2. Cells were harvested by centrifugation and washed three times in serum-free RPMI at 0°C to 4°C. The cell pellet was drained and resuspended with gentle vortexing and acid washed with 0.05 mol/L glycine buffer, pH 3.5, containing 0.1 mol/L NaCl for 2 to 3 minutes on ice.11Cells were washed twice with RPMI for final counting, resuspension, and dilution in assay buffer (below) containing human albumin at 1 mg/mL.
Plasminogen activation kinetics.
Plasminogen activation reactions were performed in microtiter plates in reaction volumes of 100 μL consisting of 20 μL enzyme at a final concentration of 15 pmol/L uPA, as full-length two-chain uPA (high-molecular-weight [HMW] uPA), single-chain full-length uPA (scuPA or pro-uPA), or two-chain low-molecular-weight uPA (LMW uPA) unless otherwise stated, 40 μL cells (final concentration range between 103 and 108cells/mL) and 40 μL substrate mix containing plasminogen at a final concentration of approximately 100 nmol/L and chromogenic substrate S-2251 (Val-Leu-Lys-p-nitroanilide; Chromogenix, Mölndal, Sweden) at a final concentration of 0.15 mmol/L. Full-length uPA and truncated, recombinant LMW-uPA were gifts from Abbott Laboratories (Chicago, IL). Full-length, two-chain uPA (HMW uPA) was prepared from scuPA by activation of 500 nmol/L scuPA with 25 nmol/L plasmin for 10 minutes at 37°C, pH 7.4, conditions previously found to give full activation of the zymogen as monitored using HMW uPA International Standard (code 87/594, National Institute for Biological Standards and Control, South Mimms, UK). After activation, enzyme was flash frozen and stored in aliquots at −40°C until required. Glu-plasminogen was from Enzyme Research Laboratories (Swansea, UK) and lys-plasminogen was from Immuno (Vienna, Austria). Reactions were performed in assay buffer consisting of Tris HCl buffer, pH 7.4, at 37°C and a final ionic strength of 0.12, containing 1 mg/mL human albumin. In experiments with higher concentrations of uPA (up to 60 pmol/L) or varying plasminogen concentrations, reaction volumes remained 100 μL. Cells were incubated for 10 to 15 minutes at 37°C with uPA to equilibrate before substrates were added to begin the reaction. Where 2 mmol/L tranexamic acid (Sigma Chemical Co) was present, this was added before plasminogen. Absorbance was monitored at 405 nm using a Thermomax thermostatted plate reader (Molecular Devices Corp, Stanford, CA) producing the expected exponential increase for p-nitroanilide resulting from linear plasmin production. Rates of plasmin production were calculated from slopes of plots of optical density (OD) versus (seconds)2generated automatically from Thermomax data by a program specifically written for this purpose (J. Waterman-Smith, Molecular Devices, Crawley, UK). These slopes are proportional to plasmin generation and were calculated using Enzfitter (Elsevier, Cambridge, UK) as outlined previously.12,13 Slopes were calculated from ΔOD readings up to 0.1 before significant substrate depletion. Plasmin generation could be calculated from rates of OD/s2 by dividing by the constant 22 310 OD [mol/L]−1 s−1from previously determined values for the Km and kcat of plasmin on S-2251 and the extinction coefficient of p-nitroanilide under these conditions.13 Simultaneous kinetic experiments were performed with and without added uPA to control for intrinsic activator synthesized by the cells and bound to the surface remaining after the low pH wash.
R3 anti-uPAR monoclonal antibody was a gift from Dr Vince Ellis (Thrombosis Research Institute, London, UK) and was preincubated with U937 cells and Nalm6 cells to block uPAR as previously described.14 Suspensions of approximately 2 × 10⁷ cells/mL were incubated for 30 minutes with 225 nmol/L R3 in serum-free RPMI at 37°C (calculated to be >100-fold excess of R3 over uPAR). Cells were pelleted, resuspended, and split into two fractions for incubation with 1 nmol/L HMW uPA or no enzyme for 30 minutes at 37°C before further washing and determination of bound enzyme activity in plasminogen activation assays consisting of 100 nmol/L glu-plasminogen and approximately 106 cells/mL. Activation was also monitored in parallel reactions containing these cells with 100 nmol/L glu-plasminogen plus 15 pmol/L HMW uPA added to the final activation mixture. All activation rates were determined in triplicate, as described above.
Phenylmethyl sulfonyl fluoride (PMSF)-uPA.
Active-site–blocked uPA was prepared by treating active uPA with 2 rounds of 2 mmol/L PMSF (Sigma Chemical Co) followed by dialysis to remove excess free PMSF, as previously described.15
Radioligand labeling and binding studies.
uPA was radiolabeled using a modified chloramine-T method using 1.6 μmol/L uPA (Ukidan, Serono, Italy) with Na125I (Amersham Life Science, Bucks, UK) and 0.6 mg/mL chloramine-T (Sigma Chemical Co) in phosphate-buffered saline (PBS) for 30 seconds. The reaction was stopped with the addition of 1.2 mg/mL Na metabisulphate and PBS containing 0.5% human serum albumin and 1% KI. Radiolabeled protein was isolated using G-25 Sephadex (Sigma Chemical Co). For cell binding studies, Nalm6 and U937 cells were washed in RPMI-1640 three times followed by acid wash at pH 3.5, two further washes in RPMI-1640, and finally resuspended in HEPES buffered saline, pH 7.4. Ligand binding assays were performed by incubating125I-uPA (0 to 4.0 nmol/L) with washed cells (5 × 10⁶ cells/mL) in a total reaction volume of 200 μL for 2 hours at 4°C. Cells were then separated from the whole reaction mixture by centrifugation of aliquots in 20% sucrose solution. A parallel set of reactions was incubated in the presence of at least 30-fold excess of unlabeled uPA to determine nonspecifically bound radioactivity. Low-affinity binding sites were investigated using higher concentrations of uPA (up to 5.2 μmol/L) and cell bound uPA measured by enzyme activity as previously described.16 In these experiments, 100 μL of 2.5 × 10⁶ Nalm6 cells/mL were incubated with a range of uPA concentrations for 30 minutes at room temperature before bound and free uPA were separated by centrifugation through 20% sucrose, as above. Bound enzyme was determined in plasminogen activation assays with glu-plasminogen, as described above. Parallel experiments were performed without cells to determine the amount of free uPA carryover in kinetic assays. These activities were subtracted from specifically bound rates before data analysis. All incubations and activity determinations were performed in triplicate.
RESULTS
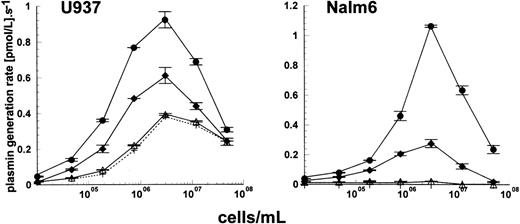
The leukemic cell lines used in this study have previously been well characterized in terms of their expression of uPAR.17 Based on the results from these studies, cell lines could be grouped into two sets: those that expressed uPAR (THP1 and U937) and those that had very low or undetectable levels of uPAR by fluorescence-activated cell sorting (FACS) analysis and radioligand binding studies and the absence of uPAR mRNA by Northern blot analysis (Nalm6 and Molt4).17Detailed studies have been performed using these cell types and results are shown for U937 in comparison with Nalm6. The additional experiments performed using THP1 and Molt4 (which are not shown) supported the findings obtained using U937 and Nalm6. Initial studies used a kinetic approach to investigate how the level of cell surface uPAR might regulate plasminogen activation by uPA. Native glu- or truncated lys-plasminogen could be used in activation experiments and gave similar results, the only difference being higher activation rates using lys-plasminogen as substrate. Figure1 shows how activation rates of 100 nmol/L glu-plasminogen by 15 pmol/L uPA were affected by increasing concentrations of U937 cells (uPAR-positive) and Nalm6 cells (uPAR-negative). Three forms of uPA were included, full-length two-chain uPA (also known as HMW uPA), LMW uPA (lacking the amino-terminal fragment of full-length uPA), and scuPA. In the absence of added uPA, a significant activation rate of glu-plasminogen by U937 cells was observed, explained as tightly bound endogenous activator not removed by the acid washing step. Incubation of HMW uPA or scuPA with these cells produced further stimulation of plasminogen activation rate. LMW uPA activity was unaffected by the presence of cells, supporting the idea that binding and stimulation with these cells requires the ATF of uPA, missing in LMW uPA. In parallel experiments with Nalm6 cells, shown in Fig 1, it was clear that no activation of plasminogen occurred in the absence of added uPA, as expected for this cell line which does not produce uPAR. However, adding HMW uPA or scuPA with plasminogen to cells produced a similar pattern of stimulation as that seen with U937. Thus, there appears to be a uPAR-independent mechanism of stimulation of plasminogen activation by uPA on Nalm6 cells.
Activation of glu-plasminogen by uPA in the presence of cells. Plasmin generation rates were determined in the presence of 100 nmol/L glu-plasminogen with 15 pmol/L enzyme as HMW uPA (•), scuPA (⧫), and LMW uPA (▵) or no added enzyme (+, dashed line) in the presence of varying concentrations of U937 cells or Nalm6 cells. Values shown are mean ± standard error (SE), n = 2.
Activation of glu-plasminogen by uPA in the presence of cells. Plasmin generation rates were determined in the presence of 100 nmol/L glu-plasminogen with 15 pmol/L enzyme as HMW uPA (•), scuPA (⧫), and LMW uPA (▵) or no added enzyme (+, dashed line) in the presence of varying concentrations of U937 cells or Nalm6 cells. Values shown are mean ± standard error (SE), n = 2.
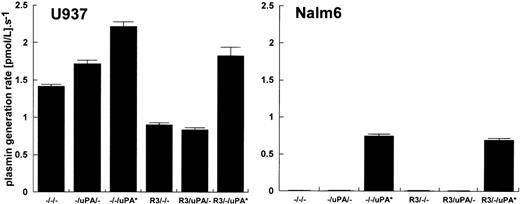
To investigate this mechanism further, a comparison of U937 and Nalm6 cells was performed using a monoclonal antibody, R3, which binds to uPAR and blocks uPA binding. The results from these experiments are shown in Fig 2. In this case, neither cell type was acid washed before use to assess the endogenous level of bound uPA in culture on U937 cells and Nalm6 cells. The results from this study support the conclusions from Fig 1, clearly indicating that R3 has no effect on the behavior of Nalm6 cells. Nalm6 cells had no stimulatory activity whether taken directly from culture or incubated with R3 and/or uPA before final separation and addition to plasminogen solution. U937 cells expressed significant plasminogen activation potential, which could be reduced by R3 and further binding of added uPA could be blocked. However, in both cell types, there was an additional mechanism of stimulation of plasminogen activation apparent when HMW uPA was added to the final activation reaction mixture containing cells and plasminogen.
The effect of preincubation of R3 anti-uPAR antibody on stimulation of plasmin generation by U937 cells and Nalm6 cells. Data show the activation rate with 100 nmol/L glu-plasminogen and cell concentrations of 2.83 ± 0.4 × 10⁶ U937 cells/mL and 1.25 ± 0.27 × 10⁶ Nalm6 cells/mL. Before activity determinations, approximately 2 × 10⁷ cells/mL were preincubated with 225 nmol/L R3 antibody (columns labeled R3) or 1 nmol/L uPA (columns labeled uPA). R3/uPA denotes preincubation with R3 followed by incubation with 1 nmol/L uPA. Columns labeled uPA* show activation rates where 15 pmol/L uPA was added to the final reaction mixture containing cells and 100 nmol/L glu-plasminogen. Activation rates are shown as mean ± SE, n = 3.
The effect of preincubation of R3 anti-uPAR antibody on stimulation of plasmin generation by U937 cells and Nalm6 cells. Data show the activation rate with 100 nmol/L glu-plasminogen and cell concentrations of 2.83 ± 0.4 × 10⁶ U937 cells/mL and 1.25 ± 0.27 × 10⁶ Nalm6 cells/mL. Before activity determinations, approximately 2 × 10⁷ cells/mL were preincubated with 225 nmol/L R3 antibody (columns labeled R3) or 1 nmol/L uPA (columns labeled uPA). R3/uPA denotes preincubation with R3 followed by incubation with 1 nmol/L uPA. Columns labeled uPA* show activation rates where 15 pmol/L uPA was added to the final reaction mixture containing cells and 100 nmol/L glu-plasminogen. Activation rates are shown as mean ± SE, n = 3.
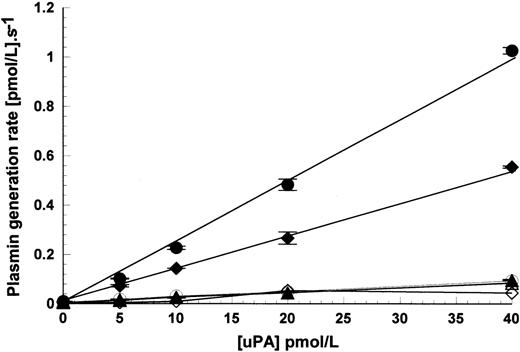
The results shown in Figs 1 and 2 used fixed concentrations of uPA at 15 pmol/L when added to the activation reaction mixture. Figure 3 shows how uPA concentration affects the rate of activation using HMW uPA, scuPA, and LMW uPA as above. Over the range used, there was a linear relationship between response and activation rate. These results also clearly show that LMW uPA remains nonreactive with these cells, at least over this range.
Effect of uPA concentration on plasmin generation rates in the presence of Nalm6 cells. Plasmin generation rates were measured in the presence of 1.1 × 10⁷ cells/mL, 100 nmol/L glu-plasminogen, and increasing concentrations of HMW uPA (•), scuPA (⧫), and LMW uPA (▴). Open symbols show the activation rates under the same conditions, but in the absence of cells. Activation rates are shown as mean ± SE, n = 2.
Effect of uPA concentration on plasmin generation rates in the presence of Nalm6 cells. Plasmin generation rates were measured in the presence of 1.1 × 10⁷ cells/mL, 100 nmol/L glu-plasminogen, and increasing concentrations of HMW uPA (•), scuPA (⧫), and LMW uPA (▴). Open symbols show the activation rates under the same conditions, but in the absence of cells. Activation rates are shown as mean ± SE, n = 2.
Mechanism of stimulation.
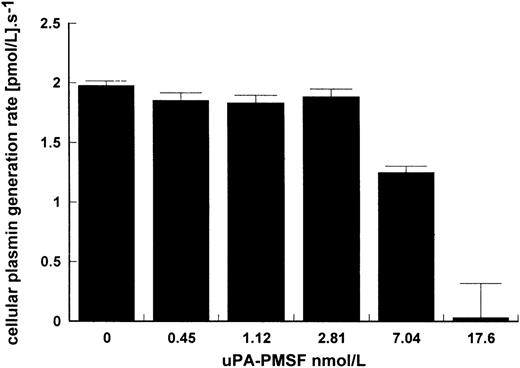
That uPA binding is necessary for stimulation of kinetics is suggested in Figs 1 and 3 where LMW uPA, which is able to activate plasminogen in free solution, was not affected by the presence of cells. This may be explained by the lack of the ATF domain eliminating binding of LMW uPA to the cell. The requirement for binding to give improved kinetics is further shown in Fig 4 where activation due to surface-bound HMW uPA was determined in the presence of increasing concentrations of inactive uPA pretreated with PMSF to block the active site. At high enough concentrations of uPA-PMSF and with sufficient excess of inhibited uPA over active uPA, cellular binding sites on Nalm6 cells were blocked and stimulation of plasminogen activation substantially inhibited.
Inhibition of cell stimulation of plasminogen activation by uPA-PMSF. Increasing amounts of uPA treated with PMSF were incubated in reaction mixtures of 15 pmol/L uPA, 100 nmol/L lys-plasminogen, and 5 × 10⁶ Nalm6 cells/mL. Plasmin generation rate was calculated for increasing levels of uPA-PMSF showing how binding of active uPA to cells is necessary for cell stimulation of kinetics. Rates were determined in triplicate and are expressed as mean ± SE.
Inhibition of cell stimulation of plasminogen activation by uPA-PMSF. Increasing amounts of uPA treated with PMSF were incubated in reaction mixtures of 15 pmol/L uPA, 100 nmol/L lys-plasminogen, and 5 × 10⁶ Nalm6 cells/mL. Plasmin generation rate was calculated for increasing levels of uPA-PMSF showing how binding of active uPA to cells is necessary for cell stimulation of kinetics. Rates were determined in triplicate and are expressed as mean ± SE.
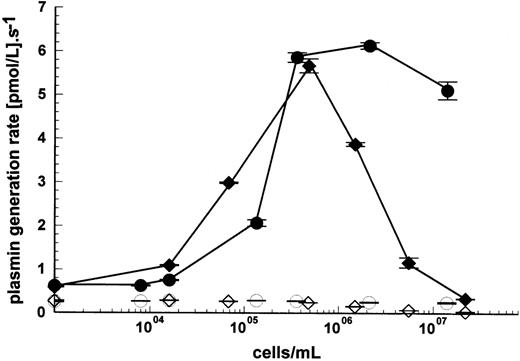
The mechanism of stimulation appears to require simultaneous binding of both activator (uPA) and substrate (plasminogen) to the cell surface, and previous work has shown that the cell lines used in this study are able to bind plasminogen with moderate affinity (Kd ≈ 1 μmol/L), but with high capacity (1.1 to 3.1 × 10⁶molecules per cell at 100 nmol/L plasminogen).17Plasminogen binding to a variety of effector molecules is known to be mediated via one or more kringle domains, and these interactions can be blocked by lysine analogs such as tranexamic acid. Kinetic analysis in the presence of 2 mmol/L tranexamic acid clearly showed the abolition of any stimulation of plasminogen activation by the cell types shown in Fig 5, U937 and Nalm6. Similar results were obtained using Molt4 cells. Lys-plasminogen was used for these studies in preference to glu-plasminogen to avoid tranexamic acid-induced conformational changes in glu-plasminogen which stimulate plasminogen activation by uPA.18 The most likely explanation for the abolition of cell stimulation by tranexamic acid is prevention of surface receptor-plasminogen binding, as there is no evidence for an interaction between uPA and lysine analogs.
Inhibition of cell stimulation of plasminogen activation by tranexamic acid. Plasmin generation rates for the activation of 100 nmol/L lys-plasminogen in the presence of 15 pmol/L uPA and varying cell concentrations were determined using U937 (⧫) or Nalm6 cells (•). The open symbols show results from reaction mixtures also containing 2 mmol/L tranexamic acid to block plasminogen binding to U937 cells (◊) and Nalm6 cells (○). Activation rates are shown as mean ± SE, n = 2.
Inhibition of cell stimulation of plasminogen activation by tranexamic acid. Plasmin generation rates for the activation of 100 nmol/L lys-plasminogen in the presence of 15 pmol/L uPA and varying cell concentrations were determined using U937 (⧫) or Nalm6 cells (•). The open symbols show results from reaction mixtures also containing 2 mmol/L tranexamic acid to block plasminogen binding to U937 cells (◊) and Nalm6 cells (○). Activation rates are shown as mean ± SE, n = 2.
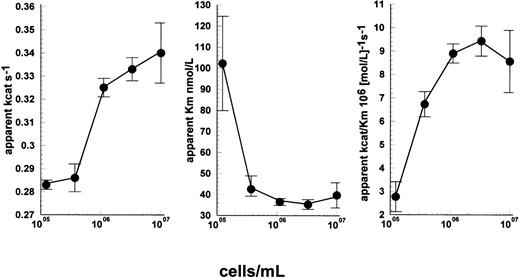
More detailed studies, simultaneously varying plasminogen concentration and cell density using a uPAR-negative cell line, Nalm6, suggest that enhancement of kinetics due to cells resulted from increases in apparent kcat and reductions in apparent Kmboth contributing to improved observed enzyme efficiency (kcat/Km). This can be seen in Fig 6A through C. In the absence of cells, a linear relationship between rate and plasminogen concentration was observed indicating [S] ≪ Km. Under these conditions, apparent kcat/Km ≈ rate/[uPA]×[S] and was calculated to be 3.1 × 10⁵M−1s−1. Nonlinear regression analysis of Michaelis Menten curves determined over a range of plasminogen concentrations at each cell density shown in Fig 6 provided values for apparent kcat and apparent Km, and a maximum value of 9.4 × 10⁶M−1s−1 was obtained at 3.3 × 10⁶ cells/mL. Therefore, the improvement in apparent kcat/Km was on the order of 30-fold under these conditions.
Detailed kinetic characterization of the activation of lys-plasminogen by uPA in the presence of Nalm6 cells. Reaction mixtures contained 15 pmol/L uPA, and both cell and lys-plasminogen concentration were varied. Curve fitting to the standard Michaelis Menten equation was performed to determine the apparent kcat (A), Km (B), and kcat/Km (C) values for each cell concentration. Improvements in both apparent Km and kcat are responsible for the observed stimulation of kinetics by cells under these conditions. Values are shown as fitted estimates from direct fitting to Michaelis Menten equation ± SE of the mean.
Detailed kinetic characterization of the activation of lys-plasminogen by uPA in the presence of Nalm6 cells. Reaction mixtures contained 15 pmol/L uPA, and both cell and lys-plasminogen concentration were varied. Curve fitting to the standard Michaelis Menten equation was performed to determine the apparent kcat (A), Km (B), and kcat/Km (C) values for each cell concentration. Improvements in both apparent Km and kcat are responsible for the observed stimulation of kinetics by cells under these conditions. Values are shown as fitted estimates from direct fitting to Michaelis Menten equation ± SE of the mean.
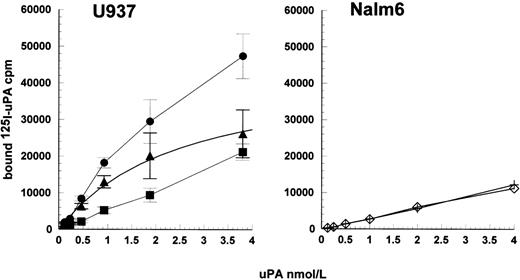
To probe binding strength of uPA-cell interactions further, radiolabeled uPA was used in binding studies with U937 cells and with Nalm6. The results of these studies are shown in Fig 7, clearly demonstrating a dramatic difference in binding behavior. U937 cells bound 125I-uPA in a specific and saturable way with an apparent Kd of 2.5 ± 0.7 nmol/L, and 44,000 sites per cell, for the representative experiment shown. Under the same conditions, Nalm6 cells showed no specific binding of uPA, in agreement with previous studies using Nalm6 cells and radiolabeled ATF.17 Significantly, the number of Nalm6 cells used in these studies was 2 × 10⁶cells/mL, which was fourfold more concentrated than used in the U937 binding experiments. Hence, if Nalm6 cells had high-affinity receptors present in lower numbers, they would be more readily detected at these higher cell concentrations.
Radioligand binding studies using 125I-uPA with U937 cells and Nalm6 cells. A low concentration range (up to 4 nmol/L) 125I-uPA was incubated with U937 or Nalm6 cells, at 107 cells/mL. With U937 cells, bound and free radioactivity were separated by centrifugation through sucrose solution and bound uPA counted (•). Nonspecifically bound radioactivity was determined in the presence of excess cold uPA (▪) and specifically bound counts were calculated (▴). Values are shown as mean ± SE, n = 4. Specific binding to Nalm6 cells was negligible as shown by the overlap of the response with 125I-uPA (◊) and125I-uPA plus cold uPA (+).
Radioligand binding studies using 125I-uPA with U937 cells and Nalm6 cells. A low concentration range (up to 4 nmol/L) 125I-uPA was incubated with U937 or Nalm6 cells, at 107 cells/mL. With U937 cells, bound and free radioactivity were separated by centrifugation through sucrose solution and bound uPA counted (•). Nonspecifically bound radioactivity was determined in the presence of excess cold uPA (▪) and specifically bound counts were calculated (▴). Values are shown as mean ± SE, n = 4. Specific binding to Nalm6 cells was negligible as shown by the overlap of the response with 125I-uPA (◊) and125I-uPA plus cold uPA (+).
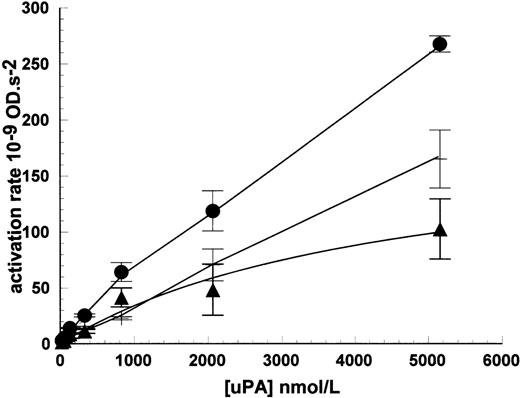
The lack of high-affinity binding sites detectable in radioligand binding studies, but the apparent requirement for binding in kinetic studies, do not appear consistent observations. However, the kinetic results observed can be accounted for by weaker binding sites, which are observable at higher uPA concentration ranges. This is shown in Fig 8 using HMW uPA up to 5,200 nmol/L where bound uPA was measured in plasminogen activation assays. When the activity of noncell-bound activity was subtracted, a binding isotherm was generated and curve fitting provided an estimate for the Kd = 4,500 ± 200 nmol/L and maximum activation rate was 190 ± 50 × 10−9 OD/s2, in the representative experiment shown. Theoretically, the maximum rate could be used to determine maximum binding sites/cell, but this requires understanding of the specific activity of cell-bound uPA, which is not known. Furthermore, any such determination is likely to be unreliable for such a weak interaction because significant dissociation of the bound enzyme will be likely to occur during the timescale of sample processing. Such a weak interaction as this may be considered insignificant compared with higher affinity interactions such as uPA-uPAR, around 2 nmol/L, especially when uPA is present in kinetic assays in sub nmol/L concentrations. However, the equilibrium between uPA and receptor, and hence the amount of uPA bound, will also depend on the level of receptor present such that high levels will shift the equilibrium toward complex formation.
Detection of low-affinity binding sites for uPA on Nalm6 cells. Cells were incubated with uPA and bound, active enzyme measured in plasminogen activation assays (•). Parallel incubations without cells were included to determine uPA carryover into activity assays (+). Specifically bound uPA (▴) was calculated by subtraction of nonbound activity and data fitted to a single binding isotherm to determine the Kd for uPA binding to Nalm6. Values are expressed as mean ± SE, n = 3.
Detection of low-affinity binding sites for uPA on Nalm6 cells. Cells were incubated with uPA and bound, active enzyme measured in plasminogen activation assays (•). Parallel incubations without cells were included to determine uPA carryover into activity assays (+). Specifically bound uPA (▴) was calculated by subtraction of nonbound activity and data fitted to a single binding isotherm to determine the Kd for uPA binding to Nalm6. Values are expressed as mean ± SE, n = 3.
DISCUSSION
A great deal of information has been collected over the last decade or so on the occurrence, structure, and properties of the 55-kD urokinase receptor, uPAR, or CD87. These studies have shown that many cell types expressing this receptor are able to bind full-length uPA with high-affinity and bound two-chain uPA or scuPA is available to express proteolytic activity as measured by stimulation of plasminogen activation rates.19 However, the precise functional significance of uPAR in regulating pericellular plasmin generation is not known as alternative roles have also been identified, for example, as a clearance pathway for uPA/PAI-1 complexes in concert with the α2-macroglobulin/LRP receptor,7 or the focalization of plasmin generation to an area of the cell surface to enhance directional migration.20 Additional involvement of uPAR binding to vitronectin and integrins8,10 could modulate cell migration and invasion thereby accounting for the observation that overexpression of cell surface uPAR is a prognostic marker for tumor progression in a number of neoplasms.7 20
To gain some quantitative understanding of how cell surface uPAR levels may specifically regulate the kinetics of plasminogen activation by uPA, we performed detailed kinetic studies using well-characterized cell lines positive and negative for uPAR. The cell lines used have previously been studied by Northern blot analysis to determine levels of uPAR mRNA, by enzyme-linked immunosorbent assay (ELISA) analysis using monoclonal antibodies for uPAR to quantitate uPAR in cell lysates, and surface expression of functional uPAR has been quantitated by FACS analysis and radioligand binding studies to measure uPAR levels and affinities for uPA.17 Immediately apparent from the kinetic studies reported here was that cellular stimulation of plasminogen activation rates can occur in the absence of uPAR. The present work is in agreement with previous work implicating uPAR expression in the high-affinity binding of uPA from cell culture. However, results with uPAR-negative cell lines, Nalm6 and Molt4, showed that although these cells had very low levels or no intrinsic plasminogen activation capacity when taken from culture and were not able to bind uPA with high-affinity, they were able to stimulate plasminogen activation in reaction mixtures containing exogenous uPA and plasminogen. The uPAR-independent mechanism also operates on U937 cells, which express uPAR, as shown in Fig 2 where uPAR was blocked using the anti-uPAR monoclonal antibody, R3. The relative contribution of each mechanism to overall plasmin generation will depend on the conditions used, and although all of the uPAR sites on U937 cells in this experiment were probably fully occupied after incubation with 1 nmol/L uPA (as used in Fig 2), the non-uPAR mechanism may be well below saturation. This is suggested in the linear dose response curve for added uPA in Fig 3 (up to 40 pmol/L) and from the considerations above indicating that a low-affinity interaction requires high capacity binding to explain the observed results. Thus, in the presence of high concentrations of uPA, the non–uPAR-dependent mechanism would be increasingly significant in terms of generating plasmin activity.
It has been shown previously with U937 cells that the mechanism of stimulation requires simultaneous binding of both activator (uPA) and substrate (plasminogen) to the cell surface, which acts as a template21 22 to catalyze ternary complex formation. Thus, LMW uPA activity is generally observed to be unaffected by the presence of cells, as the ATF region is absent and needed for binding to uPAR. Similarly, lysine analogs are also known to prevent cell surface plasminogen activation by blocking the binding of plasminogen to cells, and this effect is attributed solely to plasminogen, as there is no evidence for any form of uPA binding to lysine or analogs with any significant affinity. The uPAR-independent mechanism on Nalm6 cells behaves in the same way as can be seen from the results shown in Figs 1and 3, where the importance of the ATF region is highlighted, and data in Fig 5, which show the need for plasminogen binding.
An alternative mechanism was also considered in which binding and conformational changes in bound plasminogen were only sensitive to full-length uPA (HMW uPA and scuPA). This is theoretically possible, as glu-plasminogen interaction with kringle binding effectors can produce large conformational changes leading to enhanced rates of activation by uPA.18 Thus, it is conceivable that conformational changes resulting in enhanced uPA activation arise when plasminogen binds to cells. In the work presented here, plasminogen binding to cells is necessary for kinetic stimulation to occur, but must also be accompanied by activator binding, as suggested by LMW uPA experiments and shown by uPA-PMSF data. Additionally, lys-plasminogen, which does not undergo major conformational changes on binding of lysine analogs or peptide ligands, works in a similar way to glu-plasminogen in our kinetic assays. By analogy with previous work21 22 and taking all of these observations together, the most likely conclusions must be that uPAR-dependent and uPAR-independent mechanisms both rely on simultaneous cell binding of uPA and plasminogen to accelerate plasmin generation.
The levels of stimulation observed in the present studies are comparable to previous studies performed under similar conditions of temperature, pH, and ionic strength.5,16,19,23 Using U937 cells, stimulation of plasminogen activation between sixfold to 70-fold with uPA and either lys- or glu-plasminogen (the higher rates being observed with acid washed cells), has been reported.19 22This was entirely due to improvements in apparent Km. With Nalm6 cells, we observed kinetic stimulation of approximately 30-fold due to improvements in both apparent kcat and Km (Fig 6). Similar results were also observed using U937 cells, where intrinsic activity (in the absence of added uPA) was subtracted (data not shown). Due to the difficulties in determining and interpreting Km and kcat values in the presence of cells, it is likely that these differing observations are more likely due to differences in experimental technique rather than real differences in intrinsic catalytic parameters.
Receptor identity.
Radioligand binding studies shown in Fig 7 gave similar results to those previously reported for uPAR affinity and/or receptor numbers/cell, especially using full-length125I-uPA24,25 or unlabeled uPA.16,19 Full-length uPA ligand was chosen in preference to labeled ATF to explore the possibility of interactions with additional binding domains of uPA with uPAR-negative cells. However, no specific binding of 125I-uPA at low concentrations (up to 4 nmol/L) could be detected with Nalm6 cells in these assays. Hence, some other mechanism must be operating in the uPAR-negative cells. This alternative mechanism could conceivably be due to very low levels of uPAR, levels below the limit of detection of all the methods used to investigate uPAR expression in these cell lines. However, ELISA, FACS analysis, and Northern blotting are sensitive techniques so that low levels of uPAR can be detected. Because the affinity for uPA is in the 10−9 to 10−10 mol/L range and the concentration of uPA used in the present studies was only 15 pmol/L, the probability of complex formation must be very small if receptor concentration is very low so as to be nondetectable. Very low levels of uPAR on Nalm6 cells would presumably lead to lower levels of stimulation compared with U937 cells, which was not observed. This explanation is also ruled out by the data shown in Fig 2, where cells were preincubated with R3 antibody and/or uPA. The alternative possibility is that a higher number of receptors, or less specific binding sites, exist with a lower affinity, as shown when investigating binding with a higher range of uPA concentrations (Fig 8). Receptors with low-affinity are viewed as unimportant if the Kd for the interaction is significantly higher than the concentration of activator used. However, this is an oversimplification. It is true that the Kd of uPA for uPAR is in the same range as the plasma concentration of scuPA, but this is not an absolute requirement for a significant level of complex formation. For example, the proportion of added uPA (at 15 pmol/L) in complex with receptor, in the presence of 107 cells/mL can be calculated assuming a free equilibrium between receptor and ligand. For a Kd of 2 nmol/L, as observed here with U937 cells, and 104 or 105receptors per cell (covering the range reported for uPAR), the proportion of bound uPA is 7.6% and 45.2%, respectively. Similarly, a Kd of 4,500 nmol/L and a high level of binding sites of 107 or 108 per cell (cf plasminogen binding sites) would give bound uPA of 3.6% and 26.9%, respectively. Radioligand binding studies as usually performed require stable, high-affinity interactions that persist during the separation of bound and free ligand. Weak complexes will dissociate during isolation, which explains the differences between the curves for U937 and Nalm6 in Fig 7.26 However, when cells, plasminogen, and uPA are mixed, an equilibrium can be established where a significant proportion of enzyme is associated with cells and stimulation of activation will be observed.
The nature of the low-affinity binding sites for uPA is not known, but could be proteins or other cell surface components. These would include glycosaminoglycans or gangliosides, which have also previously been implicated in plasminogen binding to cell surfaces. Miles et al27 have shown an interaction between gangliosides and uPA, which could be relevant to the present study. Binding to insoluble gangliosides was found to be specific and saturable with an ID50 of 12 nmol/L, indicating a high-affinity interaction. Clearly this interaction is of significantly higher affinity than that identified in the present study where a 400-fold greater Kdvalue was estimated from Fig 8. However, this does not exclude ganglioside involvement in the uPAR-independent mechanisms. Alternatively, heparin has also been shown to interact with uPA and, significantly, this interaction was with the kringle domain in the ATF region of full-length uPA, hence LMW uPA did not bind.28The affinity of heparin for isolated kringle from uPA was determined by nuclear magnetic resonance (NMR). Binding was sensitive to salt concentration such that the lowest Kd was observed in salt-free solution and was only 17.0 μmol/L, increasing to 62.9 μmol/L in the presence of 0.125 mol/L NaCl. Thus, this interaction appears to be weaker than our estimated 4.5 μmol/L for binding of full-length uPA to Nalm6 cells. However, cell surface glycosaminoglycans may contribute to the interaction we observed, as there may be a particular cell surface component with a particular structure and a higher affinity for uPA than the low molecular weight heparin used by Stephens et al.28 The difficulty in studying these two binding candidates using kinetic methods with cells is that both gangliosides and heparin are known to bind plasminogen. Hence, it is not possible to use soluble ligands to attempt to block uPA binding to cells and observe the effects on plasmin generation, as the soluble ligands will also block plasminogen binding.
The likelihood of alternative receptors to the 55-kD uPAR is also increased by recent observations. Although a great deal of work has been performed on this receptor, other interactions have been reported.29,30 A multiplicity of receptors might also be expected by analogy with heterogeneous nature of plasminogen and tPA receptors.1,2 Support for the notion of redundancy or overlap of function in the plasminogen activation system also comes from recent work using knockout mice. Specifically, mice with no functional uPAR were found to have almost normal development, hemostasis, and fertility,31 suggesting the cellular functions of uPAR can be replaced by other biochemical systems. The mechanism described in this work may represent the postulated uPA binding sites discussed recently, responsible for enhanced pericellular proteolysis in uPAR-deficient mice.32 Further work is required to identify the uPA binding sites distinct from uPAR, although this may be a challenging task due to the low-affinity interactions involved.
ACKNOWLEDGMENT
We are grateful to Abbott Laboratories for providing single-chain uPA and LMW uPA. We thank Drs Keld Dano and Vince Ellis for providing R3 monoclonal antibodies. We thank John Waterman-Smith of Molecular Device Corporation for writing the data handling program used in kinetic data analysis.
Supported by SCS-Generalitat Catalunya; CICYT:SAF96-0376; MaratóTV3/Cancer; Marat TV3/Cardiovascular. We acknowledge the help of the Acciones Integraóas program for providing funds to initiate this research.
The publication costs of this article were defrayed in part by page charge payment. This article must therefore be hereby marked “advertisement” in accordance with 18 U.S.C. section 1734 solely to indicate this fact.
REFERENCES
Author notes
Address reprint requests to Colin Longstaff, PhD, Division of Haematology, NIBSC, Blanche Lane, South Mimms, Herts EN6 3QG, UK; e-mail: clongstaff@nibsc.ac.uk.

This feature is available to Subscribers Only
Sign In or Create an Account Close Modal