Abstract
A stroma-dependent cell line (HB-1) was established from myelogenous leukemic cells of CBA/N mouse. Characterization of the cells showed that HB-1 proliferated on hematopoietic supportive stromal cells (MS-10), but did not survive or proliferate on hematopoietic nonsupportive cells (MS-K). Direct contact between HB-1 and MS-10 appears to be necessary for HB-1 to proliferate on MS-10. We found that interleukin-1α (IL-1α) produced by MS-10 plays a major role in the survival and proliferation of HB-1. IL-11 did not support the proliferation of HB-1 cells by itself, but enhanced the proliferation of HB-1 cells in the presence of IL-1α. The expression of IL-1α and IL-11 was induced in MS-10 by the direct contact with HB-1 cells, and the expression of IL-1 receptor type I (IL-1RI) and interleukin-11 receptor (IL-11R) was induced in HB-1 cells by the attachment of the cells to MS-10. These findings show the existence of two-way interactions between HB-1 and MS-10.
© 1998 by The American Society of Hematology.
BIDIRECTIONAL INTERACTIONS between hematopoietic cells and stromal cells in the marrow microenvironment may be crucially important in hematopoietic regulation.1-4The growth factor dependency and responses of acute myelogenous leukemia (AML) progenitor cells mimic, in many ways, those of normal hematopoietic precursor cells, including responses to factors produced by bone marrow (BM) stromal cells and accessory cells.3,4 Model systems of such interactions in vitro have been very instructive in this regard. For example, the interleukin-3 (IL-3)–dependent murine leukemia cell line DA-1 survives and proliferates when cocultured with the hematopoietic-supportive stromal cell line MS-5 without addition of exogenous IL-3 or other growth factors.5 Coculture of DA-1 and MS-5 is associated with expression of bcl-2 by the DA-1 cells and with expression of granulocyte-macrophage colony-stimulating factor (GM-CSF) by the MS-5 cells.6 There is considerable evidence that IL-1 also plays a major role in hematopoietic regulation by modulating and stimulating progenitor cell proliferation.7-9
In the present study, we examine the survival and proliferation of HB-1 murine AML cells cocultured with the MS-10 hematopoietic supportive stromal cell line. We further examine the proliferative roles of IL-1 and other growth factors and the effects of coculture on expression of growth-related genes.
MATERIALS AND METHODS
Mice.
Female mice of C57B16, CBA/H, CBA/N, and C3H/HeN were purchased from Shizuoka Animal Farm (Hamamatsu City, Japan) and maintained under specific pathogen-free conditions. Ten- to 12-week-old mice were used for experiments.
Cells.
The MS-10 and MS-K stromal cell lines were established from BM of C3H/HeN mice according to previously reported methods and were maintained in α-minimal essential medium (α-MEM) supplemented with 10% (vol/vol) horse serum.5,10 MS-10 cells support the proliferation and differentiation of hematopoietic stem cells in vitro as previously determined for the stromal line MS-5.10 The HB-1 cell line was established from the spleen cells of CBA/N mice in which myelogenous leukemia (M361) was induced by irradiation. HB-1 cells were maintained on MS-10 in α-MEM supplemented with 10% (vol/vol) fetal calf serum (FCS). For cell proliferation experiments, HB-1 cells suspended in α-MEM supplemented with 10% (vol/vol) FCS were overlaid and allowed to adhere onto MS-10 or MS-K cells. Suspended HB-1 cells were counted daily. For further experiments, HB-1 cells cultured on MS-10 cells were harvested and purified from MS-10 by passage through a nylon-glass wool and G-10 column, yielding >98% pure HB-1.11 12 Characterization studies showed that HB-1 survived and proliferated on MS-10, but survival was not supported by cytokines secreted by MS-10. HB-1 cells did not survive on MS-K.
Growth stimulation of HB-1 cells by conditioned medium of MS-10 cells cocultured with HB-1 cells.
To clarify whether MS-10 produce and release soluble factor(s) that support the proliferation of HB-1 cells, 15% of cocultured medium (HB-1 cultured on MS-10 for 5 days) was added into the suspension culture of HB-1 (1 × 10⁵ cells/mL) in α-MEM supplemented with 10% (vol/vol) FCS. The number of HB-1 cells was counted daily.
The requirement of cell contact was investigated by culturing HB-1 cells (1 × 10⁵/mL in α-MEM supplemented with 10% FCS) in the upper chamber of wells separated by Millicell-HA membranes (0.45 μmol/L pore size; Millipore Products Division, Ashby Road, Bedford, MA) from 2-day confluent MS-10 monolayers. The number of HB-1 cells was counted every day.
Growth of HB-1 cells in the presence of interleukins.
Recombinant human IL-1α (rhIL-1α, kindly provided by Dr T. Masuda, Department of Medicine, Kyoto University, Kyoto, Japan) was added at a final concentration of 10 U/mL into the suspension culture of HB-1 cells. Recombinant murine IL-6 (rmIL-6, kindly provided by Dr T. Hirano, Department of Medicine, Osaka University, Osaka, Japan) was added at 10 U/mL. rhIL-11 (specific activity of 2 × 10⁶ U/mg) was purchased from CosmoBio Co, LTD (Tokyo, Japan) and used in culture at 20 U/mL of rhIL-11. Conditioned medium of IL-3–producing STIL-3 leukemic T-cell line (STIL-3 CM)13 was used to substitute rmIL-3. rmGM-CSF (kindly provided by Kirin Brewery Co LTD, Tokyo, Japan) was added at a concentration of 250 U/mL.
HB-1 cells, which were separated from coculture with MS-10 cells, were transferred into plastic culture dishes and cultured in suspension in α-MEM supplemented with 10% (vol/vol) FCS. rhIL-1α, rmIL-6, STIL-3 CM, rhIL-11, or rmGM-CSF was added in the cultured medium of HB-1 cells, respectively. The number of HB-1 cells was counted 6 days later.
To investigate the synergistic effect of IL-6, IL-3, IL-11, and GM-CSF with IL-1α on the proliferation of HB-1 cells, HB-1 cells were separated from MS-10 and cultured in suspension in α-MEM supplemented with 10% (vol/vol) FCS. Recombinant human IL-1α was added in the culture medium of HB-1 cells, and rmIL-6, STIL-3 CM, rmIL-11, or rmGM-CSF was added, respectively. The number of HB-1 cells was counted 6 days later.
Effect of anti-mouse IL-1α and anti-human IL-11 antibody on the growth of HB-1 cells.
To examine effects of IL-1α or IL-11 on the growth of HB-1 cells, effect of anti-mouse IL-1α neutralizing antibody (purchased from CosmoBio Co, LTD) or anti-human IL-11 neutralizing antibody (which cross-reacts with murine IL-11, purchased from Funakoshi Co, LTD, Tokyo, Japan) was diluted with serum-containing medium (from 1:20 to 1:500) for addition to the coculture of HB-1 cells and MS-10. The number of HB-1 cells in suspension was counted every 2 days.
Extraction of total RNA and polymerase chain reaction (PCR).
Total RNA was extracted by the acid guanidinium thiocyanate-phenol-chloroform method.14 Expression of messenger RNA was determined by the reverse transcriptase-PCR (RT-PCR) method as described previously.15 Briefly, 3 μg of total RNA was reverse-transcribed using First-Strand cDNA Synthesis Kit (Pharmacia, Uppsala, Sweden) and used for PCR under the following conditions: final reaction volume of 20 μL with 5 pmol each of two specific primers, at a final concentration of 200 μmol/L of each of deoxyadenosine triphosphate (dATP), deoxythymidine triphosphate (dTTP), deoxyguanosine triphosphate (dGTP), deoxycytidine triphosphate (dCTP), 50 mmol/L KCl, 10 mmol/L Tris-HCl (pH 8.3), 1.5 mmol/L MgCl2, 1 mg/mL gelatin, and 0.5 U GeneTaq DNA polymerase (Nippon Gene, Tokyo, Japan). PCR was performed using Program Temp Control System (ASTEC, Fukuoka City, Japan) for 25 or 35 cycles under the following conditions; 1 minute at 95°C, 2 minutes at 55°C, and 3 minutes at 72°C. Amplified cDNA products were electrophoresed on 2% (wt/vol) Nusieve 3:1 agarose gel (FMC Bio Products, Rockland, ME) and stained with ethidium bromide.
A quantitative PCR analysis was performed to determine the mRNA levels of β-actin, cytokines, and apoptosis-related factors.16We estimated the amount of PCR products after defined cycles of PCR by measuring 32P-labeled nucleotide incorporation. The amount of amplified products of β-actin increased approximately logarithmically up to 30 to 35 cycles. To keep the reaction within nonlimiting conditions and obtain detectable signal of the amplified products of β-actin, we chose 25 cycles of amplification. The mRNA level of various cytokines was lower than that of β-actin. Thus, 35 cycles of amplification was chosen.
Primers for PCR.
The sequences for primer pairs are listed in Tables 1 and2. These sequences were synthesized by Kurashiki Bouseki Co, LTD, Kurashiki City, Japan. Lipopolysaccharide (LPS)-stimulated MS-5 cells were used as positive control of IL-1α and IL-11 production; NFSA cells17 were used as positive control of IL-1β, IL-6, IL-8, G-CSF, M-CSF, and GM-CSF gene expression; ConA-stimulated spleen cells of C3H/HeN were used as positive control of IL-2 and IL-4 gene expression; WEHI-3 was used as positive control of IL-3 gene expression; and nonstimulated MS-5 cells were used as positive control of IL-7 and stem cell factor (SCF) gene expression.
Oligonucletide Primers for the Amplification and Detection of Cytokines
| Molecule . | Sequence Reference . | Primer . | Sequence (5′ to 3′) . | Position . | Predicted Size . |
|---|---|---|---|---|---|
| SCF | Zsebo27 | Forward | TCCTGTGACTGATATGT | 108-125 | 419 bp |
| Backward | GACCTAATGTTGAAGAGA | 509-526 | |||
| G-CSF | Tsuchiya28 | Forward | GCTGTGGCAAAAGTGCACT | 121-138 | 417 bp |
| Backward | ATCTGCTGCCAGATGGTG | 520-537 | |||
| M-CSF | Harrington29 | Forward | ACCCAGCTGCCCGTATAG | 168-185 | 311 bp |
| Backward | AAAGCGCATGGTCTCATC | 461-478 | |||
| GM-CSF | Miyatake30 | Forward | GAGAGAAAGGCTAAGGTCCT | 5-24 | 500 bp |
| Backward | AAAAGCAGCAGTCTGAGAAG | 485-504 | |||
| β-Actin | Tokunaga31 | Forward | TCAGAAGGACTCCTATGTGG | 224-243 | 500 bp |
| Backward | TCTCTTTGATGTCACGCACG | 704-723 |
Oligonucletide Primers for the Amplification and Detection of Interleukins and Receptors
| Molecule . | Sequence Reference . | Primer . | Sequence (5′ to 3′) . | Position . | Predicted Size . |
|---|---|---|---|---|---|
| IL-1α | Lomedico32 | Forward | CAAACTGATGAAGCTCGTCA | 438-457 | 225 bp |
| Backward | TCTCCTTGAGCGCTCACGAA | 643-662 | |||
| IL-1β | Gray33 | Forward | TCATGGGATGATGATGATAACCTGC | 393-418 | 503 bp |
| Backward | CCCATACTTTAGGAAGACACGGATT | 871-895 | |||
| IL-2 | Yokota34 | Forward | TGAGCAGGATGGAGAAT | 224-240 | 360 bp |
| Backward | TGTGTTGTAAGCAGGAG | 576-583 | |||
| IL-3 | Fung35 | Forward | GAGGACCAGAACGAGACA | 10-27 | 537 bp |
| Backward | GGTGCTCTGCCTGCTGTT | 529-546 | |||
| IL-4 | Sideras36 | Forward | ATGGGTCTCAACCCCCAGCTAGT | 88-110 | 399 bp |
| Backward | GCTCTTTAGGCTTTCCAGCTAGT | 464-486 | |||
| IL-6 | Van Snick37 | Forward | TTGGGACTGATGCTGGTG | 91-108 | 426 bp |
| Backward | CTCTTGGTTGAAGATATGAA | 497-516 | |||
| IL-7 | Lupton38 | Forward | GCCTGTCACATCATCTGAGTGCC | 608-630 | 496 bp |
| Backward | CAGGAGGCATCCAGGAACTTCTG | 1081-1103 | |||
| IL-8 | Tekamp-Olson39 | Forward | CACTCCAGACTCCAGCCA | 12-29 | 719 bp |
| Backward | TCCCAACTCACCCTCTCC | 703-720 | |||
| IL-11 | Paul21 | Forward | ATGAACTGTGTTTGTCGCCTG | 1-21 | 200 bp |
| Backward | TCAGCTGGGAATTTGTCTCTC | 180-200 | |||
| IL-1RI | Sims40 | Forward | CTGAGCCCTCGGAATGAGACG | 637-657 | 702 bp |
| Backward | GCTGAAGCCTCCCATATCTCT | 1318-1338 | |||
| IL-11R | Hilton23 | Forward | TTGCCCACCCGCTACCTTACTTC | 418-440 | 431 bp |
| Backward | GCATCTGTTATCACTTCCTCCAA | 826-848 |
Thymine-adenine (TA) cloning and DNA sequencing.
Construction of T vectors, a rapid and general system for direct cloning of unmodified PCR product, was performed with the method described by Marchuk et al.18 19 DNA sequencing was performed with Bca BEST Dideoxy Sequencing Kit (TAKARA Co, LTD, Japan). Using this method, we checked all sequences of the PCR products.
Northern blot.
Total cellular RNA was extracted by the acid guanidinium thiocyanate-phenol-chloroform method.14 For Northern blots, 15 μg RNA were electrophoresed and transferred to a Hybond N+ membrane as described in Paul et al.21 Probes were labeled by 32P using Bca BEST Labeling Kit. Hybridization was performed at 42°C, washed with 2× SSC (33.3 mmol/L NaCl, 33.3 mmol/L C6H5O7Na3•2H2O, pH 7.0), 0.1% (wt/vol) sodium dodecyl sulfate (SDS), and the signal was detected by autoradiography with intensifying screens. The film exposure was for 14 hours at −80°C.
Immunochemistry.
Anti-human IL-11 neutralizing antibody (which cross-reacts with murine IL-11, produced in goats immunized with purified rhIL-11, purchased from Funakoshi Co, LTD) was used for the detection of murine IL-11 molecules. Immunoprecipitations by anti-human IL-11 neutralizing antibody were performed from the conditioned media of nonadherent BM cells cultured on MS-10 for 6, 12, 24, 48, and 72 hours and media from HB-1 cells cultured on MS-10, incubated overnight at 4°C, under gentle rotation. Protein G-agarose was added to the system as an immunoabsorbant and kept for 3 hours at 4°C. The precipitated material was washed three times in 0.05% Tween-20 phosphate-buffered saline (PBS) buffer and boiled for 3 minutes in the buffer containing 125 mmol/L Tris-HCl pH 6.8, 2% (wt/vol) SDS and 5% (vol/vol) 2-mercaptoethanol. The material was subjected to SDS-polyacrylamide gel electrophoresis and Western blot transfer to polyvinylidene difluoride membrane (Millipore, Tokyo, Japan) was performed. The filter was blocked with 0.05% Tween 20-PBS buffer. Incubations were performed with anti-human IL-11 antibody at a 1/400 dilution overnight in 0.05% Tween 20-PBS buffer and detection with antigoat IgG-alkaline phosphatase-conjugated antibody (Santa Cruz Biotechnology, Inc, Santa Cruz, CA) was used for detection of the precipitate.
RESULTS
Growth of HB-1 cells on MS-10.
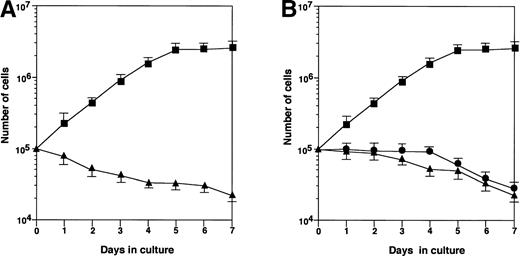
Rapid proliferation of HB-1 cells was supported by coculture on MS-10 cell monolayers, but not on MS-K monolayers (Fig 1A). In an attempt to detect soluble factors produced and released by MS-10 cells cocultured with HB-1 cells, which could support HB-1 proliferation, HB-1 cells were cultured with MS-10 cells or in culture wells separated from MS-10 cells by Millicell membranes (Fig 1B). Neither condition supported HB-1 survival, indicating that cell-to-cell contact was required for HB-1 cell proliferation on MS-10.
Growth of HB-1 cells on hematopoietic supportive stromal cells. (A) HB-1 cells were cultured on hematopoietic supportive stromal cells, MS-10 (▴) or hematopoietic nonsupportive stromal cells, MS-K (▪). The number of HB-1 cells in suspension was counted every day. Data represent mean ± SE. (B) HB-1 cells were cultured on MS-10 cell layer, but separated by Millicell-HA membrane (▴) or cultured in the presence of conditioned medium of the coculture (•). HB-1 cells were directly cultured on MS-10 cells as control (▪). The number of HB-1 cells was counted every day. Data represent mean ± SE.
Growth of HB-1 cells on hematopoietic supportive stromal cells. (A) HB-1 cells were cultured on hematopoietic supportive stromal cells, MS-10 (▴) or hematopoietic nonsupportive stromal cells, MS-K (▪). The number of HB-1 cells in suspension was counted every day. Data represent mean ± SE. (B) HB-1 cells were cultured on MS-10 cell layer, but separated by Millicell-HA membrane (▴) or cultured in the presence of conditioned medium of the coculture (•). HB-1 cells were directly cultured on MS-10 cells as control (▪). The number of HB-1 cells was counted every day. Data represent mean ± SE.
Role of IL-1α and IL-11 in the proliferation of HB-1 cells.
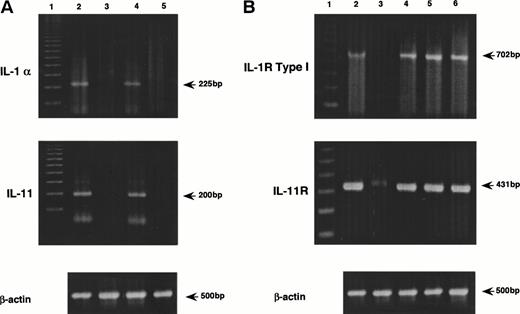
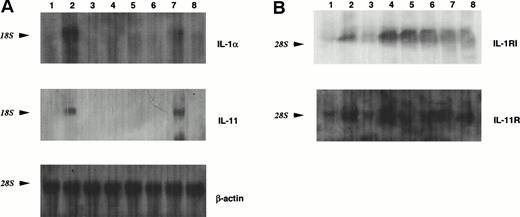
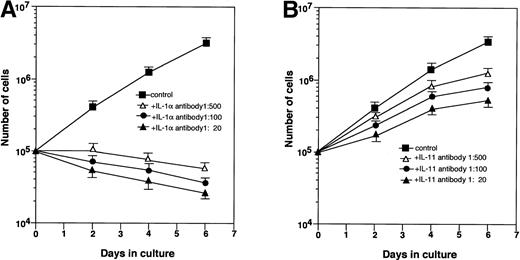
MS-10 cells cocultured with HB-1 cells expressed IL-1α and IL-11, as assessed by both RT-PCR and Northern blot analysis (Figs 2A and3A). IL-1α and IL-11 expression by MS-10 cells cultured alone was not detectable. HB-1 cells proliferated slowly in suspension culture supplemented with rhIL-1α (Table 3). In contrast, rhIL-11, STIL-CM, rmIL-6, and rmGM-CSF individually failed to support HB-1 proliferation. rhIL-11 synergistically enhanced IL-1α–stimulated proliferation. When added to cocultures of HB-1 on MS-10, anti-mouse IL-1α neutralizing antibody blocked proliferation of HB-1; anti-human IL-11 neutralizing antibody slightly inhibited HB-1 proliferation (Fig 4).
PCR analysis of the expression of cytokines in MS-10 cells and their receptors in HB-1 cells by the coculture of MS-10 and HB-1 cells. (A) Expression of IL-1α and IL-11 in MS-10 cells was analyzed by RT-PCR after coculture with HB-1 cells. Each lane represents MS-10 cells alone (lane 3), MS-10 cells cocultured with HB-1 cells (lane 4), and HB-1 cells cocultured with MS-10 cells (lane 5), respectively. LPS-stimulated MS-5 cells were used as positive control (lane 2). Marker was 100 bp ladders (lane 1). (B) Expression of IL-1 receptor type I and IL-11 receptor in HB-1 cells was analyzed by RT-PCR after coculture with MS-10 cells or after IL-1α stimulation. Each lane represents HB-1 cells separated from MS-10 cells for 5 days (lane 3), HB-1 cells cocultured with MS-10 cells (lane 4). HB-1 cells separated from MS-10 cells for 5 days were reseeded on MS-10 cells again and harvested 5 days later (lane 5) or cultured in the presence of IL-1α and harvested 5 days later (10 U/mL) (lane 6). C3H/HeN spleen cells were used as positive control (lane 2). Marker was 100 bp ladders (lane 1).
PCR analysis of the expression of cytokines in MS-10 cells and their receptors in HB-1 cells by the coculture of MS-10 and HB-1 cells. (A) Expression of IL-1α and IL-11 in MS-10 cells was analyzed by RT-PCR after coculture with HB-1 cells. Each lane represents MS-10 cells alone (lane 3), MS-10 cells cocultured with HB-1 cells (lane 4), and HB-1 cells cocultured with MS-10 cells (lane 5), respectively. LPS-stimulated MS-5 cells were used as positive control (lane 2). Marker was 100 bp ladders (lane 1). (B) Expression of IL-1 receptor type I and IL-11 receptor in HB-1 cells was analyzed by RT-PCR after coculture with MS-10 cells or after IL-1α stimulation. Each lane represents HB-1 cells separated from MS-10 cells for 5 days (lane 3), HB-1 cells cocultured with MS-10 cells (lane 4). HB-1 cells separated from MS-10 cells for 5 days were reseeded on MS-10 cells again and harvested 5 days later (lane 5) or cultured in the presence of IL-1α and harvested 5 days later (10 U/mL) (lane 6). C3H/HeN spleen cells were used as positive control (lane 2). Marker was 100 bp ladders (lane 1).
Northern blot analysis of the expression of ILs in MS-10 cells or their receptors in HB-1 cells by the coculture of MS-10 and HB-1 cells. (A) Result of hybridization with the32P-labeled probes for IL-1α and IL-11. A total of 15 μg of total RNA of each sample was loaded in each lane. Each lane represents HB-1 cells separated from MS-10 cells for 5 days (lane 3); HB-1 cells cocultured with MS-10 cells (lane 4); HB-1 cells separated from MS-10 cells for 5 days then reseeded on MS-10 cells again and harvested 5 days later (lane 5); or cultured in the presence of 10 U/mL IL-1α and harvested 5 days later ( lane 6 ); MS-10 cells cocultured with HB-1 cells (lane 7); and MS-10 cells alone (lane 8). LPS-stimulated MS-5 cells were used as positive control (lane 2). MS-5 cells were used as negative control (lane 1). The level of β-actin is shown as control. (B) Result of hybridization with the32P-labeled probes for IL-1RI and IL-11R. A total of 15 μg of total RNA from each sample was loaded in each lane. Each lane represents HB-1 cells separated from MS-10 cells for 5 days (lane 3); HB-1 cells cocultured with MS-10 cells (lane 4); HB-1 cells separated from MS-10 cells for 5 days then reseeded on MS-10 cells again and harvested 5 days later (lane 5); cultured in the presence of 10 U/mL IL-1α and harvested 5 days later (lane 6); MS-10 cells cocultured with HB-1 cells (lane 7); MS-10 cells alone (lane 8). C3H/HeN spleen cells and NIH3T3 cells were used as control. The level of β-actin is shown as control.
Northern blot analysis of the expression of ILs in MS-10 cells or their receptors in HB-1 cells by the coculture of MS-10 and HB-1 cells. (A) Result of hybridization with the32P-labeled probes for IL-1α and IL-11. A total of 15 μg of total RNA of each sample was loaded in each lane. Each lane represents HB-1 cells separated from MS-10 cells for 5 days (lane 3); HB-1 cells cocultured with MS-10 cells (lane 4); HB-1 cells separated from MS-10 cells for 5 days then reseeded on MS-10 cells again and harvested 5 days later (lane 5); or cultured in the presence of 10 U/mL IL-1α and harvested 5 days later ( lane 6 ); MS-10 cells cocultured with HB-1 cells (lane 7); and MS-10 cells alone (lane 8). LPS-stimulated MS-5 cells were used as positive control (lane 2). MS-5 cells were used as negative control (lane 1). The level of β-actin is shown as control. (B) Result of hybridization with the32P-labeled probes for IL-1RI and IL-11R. A total of 15 μg of total RNA from each sample was loaded in each lane. Each lane represents HB-1 cells separated from MS-10 cells for 5 days (lane 3); HB-1 cells cocultured with MS-10 cells (lane 4); HB-1 cells separated from MS-10 cells for 5 days then reseeded on MS-10 cells again and harvested 5 days later (lane 5); cultured in the presence of 10 U/mL IL-1α and harvested 5 days later (lane 6); MS-10 cells cocultured with HB-1 cells (lane 7); MS-10 cells alone (lane 8). C3H/HeN spleen cells and NIH3T3 cells were used as control. The level of β-actin is shown as control.
Effects of Cytokines on the Proliferation of HB-1 Cells
| Interleukin . | Day 6 (×104 no. of cells) . | Ratio . |
|---|---|---|
| HB-1 on MS-10 | 63.0 ± 1.0 | 100 |
| HB-1 in α-MEM alone | 1.4 ± 0.2 | 2.2 |
| rhIL-1α (10 U/mL) | 56.0 ± 2.0 | 88.9 |
| rhIL-1α (10 U/mL) + IL-3 (15% STIL-3C5)* (120 U) | 57.0 ± 4.0 | 95.0 |
| rhIL-1α (10 U/mL) + rmIL-6 (10 U/mL) | 52.5 ± 1.3 | 83.3 |
| rhIL-1α (10 U/mL) + rhIL-11 (20 U/mL) | 101.0 ± 5.2 | 160.0 |
| rhIL-1α (10 U/mL) + rmGM-CSF (250 U/mL) | 58.2 ± 3.4 | 92.9 |
| IL-3 (15% STIL-3C5)* (120 U/mL) | 1.4 ± 0.3 | 2.3 |
| rmIL-6 (10 U/mL) | 1.7 ± 0.5 | 2.8 |
| rhIL-11 (20 U/mL) | 1.8 ± 0.4 | 2.9 |
| rmGM-CSF (250 U/mL) | 1.6 ± 0.3 | 2.5 |
A total of 4 × 10⁴ HB-1 cells were cultured in the presence of each cytokine or on MS-10 cells, and cell numbers were counted at day 6. Ratio represents cell number of each sample to number of HB-1 cells on MS-10 cells on day 6.
Fifteen percent of STIL-3 CM was used. The STIL-3 C5 CM contained about 800 U/mL of IL-3 activity as determined by mast cell-colony formation assay.15 All results represent mean ± SE.
Effect of neutralizing antibodies on the growth of HB-1 cells. HB-1 cells were cultured on MS-10 with or without anti–IL-1α neutralizing antibody (A) or anti–IL-11 neutralizing antibody (B). The number of HB-1 cells was counted every 2 days.
Effect of neutralizing antibodies on the growth of HB-1 cells. HB-1 cells were cultured on MS-10 with or without anti–IL-1α neutralizing antibody (A) or anti–IL-11 neutralizing antibody (B). The number of HB-1 cells was counted every 2 days.
Expression of growth factor genes by MS-10 cocultured with nonadherent BM cells.
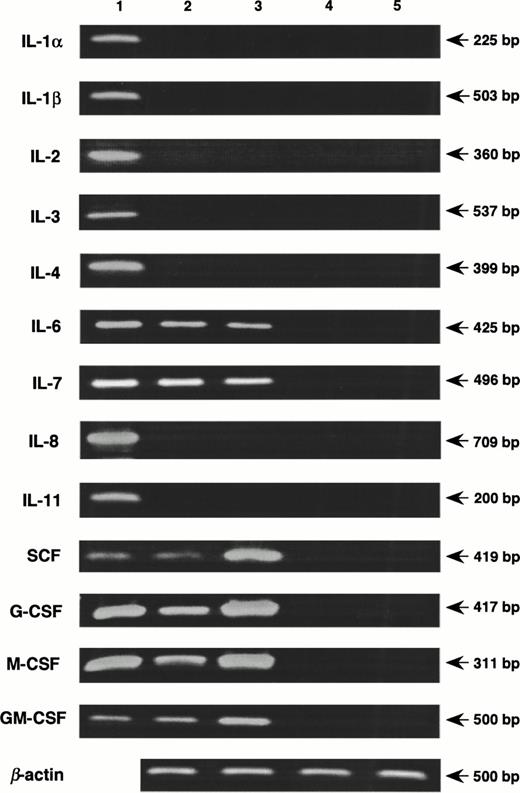
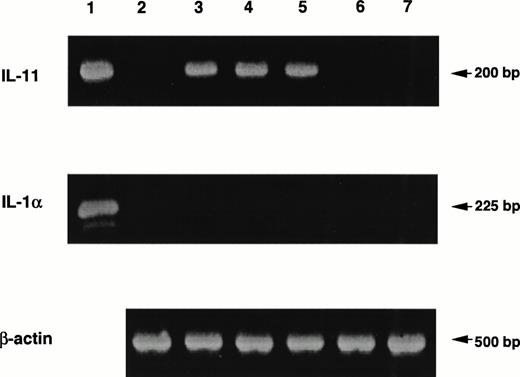
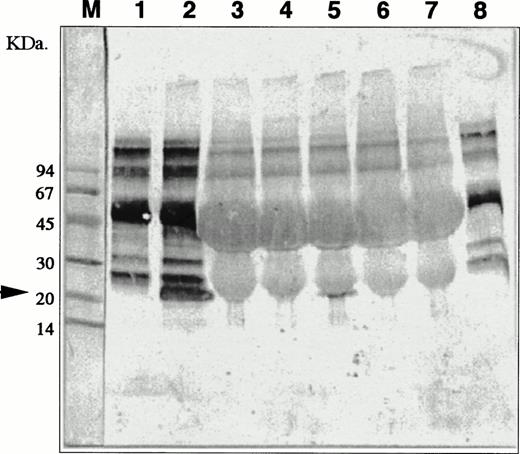
Coculture with nonadherent BM cells for 48 hours resulted in increased expression of genes for SCF, G-CSF, M-CSF, and GM-CSF by MS-10 cells, assessed by quantitative PCR16(Fig 5). Basal expression of IL-6 and IL-7 was unchanged. Expression of genes for IL-1α, IL-1β, IL-2, IL-3, IL-4, and IL-8 by MS-10 cells cultured alone or cocultured with BM cells was not detected. A transient expression of the IL-11 gene was observed between 6 and 24 hours of coculture, but was undetectable after 48 hours (Fig 6). Immunoreactive IL-11 was found in the coculture supernatant at 24 hours (Fig7). No such transient expression of IL-1 was observed.
Induction of cytokines in MS-10 cells by the coculture with nonadherent BM cells. Nonadherent BM cells were cocultured with MS-10, and the expression of cytokines was analyzed by quantitative RT-PCR, MS-10 alone (lane 2); MS-10 cocultured with nonadherent BM cells for 48 hours (lane 3); nonadherent BM cells (lane 4); nonadherent BM cells cocultured with MS-10 for 48 hours (lane 5). Lane 1 is a positive control.
Induction of cytokines in MS-10 cells by the coculture with nonadherent BM cells. Nonadherent BM cells were cocultured with MS-10, and the expression of cytokines was analyzed by quantitative RT-PCR, MS-10 alone (lane 2); MS-10 cocultured with nonadherent BM cells for 48 hours (lane 3); nonadherent BM cells (lane 4); nonadherent BM cells cocultured with MS-10 for 48 hours (lane 5). Lane 1 is a positive control.
Induction of IL-11 production in MS-10 cells by the coculture with nonadherent BM cells. MS-10 cells were cocultured with nonadherent BM cells for 6, 12, 24, and 48 hours. Expression of the genes for IL-1α and IL-11 in MS-10 cells was analyzed by quantitative RT-PCR, MS-10 alone (lane 2); MS-10 cocultured with nonadherent BM cells for 6 hours (lane 3); 12 hours (lane 4); 24 hours (lane 5); or 48 hours (lane 6); nonadherent BM cells (lane 7). Lane 1 is a positive control.
Induction of IL-11 production in MS-10 cells by the coculture with nonadherent BM cells. MS-10 cells were cocultured with nonadherent BM cells for 6, 12, 24, and 48 hours. Expression of the genes for IL-1α and IL-11 in MS-10 cells was analyzed by quantitative RT-PCR, MS-10 alone (lane 2); MS-10 cocultured with nonadherent BM cells for 6 hours (lane 3); 12 hours (lane 4); 24 hours (lane 5); or 48 hours (lane 6); nonadherent BM cells (lane 7). Lane 1 is a positive control.
Detection of IL-11 molecules in conditioned media of the coculture of nonaderent BM cells and MS-10. MS-10 cells were cocultured with nonadherent BM cells for 6, 12, 24, 48, and 72 hours. IL-11 molecules were analyzed by immunochemistry. Negative controls (lane 1, conditioned medium of MS-10 alone and lane 8, 10% FCS in α-medium). Positive control (lane 2, conditioned medium of HB-1 cultured on MS-10). Conditioned medium of MS-10 cocultured with nonadherent BM cells for 6 hours (lane 3); 12 hours (lane 4); 24 hours (lane 5); 48 hours (lane 6); and 72 hours (lane 7). M lane 1 is molecular-weight marker.
Detection of IL-11 molecules in conditioned media of the coculture of nonaderent BM cells and MS-10. MS-10 cells were cocultured with nonadherent BM cells for 6, 12, 24, 48, and 72 hours. IL-11 molecules were analyzed by immunochemistry. Negative controls (lane 1, conditioned medium of MS-10 alone and lane 8, 10% FCS in α-medium). Positive control (lane 2, conditioned medium of HB-1 cultured on MS-10). Conditioned medium of MS-10 cocultured with nonadherent BM cells for 6 hours (lane 3); 12 hours (lane 4); 24 hours (lane 5); 48 hours (lane 6); and 72 hours (lane 7). M lane 1 is molecular-weight marker.
Expression of IL-1 and IL-11 receptor genes by HB-1 cells.
The proliferative effects of IL-1α and IL-11 on HB-1 cells imply that the factors' respective receptors are expressed constitutively or induced by contact with MS-10. Accordingly, IL-1RI gene was not expressed in HB-1 cells cultured alone, but was expressed when HB-1 cells were cultured on MS-10 (Figs 2B and 3B). Basal expression of IL-11R on HB-1 cells was increased by coculture on MS-10, and addition of IL-1α to the suspension culture of HB-1 cells induced expression of IL-1RI and increased IL-11R expression.
DISCUSSION
Intercellular interactions between hematopoietic cells and BM stromal cells play a crucial role in hematopoiesis.1,2 The existence of two-way interactions between DA-1 cells and hematopoietic supportive stromal cells was demonstrated by Takashita et al.6 For example, we previously showed that contact between DA-1 factor-dependent leukemia cells and the supportive stromal cell line, MS-5, induced the expression of GM-CSF by the stromal cells and of bcl-2 by the leukemia cells.6 In preliminary studies to characterize HB-1 cells, direct contact between HB-1 and MS-10 was found to be necessary for the survival and proliferation of HB-1 cells. Separation of HB-1 from MS-10 cells resulted in apotosis of HB-1 cells, although no difference was found in Fas ligand (FasL), tumor necrosis factor (TNF) receptor p55, TNF receptor p75, interleukin-1β converting enzyme (ICE) or bcl-2 between HB-1 cells cultured alone and cultured on MS-10 (data not shown).
The aim of the present study was to elucidate factors that determine the dependency of HB-1 cells on MS-10. We found that rhIL-1α was able to substitute partially for stroma contact in supporting the survival and proliferation of HB-1. Suspension culture of HB-1 cells in the presence of IL-1α resulted in the survival and slow growth of the cells. Addition of IL-11 to HB-1 cells in suspension culture resulted in a significant enhancement of the growth of HB-1 cells. Expression of IL-1RI and IL-11R was induced on HB-1 cells and expression of IL-1α and IL-11 was induced in MS-10 by coculture of MS-10 and HB-1 in direct contact. Expression of IL-1RI and IL-11R was also induced in HB-1 cells by IL-1α. These findings indicate strongly that two-way interactions exist between HB-1 and MS-10, as previously shown for DA-1 and MS-5.6
Contact between HB-1 and MS-10 was necessary for the induction of IL-1α and IL-11 in MS-10 cocultured with HB-1 cells. Expression of IL-1α was detected in MS-10, but not in HB-1 cells. The medium from coculture of MS-10 cells and HB-1 cells did not support the survival of HB-1 cells. When HB-1 cells were cultured on MS-K or in transwells above MS-10, neither of the stromal cells released IL-1α or IL-11 into the culture medium (data not shown). Thus, our data suggest that coculture of HB-1 and MS-10 induces expression of membrane-bound IL-1 on MS-10 cells.
Induction of IL-1α production by MS-10 cells may represent a first step in the mutual education of hematopoietic cells and stromal cells. Although IL-1RI was not dectectable on HB-1 cells cultured alone, it is plausible that HB-1 expresses low levels of IL-1RI, which is undetectable by the present PCR technique and that IL-1 stimulated an enhanced expression of IL-1 receptors on HB-1 (analogous to the effect of IL-2 on the expression of its receptors on lymphocytes20). We observed that coculture of MS-10 with BM cells also resulted in the transient production of IL-11 (at both mRNA and protein levels), which is consistent with reports that human IL-11 supports the growth of hematopoietic cells in long-term BM culture and acts synergistically with other growth factors to stimulate multiple lineages of hematopoietic cells in vitro.21-25 Yanai et al26 reported that the survival, self-renewal, and differentiation of hematopoietic stem cells was controllable separately. In a similar stepwise control mechanism, IL-1α may support the survival and slow growth of HB-1 cells, which is then accelerated by additional signals from IL-11.
In previous studies, the nonsupportive MS-K cell line was characterized by comparison to the hematopoietic supportive line MS-5 (analogous to MS-10).4 The major differences between these two cell lines are cell-to-cell contact through which extracellular matrix-bound SCF appears to be transferred from MS-5 to hematopoietic cells.5 Although MS-K did adhere a small number of HB-1 cells, MS-K did not support the proliferation of HB-1, suggesting a difference in the expression of integrin(s) and/or cytokine(s) between MS-10 and MS-K. We have tested antibodies to some of the known adhesion molecules such as very late activation antigen (VLA)-4, vascular cell adhesion molecule (VCAM)-1, lymphocyte function-associated antigen (LFA)-1, intercellular adhesion molecule (ICAM)-1, CD44, Mac-1, and VLA-5 to elucidate if any of the antibodies block hematopoietic cell adherence, but have found none so far. We are now trying to obtain monoclonal antibodies against MS-10, hoping to find the candidate molecule(s). Using the model of MS-10 and MS-K, specific novel integrin(s) the adherence of hematopoietic cells to stromal cells is expected to be found.
ACKNOWLEDGMENT
We are grateful to Dr T. Masuda (Department of Medicine, Kyoto University) and Dr T. Hirano (Department of Medicine, Osaka University) for providing us with rhIL-1α and rmIL-6.
Supported in part by grants from Kirin Brewery Co, LTD, and from Sankyo Co, LTD, Tokyo, Japan.
Address reprint requests to Kazuhiro John Mori, MD, Department of Molecular and Cellular Biology, Faculty of Science, Niigata University, Niigata 950-21, Japan.
The publication costs of this article were defrayed in part by page charge payment. This article must therefore be hereby marked "advertisement" is accordance with 18 U.S.C. section 1734 solely to indicate this fact.

This feature is available to Subscribers Only
Sign In or Create an Account Close Modal