Abstract
We related cellular content of DNA topoisomerase (topo) IIα and IIβ with the cell cycle position in proliferating, differentiated, and apoptotic HL-60 cells using two-dimensional flow cytometry. In logarithmically growing HL-60 cells, topo IIα increased especially in late S to G2/M phases, although the topo IIβ level was almost constant throughout the cell cycle. Induction of differentiation by all-trans retinoic acid dramatically reduced the topo IIα but not the topo IIβ level. A new G2/M population containing virtually no topo IIα appeared during differentiation and was supposed to be alive and noncycling. Two-dimensional flow cytometry of topo IIα or IIβ staining and terminal deoxynucleotidyl transferase-mediated dUTP-biotin nick end-labeling assay showed that one topo IIβ epitope situated at the C-terminal end decreased specifically in apoptotic HL-60 cells treated with Ara-C, etoposide, and vincristine. The amounts of a topo IIα epitope and another topo IIβ epitope located at a more central portion were almost equal between apoptotic and nonapoptotic cells. Western blot analysis confirmed that topo IIβ protein was completely degraded into smaller fragments and lost its C-terminal end during apoptosis. On the contrary, a large portion of topo IIα remained of its original size, although both topo IIα and IIβ left from the nuclear fraction in apoptotic cells. Confocal laser microscopy showed nuclear localization of topo IIα and IIβ in growing HL-60 cells. Although topo IIα and IIβ were distributed throughout the cell during mitosis, only topo IIα was densely concentrated in the mitotic chromosomes. Both enzymes were dissociated from the genomic DNA even at an early phase of apoptosis and completely separated from the propidium iodide signal of DNA in the advanced stage. Chromatin condensation process in apoptosis is therefore completely topo II-independent and obviously differs from the mitotic one.
DNA TOPOISOMERASE II (topo II) catalyzes the local changes in DNA topology by passing a double-stranded DNA helix through a transient double-strand break site and then rejoining the strand break.1,2 Conditional yeast mutants in thetop2 gene showed that this enzymatic activity is required for segregation of daughter chromosomes during anaphase.3Biochemical studies using Xenopus egg extracts showed that topo II is essential for the condensation of interphase chromatin into metaphase chromosomes.4 Treatment of mammalian cells with ICRF-193, which inhibits topo II activity without causing DNA damage, also leads to incomplete chromosomal condensation and segregation, resulting in polyploidity.5 Topo II is the direct target of certain classes of antitumor agents. Etoposide and doxorubicin interact with topo II to inhibit the religation step of the enzyme, thereby stabilizing cleavable enzyme-DNA complexes that lead to DNA double-strand breaks and eventually to cell death.6 Gene rearrangement in the MLL gene at chromosome 11q23 is frequently observed in chemotherapy-associated leukemias.7,8 The break cluster region in this gene has been shown to coincide with the DNA cleavage sites specifically induced by topo II inhibitors in vivo.9,10 Although only one topo II is known in yeasts andDrosophila, two isozymes of topo II have been identified in mammalian cells.1,11,12 These two isozymes, topo IIα (170-kD form) and topo IIβ (180-kD form), with striking similarities in their amino acid sequences, are encoded by different genes. The topo IIα staining showed fine punctuate fluorescence all over the nucleus except the nucleolar domain.13,14 Although topo IIβ was considered to exist preferentially in the nucleoli,14,15 a recent report has shown that topo IIβ is completely excluded from nucleoli.16 The cellular concentration of topo IIα but not topo IIβ was reported to correlate with mitotic activity.17-19 A decrease in cellular content of topo IIα was previously reported during differentiation and E1A-induced apoptosis.20-22
Apoptosis is a distinct form of cell death that occurs in response to various stimuli, including DNA damage, withdrawal of growth factors, and inappropriate expression of genes that stimulate cell cycle progression.23,24 Apoptosis begins with condensation of nuclear chromatin at the nuclear periphery followed by blebbing of the nuclear and cytoplasmic membranes and culminates in the fragmentation of residual nuclear structures into discrete apoptotic bodies.23-25 Although the regulation of apoptosis is complex, substantial evidence indicates that interleukin-1β–converting enzyme (ICE)-like proteases play a central role in this process.26,27 Several nuclear proteins essential for DNA metabolism are specifically degraded by the action of the ICE-like proteases during apoptosis. These include poly (ADP-ribose) polymerase (PARP), nuclear lamins, DNA-dependent protein kinase catalytic subunit (DNA-PK cs), DNA topo I and II, NuMA, and RNA polymerase I upstream binding factor UBF.28-32
In this study, we showed a dramatic increase of topo IIα but not topo IIβ content in late S to G2/M phases in logarithmically growing HL-60 cells using two-dimensional flow cytometry. During differentiation, the majority of the HL-60 cells were confined to G1/G0 position and simultaneously a new cell population emerged that contained tetraploid DNA and almost no topo IIα protein. Two-dimensional flow cytometry combining topo IIα or IIβ staining with terminal deoxynucleotidyl transferase (TdT)-mediated dUTP-biotin nick end-labeling (TUNEL) assay suggested a decrease of a C-terminal but not a more central epitope of topo IIβ in apoptotic HL-60 cells. Western blot analysis and immunostaining showed that both topo IIα and IIβ were rapidly dissociated from the chromatin in apoptotic HL-60 cells, although only topo IIβ was extensively degraded during apoptosis.
MATERIALS AND METHODS
Monoclonal antibodies.
Preparations of topo IIα-specific antibody 8D2 and topo IIβ-specific antibodies 5A7 and 3G3 were described previously.22 33 The epitope of 8D2 exists between amino acids 1260 and 1460 of topo IIα. The epitopes of 5A7 and 3G3 are located in amino acids 1583 to 1601 and between amino acids 1260 and 1460 of topo IIβ, respectively.
Cell culture and drug treatment.
The HL-60 human myeloid leukemia cell line was maintained in RPMI 1640 (GIBCO BRL, Grand Island, NY) supplemented with 10% fetal calf serum, 100 U/mL penicillin, 100 μg/mL streptomycin, and 2 mmol/Ll-glutamine. The cells were split to keep the cell density at 2 × 10⁵ to 1 × 10⁶ cells/mL.
To induce cell differentiation, HL-60 cells were treated with 1 μmol/L of all-trans retinoic acid (ATRA; Sigma, St Louis, MO) for 6 days. Cell density was kept at 2 × 10⁵ to 1 × 10⁶ cells/mL during the treatment. Logarithmically growing HL-60 cells were treated for the indicated times with cytosine b-d-arabinofuranose (Ara-C; 4 μmol/L), etoposide (100 μmol/L), or vincristine (0.2 μmol/L) (all reagents were purchased from Sigma).
Cell fixation.
In brief, 1 × 10⁶ cells were harvested by centrifugation for 8 minutes at room temperature at 400g, washed once with phosphate-buffered saline (PBS), and then fixed in 1% formaldehyde in PBS (pH 7.4) for 15 minutes on ice. After washing in PBS, cells were resuspended in 70% cold (−20°C) ethanol and immediately transferred to the freezer. The cells were stored at −20°C for 1 day before being subject to the indirect immunofluorescence or TUNEL assay.
Indirect immunofluorescence.
Cells were washed twice in PBS, incubated in 100 μL of PBS containing 0.1% Triton X-100 for 5 minutes at room temperature, and blocked in 100 μL of PBS containing 3% (wt/vol) nonfat dry milk for 30 minutes at room temperature. To detect topo IIα and IIβ, cells were incubated with a 1:30 dilution of 8D2 and 5A7, respectively, in PBS with 3% nonfat milk for 1.5 hours at room temperature. In some cases, 3G3 was used to detect topo IIβ instead of 5A7. Cells were washed twice in PBS containing 0.1% Triton X-100 and then incubated in a 1:30 dilution of a fluorescein isothiocyanate (FITC)-conjugated goat-antimouse IgG (Ortho, Raritan, NJ) in PBS/3% milk solution for 1 hour at room temperature in the dark.
TUNEL assay.
After rehydration in PBS, cells were resuspended in 50 μL of a cacodylate buffer containing 0.2 mol/L potassium cacodylate, 25 mmol/L Tris-HCl (pH 6.6), 2.5 mmol/L CoCl2, 0.25 mg/mL bovine serum albumin, 5 U TdT, and 0.5 nmol of biotin-dUTP (all reagents were purchased from Boehringer Mannheim, Indianapolis, IN). The cells were incubated in this solution at 37°C for 30 minutes; rinsed in PBS; resuspended in 100 μL of a solution containing 4× concentrated saline-sodium citrate buffer, 2.5 μg/mL fluoresceinated avidin (Boehringer Mannheim), 0.1% Triton X-100, and 5% (wt/vol) nonfat dry milk; and incubated in this solution for 30 minutes at room temperature in the dark. This procedure essentially followed the previous report by Gorczyca et al.34
Flow cytometry.
After incubation in staining buffer, the cells were rinsed in PBS containing 0.1% Triton X-100 and resuspended in 1 mL of PBS containing 5 μg/mL of propidium iodide (PI) and 200 μg/mL of RNase A (both from Sigma). Flow cytometry was performed on a CYTRON ABSOLUTE flow cytometer (Ortho). The orange (PI) and green (fluorescein isothiocyanate [FITC]) fluorescence emissions from each cell were separated and measured using the standard optics of the CYTRON ABSOLUTE. The data from 5 × 10⁴ cells were collected, stored, and analyzed. The signal of green fluorescence was measured using linear amplification for topo IIα and IIβ staining and using logarithmic amplification for the TUNEL assay.
Two-dimensional flow cytometry of immunostaining and TUNEL assay.
After performing the TUNEL assay protocol described above, cells were rinsed twice in PBS containing 0.1% Triton X-100 and then resuspended in PBS/3% milk solution containing the primary antibody, 8D2 or 5A7. Thereafter, cells were stained with the same procedure for indirect immunostaining except that 1:50 dilution of phycoerythrin (PE)-conjugated goat-antimouse IgG (BioSource, Camarillo, CA) was used as a secondary antibody and that PI staining at the final step was omitted. In this case, topo IIα and IIβ signals of orange fluorescence were measured using linear amplification and the green fluorescence of TUNEL assay using logarithmic amplification.
Western blot analysis.
Harvested cells were washed once with PBS and suspended in ice-cold buffer 1 (10 mmol/L HEPES, pH 7.9, 10 mmol/L KCl, 1 mmol/L EDTA, 1 mmol/L dithiothreitol [DTT], 0.05% Triton X-100, and 1 mmol/L phenylmethylsulfonyl fluoride [PMSF]) at the concentration of 2 × 10⁷ cells/mL. The suspension was kept on ice for 20 minutes, vortexed vigorously for 10 seconds to be lysed, and then spun down at 1,000g for 4 minutes at 4°C. The supernatant was recovered as a cytoplasmic fraction. The nuclear pellet was resuspended in the same volume of ice-cold nuclear extraction buffer 2 (20 mmol/L HEPES, pH 7.9, 400 mmol/L NaCl, 1 mmol/L EDTA, 1 mmol/L DTT, and 1 mmol/L PMSF), rocked on ice for 30 minutes, and centrifuged at 13,000g for 10 minutes at 4°C. The supernatant was recovered as a nuclear fraction. In every experiment in this study, the nuclear remnant was confirmed to contain essentially no topo II proteins by immunoblotting. Cytoplasmic and nuclear fractions derived from 5 × 10⁵ cells were separated on a 7% polyacrylamide gel. Immunoblotting was performed as described previously,35 using a 1:200 dilution of 8D2, 5A7, and 3G3. As a second antibody, alkaline phosphatase-conjugated antimouse Ig (ProMega, Madison, WI) was used at the dilution of 1:5,000.
Confocal laser microscopy.
The cells immunostained for flow cytometric analysis were rinsed in PBS containing 0.1% Triton X-100. An aliquot of the cells was resuspended in 200 μL of PBS containing 200 ng/mL of PI and 200 μg/mL of RNase A (both from Sigma), resuspended in 100 μL of PBS, and then attached to a poly-l-lysine coated slide glass. The coverslip was mounted with 10 μL of antifading mix (50% glycerol, 2.5% 1,4-diazabicyclo[2.2.2]octane [DABCO] in PBS) and sealed with nail polish. The slides were viewed and photographed through a Bio-Rad MRC-1024 confocal laser scanning microscope (Bio-Rad, Hercules, CA).
RESULTS
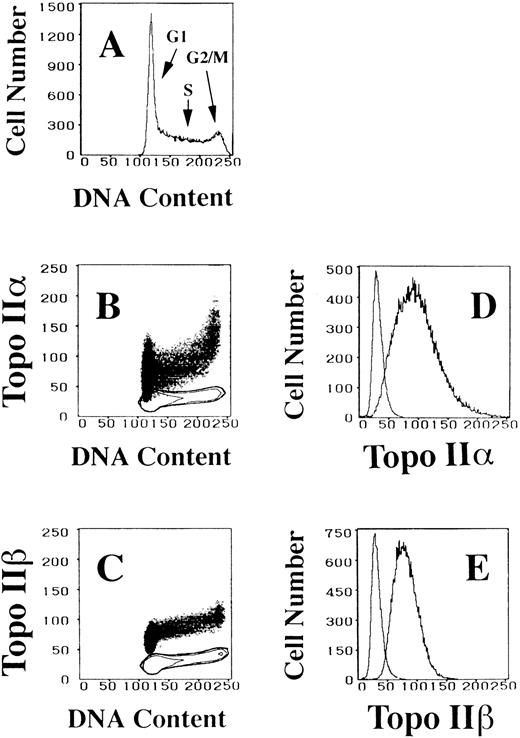
The cellular contents of topoisomerase IIα and IIβ were studied using monoclonal antibodies 8D2 and 5A7. Specificities of 8D2 to topo IIα and 5A7 to topo IIβ were shown previously.22 23Two-dimensional flow cytometric analysis of cells indirectly fluorescein-labeled for topo IIα or IIβ and then counterstained with PI made it possible to quantify the amounts of topo IIα or IIβ and relate them to cellular DNA content, ie, to the cell cycle position. The DNA content histogram of logarithmically growing HL-60 cells contains two peaks: a large and sharp peak at G1 and the other small one at G2/M (Fig 1A). S phase cells distribute between these peaks forming a bridge shape. The cellular concentration of topo IIα increases during the cell cycle progression and a steep increase is prominent from late S to G2/M phases (Fig 1B). In G1 phase, topo IIα content varies from almost zero to somewhat larger than that of early S phase. On the contrary, topo IIβ level slightly increases in G1 phase and thereafter is not significantly altered through the cell cycle (Fig 1C). Although the topo IIβ signal appears to increase even during the S phase, subtraction of the nonspecific binding fluorescence of an isotype-matched control antibody indicates that the topo IIβ content is almost constant. When we compare the single parameter histograms of the two topo II enzymes, the range of distribution for topo IIα signal was much wider than that of topo IIβ, although these histograms peak at almost the same signal intensity (Fig 1D and E). These results were representative of five similar experiments.
Alterations in topo IIα and IIβ levels in logarithmically growing HL-60 cells as a function of DNA content, ie, the cell cycle position. (A) DNA histogram showing the cell cycle distribution of logarithmically growing HL-60 cells. (B and C) Two-dimensional flow cytometric analyses of DNA content and topo IIα and IIβ signals, respectively. Isotype-matched negative controls are depicted as contour maps. (D and E) Histograms of topo IIα and IIβ contents, respectively. Isotype-matched control fluorescence curves are the most proximal to the Y-axis.
Alterations in topo IIα and IIβ levels in logarithmically growing HL-60 cells as a function of DNA content, ie, the cell cycle position. (A) DNA histogram showing the cell cycle distribution of logarithmically growing HL-60 cells. (B and C) Two-dimensional flow cytometric analyses of DNA content and topo IIα and IIβ signals, respectively. Isotype-matched negative controls are depicted as contour maps. (D and E) Histograms of topo IIα and IIβ contents, respectively. Isotype-matched control fluorescence curves are the most proximal to the Y-axis.
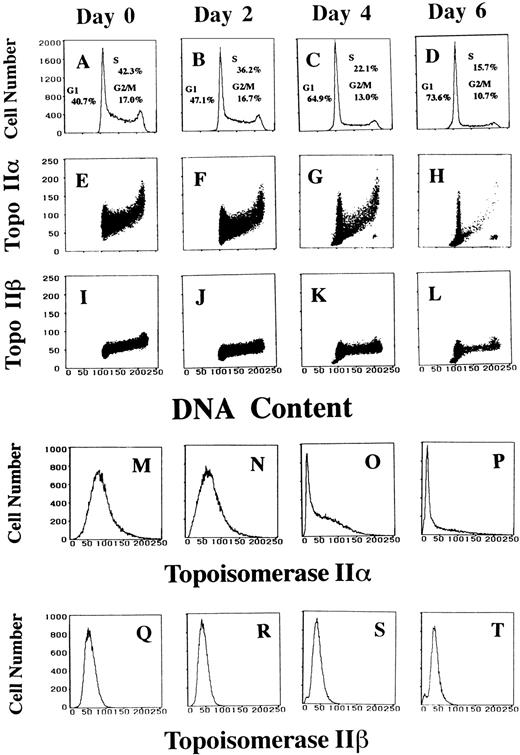
Two-dimensional flow cytometric analysis on differentiating HL-60 cells showed alterations in the cell cycle distribution and changes in topo IIα and IIβ levels at each cell cycle position. We induced differentiation of HL-60 cells with the addition of 1 μmol/L of ATRA to the culture medium for 6 days. More than 90% of the cells were confirmed to express CD11b on the cell surface by day 4 (data not shown). During differentiation, the cell population belonging to S and G2/M phases gradually decreased, and only a small portion of the cells were found in S phase at day 6 (Fig 2A through D). By day 2, the amount of topo IIα as a function of cell cycle position showed similar pattern to that of the nontreated cells, although the topo IIα signal decreased slightly (Fig 2E and F). At day 4, a large portion of the cells were confined to G1 and a considerable part of these G1 cells no longer expressed topo IIα enzyme (Fig 2C and G). A new cell population that belongs to G2/M phase and simultaneously contains almost no topo IIα appeared at this stage, and this cell group became more prominent at day 6 (Fig 2G and H). Because a portion of the G0/G1 cells had a relatively high level of topo IIα signal, as shown in Fig 2H, if the G2/M population were constituted of the clumped G0/G1 cells, some cells of this population should also contain a high level of topo IIα signal. Actually, even when we increased the detection gain or the numbers of cells analyzed, the G2/M population in Fig 2H showed no upward tail, which corresponds to a cell group containing a rather high level of topo IIα signal. Furthermore, we clearly detected this G2/M cell population by two-dimensional flow cytometry still after the gating to eliminate the clumped G0/G1 cells. In contrast with topo IIα, the signal of topo IIβ decreased a little at day 2 and essentially kept this level until day 6 (Fig 2I through L). At days 4 and 6, there appeared a sub-G1 population that contained almost no topo IIβ (Fig 2K, L, S, and T). The results of TUNEL assay suggested that these cells were apoptotic (data not shown), which agrees with the results described below showing that 5A7 epitope of topo IIβ specifically decreases during apoptosis. The single-parameter histograms confirmed that topo IIα level decreased steeply and the peak shifted to the position of almost no topo IIα signal at day 4 (Fig 2M through P). Topo IIβ level was not so much altered during differentiation (Fig 2Q through T). Similar results were observed in three independent studies.
Topo IIα level decreases dramatically and a new G2/M cell population expressing almost no topo IIα emerges during the ATRA-induced differentiation. Logarithmically growing HL-60 cells are treated with 1 μmol/L of ATRA, before the treatment (A, E, I, M, and Q), for 2 days (B, F, J, N, and R), for 4 days (C, G, K, O, and S), and for 6 days (D, H, L, P, and T). DNA histograms with insets showing the percentage of cells in each phase of the cell cycle (A through D). Two-dimensional flow cytometric analyses of DNA contents and topo IIα and IIβ signals (E through H and I through L, respectively). Histograms of topo IIα and IIβ contents (M through P and Q through T, respectively).
Topo IIα level decreases dramatically and a new G2/M cell population expressing almost no topo IIα emerges during the ATRA-induced differentiation. Logarithmically growing HL-60 cells are treated with 1 μmol/L of ATRA, before the treatment (A, E, I, M, and Q), for 2 days (B, F, J, N, and R), for 4 days (C, G, K, O, and S), and for 6 days (D, H, L, P, and T). DNA histograms with insets showing the percentage of cells in each phase of the cell cycle (A through D). Two-dimensional flow cytometric analyses of DNA contents and topo IIα and IIβ signals (E through H and I through L, respectively). Histograms of topo IIα and IIβ contents (M through P and Q through T, respectively).
We next examined topo IIα and IIβ levels and related them with the cell cycle position in apoptotic HL-60 cells treated with antitumor drugs. The extent of DNA strand breaks, one of the hallmarks of apoptosis, was also correlated to the cell cycle position using the TUNEL assay combined with PI staining. We used three antitumor drugs with different mechanisms of action: pyrimidine analogue antimetabolite Ara-C, topo II inhibitor etoposide, and vinca alkaloid antimitotic agent vincristine.36 Based on the results of previous reports,31 37 we experimentally determined the doses of Ara-C (4 μmol/L) and etoposide (100 μmol/L) that induce apoptosis in 50% to 80% of rapidly growing HL-60 cells in 6 to 8 hours (data not shown). Measured as an apoptotic cell percentage, 0.05 μmol/L of vincristine had essentially the same effect as that of 4 μmol/L (data not shown). We therefore treated HL-60 cells with 0.2 μmol/L of vincristine. At this concentration, it took about 18 hours to induce apoptosis in more than 50% of the treated cells.
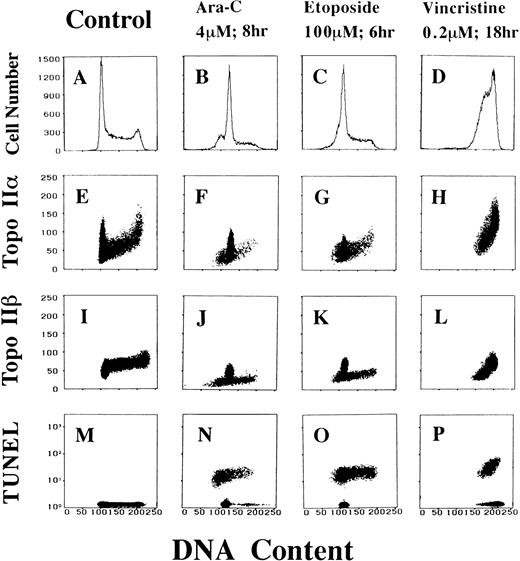
With the Ara-C treatment, the G2/M peak disappeared and a small peak at sub-G1 position emerged (Fig 3B). As a function of the cell cycle position, the topo IIα level decreased a little in these cells (Fig3F). On the contrary, Ara-C–treated cells were divided into two populations with nearly normal and very small topo IIβ contents (Fig 3J). TUNEL-positive cells were distributed in sub-G1 to S phases, suggesting a partial loss of DNA stainability in apoptotic cells (Fig 3N). Most of the nonapoptotic cells were restricted in G1 phase. Comparison between Fig 3J and N suggests a possibility that the topo IIβ signal should decrease specifically in apoptotic cells.
Antitumor drugs alter the cell cycle distribution and topo IIα and IIβ contents of HL-60 cells. DNA histograms (A through D), two-dimensional flow cytometric analyses of DNA-topo IIα contents (E through H), DNA-topo IIβ contents (I through L), and DNA content-TUNEL assay (M through P) of control and Ara-C–, etoposide-, and vincristine-treated HL-60 cells.
Antitumor drugs alter the cell cycle distribution and topo IIα and IIβ contents of HL-60 cells. DNA histograms (A through D), two-dimensional flow cytometric analyses of DNA-topo IIα contents (E through H), DNA-topo IIβ contents (I through L), and DNA content-TUNEL assay (M through P) of control and Ara-C–, etoposide-, and vincristine-treated HL-60 cells.
Etoposide-treated cells also lost the G2/M population and the G1 peak had a broader shoulder at sub-G1 side (Fig 3C). The topo IIα level was somewhat decreased at any position in the cell cycle (Fig 3G). Only part of the G1 cells contained a normal amount of topo IIβ and all of the remaining cells had a decreased topo IIβ signal (Fig 3K). TUNEL assay showed that only a portion of G1 cells were free from apoptosis (Fig 3O). Therefore, a decrease of the topo IIβ signal also seemed to correlate with apoptosis in etoposide-treated HL-60 cells.
Treatment with vincristine confined HL-60 cells to late S and G2/M phases (Fig 3D). As a result, most of the cells expressed a higher level of topo IIα than normal control (Fig 3H). As for topo IIβ, these cells were divided into two populations with intact and decreased enzyme levels (Fig 3L). Both apoptotic and nonapoptotic cells were in late S to G2/M phases (Fig 3P).
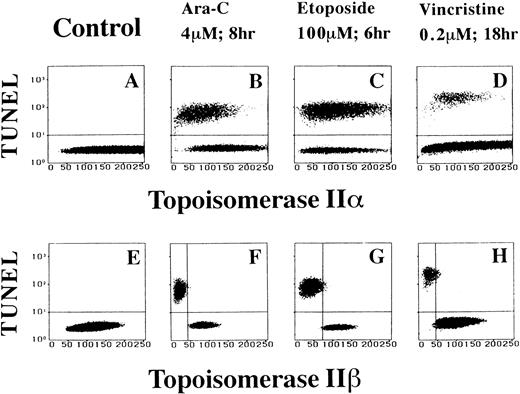
To address the possible relationship between topo IIβ level and apoptosis more directly, cells were labeled by the TUNEL assay, stained for topo IIα or topo IIβ, and then analyzed by two-dimensional flow cytometry. In Ara-C–treated HL-60 cells, a large portion of the apoptotic cells contained approximately the same amount of topo IIα as the nonapoptotic ones (Fig 4B). On the contrary, the apoptotic cells apparently contained less topo IIβ, with apoptotic and nonapoptotic populations essentially nonoverlapping as for the topo IIβ level (Fig 4F). When we used etoposide, the apoptotic and nonapoptotic HL-60 cells expressed almost equal amounts of topo IIα (Fig 4C). However, the topo IIβ level clearly separated these two populations (Fig 4G). Also, in vincristine-treated cells, although the apoptotic and nonapoptotic cells contained a similar level of topo IIα, they differed sharply in their content of topo IIβ (Fig 4D and H). Every result shown in Fig 3 and 4 was reproducively obtained in at least three separate experiments. Because the three antitumor drugs used in this study have apparently different mechanisms of action, these observations indicate that a decrease in the topo IIβ level is not a drug-specific event but a more general phenomenon accompanying the drug-induced apoptosis.
Topo IIβ but not topo IIα signal decreases specifically in apoptotic HL-60 cells treated with antitumor drugs. Two-dimensional flow cytometric analyses of topo IIα and IIβ contents and TUNEL assay (A through D and E through H, respectively).
Topo IIβ but not topo IIα signal decreases specifically in apoptotic HL-60 cells treated with antitumor drugs. Two-dimensional flow cytometric analyses of topo IIα and IIβ contents and TUNEL assay (A through D and E through H, respectively).
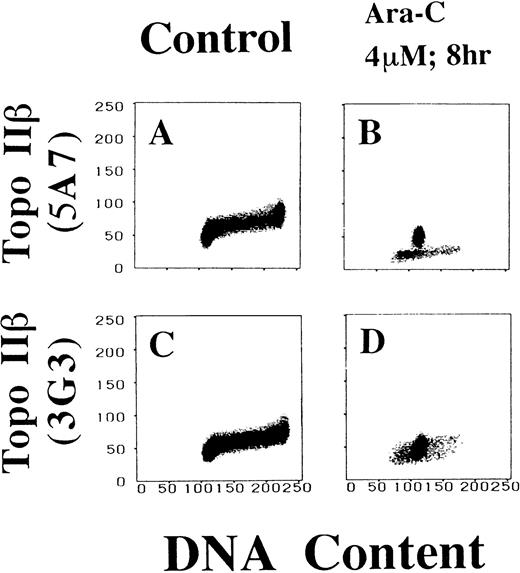
Because we used the monoclonal antibody 5A7 specific to the C-terminal portion of topo IIβ (amino acids 1583 to 1601) in the experiments described above, we could not distinguish the two possibilities that the full molecule or only the N-terminal portion of topo IIβ was lost during apoptosis. To investigate this question, we determined the topo IIβ level of the Ara-C–treated HL-60 cells using a monoclonal antibody 3G3, which recognizes a more central epitope of topo IIβ (between amino acids 1260 and 1460) than that of 5A7. Flow cytometry using 5A7 as a primary antibody clearly separated Ara-C–treated HL-60 cells into two populations with almost normal and decreased levels of topo IIβ signal as shown above (Fig 5B).On the contrary, 3G3 did not discriminate between the apoptotic and nonapoptotic cells, both of which showed an almost normal level of topo IIβ signal (Fig 5D). Similar results were obtained in three independent experiments. Etoposide-treated HL-60 cells also divided into apoptotic and nonapoptotic populations by 5A7 but not by 3G3 (data not shown). These results indicate that the 5A7 epitope at the C-terminal portion of topo IIβ should be degraded or modified during apoptosis, although a more central 3G3 epitope of topo IIβ was preserved.
5A7 but not 3G3 separates apoptotic HL-60 cells from nonapoptotic ones. Two-dimensional flow cytometric analyses of DNA-topo IIβ contents are performed on logarithmically growing (A and C) and Ara-C–treated HL-60 cells (B and D) using topo IIβ-specific monoclonal antibodies, 5A7 (A and B) and 3G3 (C and D).
5A7 but not 3G3 separates apoptotic HL-60 cells from nonapoptotic ones. Two-dimensional flow cytometric analyses of DNA-topo IIβ contents are performed on logarithmically growing (A and C) and Ara-C–treated HL-60 cells (B and D) using topo IIβ-specific monoclonal antibodies, 5A7 (A and B) and 3G3 (C and D).
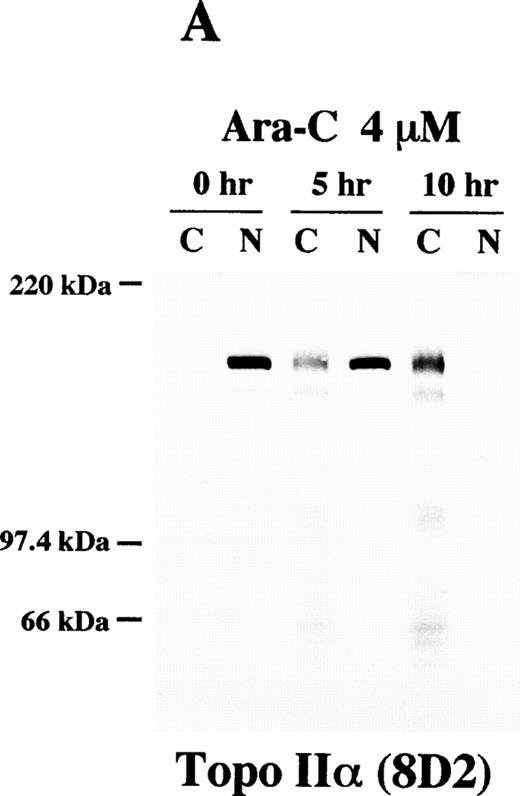
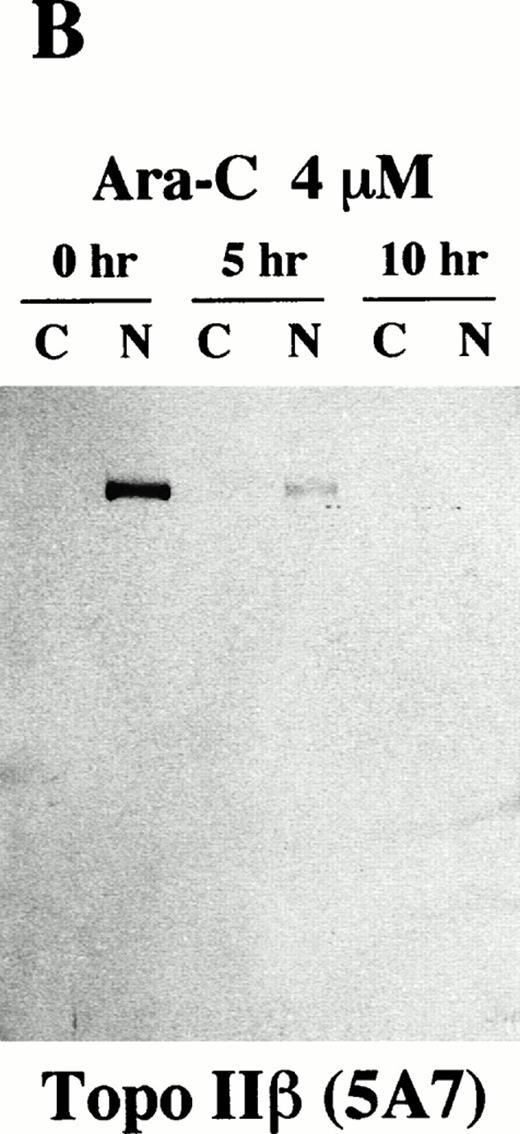
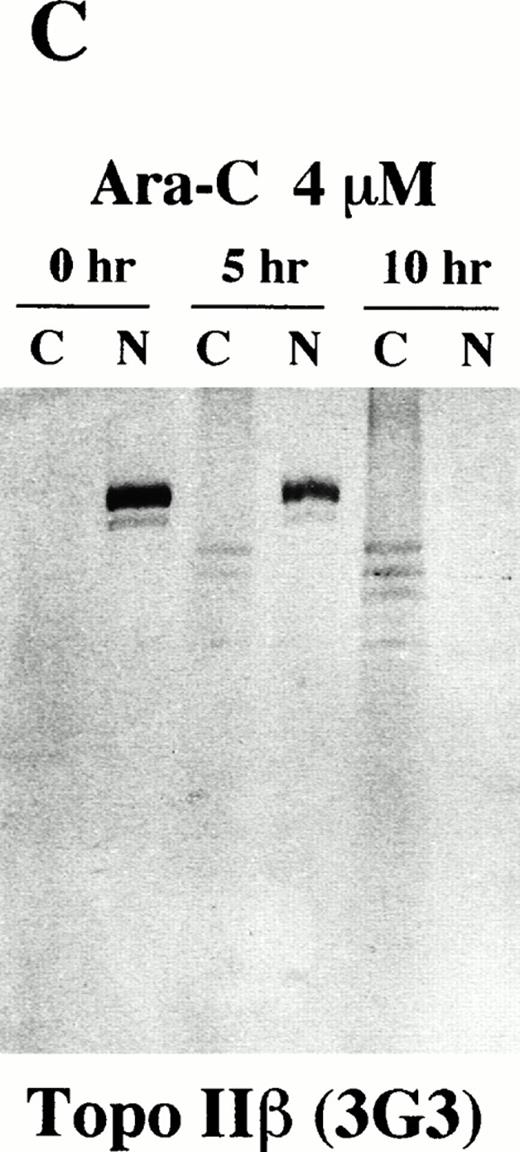
We then investigated possible cleavages of topo IIα and IIβ during apoptosis by Western blot analysis using 8D2 and 5A7/3G3, respectively. The flow cytometric TUNEL analysis showed that approximately 50% of HL-60 cells underwent apoptosis after 5 hours of incubation with 4 μmol/L of Ara-C (data not shown). In 10 hours, more than 95% of the treated cells were positive for the TUNEL assay (data not shown). We separated rapidly growing and Ara-C–treated HL-60 cells into cytoplasmic and nuclear fractions with 0.05% Triton X-100. Each fraction was then subjected to immunoblotting. In logarithmically growing HL-60 cells, both topo IIα and IIβ were detected at their expected size (170 kD and 180 kD, respectively) exclusively in the nuclear fraction (0 hours; Fig 6A, B, and C). Although distribution of topo IIα was completely changed from the nuclear to cytoplasmic fractions during the course of apoptosis, a large portion of topo IIα remained of its original size even in apoptotic cells (Fig 6A). Only a small amount of degraded topo IIα fragments were detected in the cytoplasmic fraction of the apoptotic cells. When we used 5A7 to detect topo IIβ, the 180-kD band in the nuclear fraction became faint in 5 hours and no bands were detected in either the cytoplasmic or nuclear fraction after 10 hours of incubation (Fig 6B). Another topo IIβ-specific antibody 3G3 showed the appearance of several smaller fragments of 125 to 160 kD in the cytoplasmic fraction besides a proportional reduction in the amount of the 180-kD band in the nuclear fraction after 5 hours of Ara-C treatment (0 and 5 hours; Fig 6C). The smaller fragments in the cytoplasmic fraction became more prominent and the intact 180-kD band disappeared in 10 hours (10 hours; Fig 6C), indicating that topo IIβ was completely degraded into these smaller fragments. Essentially the same results were obtained in three independent experiments and also in etoposide-treated cells with a slightly shorter time course (about 7 to 8 hours for complete apoptosis; data not shown). These results confirmed that the C-terminal 5A7 epitope is lost and a more central 3G3 epitope is preserved in the apoptotically degraded topo IIβ fragments. The Western blot analysis thus shows that a large portion of topo IIα remains of its original size even in apoptotic HL-60 cells, although intact topo IIβ is lost at an early phase of apoptosis.
Topo IIβ but not topo IIα is extensively degraded during the Ara-C–induced apoptosis. Western blot analyses of logarithmically growing HL-60 cells (0 hours) and those treated with 4 μmol/L of Ara-C for 5 and 10 hours (5 and 10 hr, respectively) with topo IIα-specific 8D2 (A) and topo IIβ-specific 5A7 and 3G3 monoclonal antibodies (B and C, respectively).
Topo IIβ but not topo IIα is extensively degraded during the Ara-C–induced apoptosis. Western blot analyses of logarithmically growing HL-60 cells (0 hours) and those treated with 4 μmol/L of Ara-C for 5 and 10 hours (5 and 10 hr, respectively) with topo IIα-specific 8D2 (A) and topo IIβ-specific 5A7 and 3G3 monoclonal antibodies (B and C, respectively).
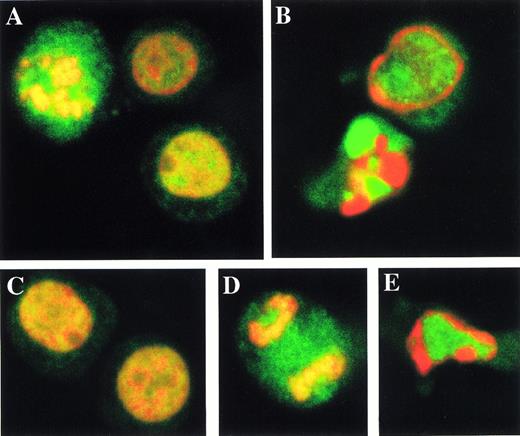
Topo IIα and IIβ (fragments) moved completely from the nuclear to cytoplasmic fractions in apoptotic cells. Because the fractionation procedure was biochemical, the change in the distribution of topo II enzymes may have merely reflected a collapse of nuclear integrity. To investigate a probable change in the cellular localization of topo IIα and IIβ during apoptosis more directly, we immunostained intact and Ara-C–treated apoptotic HL-60 cells using 8D2 and 3G3 and then examined them with confocal laser microscopy (Fig7). Topo IIα-specific 8D2 and topo IIβ-specific 3G3 signals are visualized as green color and PI counterstained DNA red. In logarithmically growing cells, topo IIα and IIβ were localized in the nucleus showing a fine granular pattern except for the nucleoli (Fig 7A and C, respectively). Both topo II enzymes were distributed throughout the cell during mitosis (Fig 7A and D). Only topo IIα signal was concentrated in the mitotic chromosomes with merged intense yellow color. This observation was confirmed by the comparison of topo IIα signals in the chromosomes and in the mitotic cytoplasm (data not shown). When we stained HL-60 cells treated with Ara-C for 5 hours, some nuclei showed chromatin condensation at the nuclear periphery and others showed a typical apoptotic pattern with discrete apoptotic bodies. Topo IIα signal was dissociated from the chromatin at an early phase of apoptosis and completely separated from the bright red signal of DNA in an advanced stage (Fig 7B, upper and lower cells, respectively). Topo IIβ was also segregated from the chromatin even at an early stage of apoptosis (Fig 7E). These results were representative of three independent experiments conducted under similar conditions.
Topo IIα and IIβ are dissociated from the chromatin during apoptosis. Logarithmically growing (A, C, and D) and apoptotic HL-60 cells treated with Ara-C for 5 hours (B and E) are immunostained with topo IIα-specific 8D2 (A and B) and topo IIβ-specific 3G3 monoclonal antibodies (C through E). Topo IIα and IIβ signals are green arising from the FITC-conjugated secondary antibody, and PI counterstaining for DNA is red.
Topo IIα and IIβ are dissociated from the chromatin during apoptosis. Logarithmically growing (A, C, and D) and apoptotic HL-60 cells treated with Ara-C for 5 hours (B and E) are immunostained with topo IIα-specific 8D2 (A and B) and topo IIβ-specific 3G3 monoclonal antibodies (C through E). Topo IIα and IIβ signals are green arising from the FITC-conjugated secondary antibody, and PI counterstaining for DNA is red.
DISCUSSION
In this study, we showed temporal and spatial changes in topo IIα and IIβ distributions in proliferating, differentiated, and apoptotic HL-60 cells using two-dimensional flow cytometry, Western blot analysis, and confocal laser microscopy. At first, we related topo IIα and IIβ levels with the cell cycle position in logarithmically growing HL-60 cells. Although a previous study determined the contents of topo IIα and IIβ in synchronized cells at 2-hour intervals for a total of 28 hours, the cells were not so well restricted to narrow positions in the cell cycle, especially several hours after the release from serum starvation.18 Treatment such as serum starvation might also influence the cell viability or topo II levels. Another study, in which cell size was regarded to reflect the cell cycle position, fractionated an asynchronous cell population by centrifugal elutriation and then measured the topo IIα level of each fraction.19 We believe that the two-dimensional flow cytometry determines topo IIα and IIβ levels more precisely as functions of the cell cycle position. Our results clearly showed the steep increase of topo IIα level in late S to G2/M phases, which correlates well with the known topo II function in chromosome condensation and segregation.1-4 Some of the G1 cells expressed a larger amount of topo IIα than the early S cells. This observation supports the previous hypothesis that topo IIα should be degraded from anaphase to early G1 phase until the topo IIα level becomes quite low.19,22 Although both topo IIα and IIβ antigens were recently reported to be twofold to threefold higher in mitosis than in interphase, careful examination of the report's data showed that topo IIβ band intensity increases only from G1 to S phases and thereafter is not significantly altered.16 This agrees well with our observation that the topo IIβ content is almost constant after G1 phase. We suppose that the topo IIβ content decreases to 50% after cell division and returns to the previous level during G1 phase.
Two-dimensional flow cytometry showed the appearance of a new cell population containing tetraploid DNA and essentially no topo IIα during differentiation. Because microscopic examination confirmed that less than 0.3% of the cells were in mitosis at day 6 of the ATRA treatment (data not shown), the new population should be in G2 phase. This cell group was not detected in logarithmically growing cells. These G2 cells are presumed to be noncycling and alive for the following reasons. First, they do not seem to proceed along the cell cycle further, because a sizable amount of topo IIα is necessary for the initiation of chromatin condensation in early M phase.4,5 Second, this population increased in cell number from day 4 to day 6 of the ATRA treatment, although the cell influx from the S phase must have decreased. This indicates that these cells really stayed at the same stage in the cell cycle. Third, the results from the TUNEL assay on the same differentiated HL-60 samples showed that the apoptotic population was small and restricted to the sub-G1 position (data not shown). We therefore believe that the two-dimensional analysis of our system first clearly detected a G2-arrested nonapoptotic population during the course of differentiation. Because G2 arrest has mainly been studied as a cellular response to DNA damage,38 little is known about the differentiation-induced G2 arrest. Apigenin, a flavone, was reported to cause both G2 arrest and morphologic differentiation in rat neuronal cells.39 Another report showed that even irradiation-induced G2 arrest leads to κ light chain gene expression, a sign of differentiation, in 70Z/3 pre-B–cell line.40Therefore, G2 arrest seems to induce differentiation in some kinds of cells. Because ATRA does not directly block G2/M transition, our result indicates that cell differentiation itself induces G2 arrest. It seems interesting to determine whether differentiation-induced G2 arrest is a general phenomenon. Cell growth and differentiation are tightly coupled in hematopoietic cells of myeloid lineage, and the half-life of peripheral granulocytes is only a few days.41 ATRA treatment induces differentiation and subsequent spontaneous cell death even in acute promyelocytic leukemia (APL) cells.42 Because G2-arrested HL-60 cells are terminally differentiated, they are supposed to undergo apoptosis in a few days.
Two-dimensional flow cytometric analysis of topo IIβ staining (5A7 or 3G3) and TUNEL assay indicated that only the C-terminal portion but not the entire molecule of topo IIβ should be degraded in apoptotic cells. Western blot analysis of Ara-C–treated HL-60 cells using 3G3 clearly showed the proteolytic cleavage of topo IIβ during apoptosis. Comparison of the 5A7 and 3G3 blots confirms that the cleaved topo IIβ fragments retained a central portion but lost the C-terminal 5A7 epitope. On the contrary, a large portion of topo IIα remained of its original size even in an advanced stage of apoptosis. The consistency between the results of flow cytometric analysis and Western blotting argues against a possibility that changes in chromatin structure and topo II conformation during apoptosis could affect the topo IIα and IIβ stainabilities in the flow cytometric analysis. A previous report showed degradation of topo II enzymes during CD95 (Fas/APO-1) -mediated T-cell apoptosis using a rabbit antibody reactive to both isoforms.32 A closer look at its data shows that topo IIβ disappears at an early phase of apoptosis and that topo IIα remained at its original size even in the advanced stage, although its band became rather faint. The sizes of the topo II degradation products in this report were very similar to those of topo IIβ fragments detected in our study. Another report showed a relatively earlier loss of topo IIβ than topo IIα during drug-induced apoptosis in HL-60 and KG1A, although topo II degradates were not detected.31 Therefore, we believe that degradation of topo IIβ but not of topo IIα is a specific and relatively early event in the drug-induced apoptosis.
Both topo IIα and IIβ were dissociated from the chromatin at an early phase of apoptosis and completely separated from the genomic DNA in an advanced stage. The degraded topo IIβ fragments, which lost the C-terminal portion, specifically left the nuclear fraction and dissociated from the chromatin in apoptotic HL-60 cells. This suggests the possible cause-and-effect relationship between the two events. Indeed, some reports indicate that the C-terminal domain itself or its phosphorylation is important for the stability of topo II-DNA interaction.43,44 Topo IIα was also dissociated from the chromatin at an early phase of apoptosis, although a large portion of the enzyme seemed intact, at least by Western blot analysis. This observation suggests that alternative mechanisms might be operating to release topo IIα and maybe also topo IIβ from the chromatin. Several nuclear proteins, including nuclear lamin, PARP, and DNA-PKcs, are inactivated by the degradation of their catalytic sites during apoptosis. Topo IIα and IIβ are unique in that not the apoptotic proteolysis of their catalytic sites, which reside in the first 1,400 amino acids,1 2 but their release from the chromatin abolishes the topo II enzyme activity during apoptosis.
Confocal microscopic study confirmed topo IIα and IIβ distribution in the nucleus except the nucleoli during interphase of growing HL-60 cells. In mitotic HL-60 cells, both topo II isozymes were distributed throughout the cells and topo IIα signal was densely concentrated in the chromosomes, which coincides well with the notion that at least topo IIα is not only a necessary enzyme for the chromatin condensation but also a structural component of the mitotic chromosomes.45-47 Our observation agrees with a recent report on the point that topo IIβ is not preferentially localized in the nucleoli.16 Although the report further indicated that topo IIβ is completely excluded from the chromosomes during mitosis, we detected topo IIβ signal not only in the mitotic cytoplasm but also in the chromosomes. Monoclonal antibody 5A7 besides 3G3 confirmed that a portion of topo IIβ is localized in the mitotic chromosomes (data not shown). Topo IIβ has furthermore been shown to be present in the isolated chromosomes, albeit in smaller quantities than topo IIα.47 We believe that topo IIβ is at least partially distributed in the mitotic chromosomes. In Ara-C–treated HL-60 cells, topo IIα and IIβ were dissociated from the chromatin even at an early phase of apoptosis and were completely excluded from the condensed apoptotic bodies. These observations indicate that dramatic chromatin condensation during apoptosis is entirely topo II-independent. An essential difference must therefore exist between mitotic and apoptotic chromatin condensation.
Differentiation and apoptosis are the two principal cell fates that follow proliferation after cells exit from the cell cycle. Using the HL-60 human leukemia cell line as a model, we have shown the specific loss of topo IIα during differentiation and the degradation of topo IIβ even at an early phase of apoptosis. We believe that this study has clarified the different behavior of two topo II isozymes. As previously proposed,17-21 our results suggest that topo IIα plays an essential role in cell proliferation, especially during late S to M phases. In contrast, topo IIβ might be necessary for cell survival because it exists at a substantial level even in the differentiated cells and is degraded early and specifically during apoptosis. Because hematologic malignancies are currently treated by inducing apoptosis or differentiation, monitoring the topo IIα and IIβ levels in human leukemia samples may be useful to evaluate the effects of cytotoxic and differentiation therapies.
ACKNOWLEDGEMENT
The authors thank Drs Tetsuya Nakamoto and Tokiharu Takahashi (the Third Department of Internal Medicine, Faculty of Medicine, University of Tokyo, Tokyo, Japan) and Dr Katsuhiko Kitsugi (Ortho Clinical Diagnostics, Tokyo, Japan) for their technical advice and Dr Masahiro Kizaki (Division of Hematology, Keio University School of Medicine, Tokyo, Japan) for providing us with HL-60 human myeloid leukemia cell line.
Supported by Grants-in-Aid for Cancer Research from the Ministry of Health and Welfare and from the Ministry of Education, Science and Culture in Japan.
Address reprint requests to Koichi Sugimoto, MD, Department of Hematology, Juntendo University School of Medicine, 2-1-1 Hongo, Bunkyo-ku, Tokyo 113, Japan.
The publication costs of this article were defrayed in part by page charge payment. This article must therefore be hereby marked “advertisement” in accordance with 18 U.S.C. section 1734 solely to indicate this fact.

This feature is available to Subscribers Only
Sign In or Create an Account Close Modal