Abstract
Sepsis is reported to induce an increase in the rate of apoptosis (Ao), in immature lymphoid cells residing in hematopoietic tissues such as the thymus and bone marrow. Alternatively, secondary lymphoid tissue, such as the spleen exhibit little innate (unstimulated) Ao. However, it is unknown whether or not polymicrobial sepsis has any effects on the frequency of Aoin mucosal lymphoid tissue and what, if any, are the functional consequences of such a change. To assess this, Peyer's patch cells were harvested from C3H/HeN (endotoxin-sensitive) mice killed 12 or 24 hours after the onset of polymicrobial sepsis (cecal ligation and puncture [CLP]). The results indicate that the percentage of cells that were Ao+ as determined by flow cytometry were markedly increased at 24 hours, but not at 12 hours post-CLP. This correlates well with evidence of increased DNA fragmentation as well as histological changes observed both at a light and transmission electron microscopic level of the Peyer's patch Ao. Phenotypically, these changes were restricted to the B220+ (B-cell) population that also exhibited a marked increase of Fas/Apo-1 antigen expression. The functional consequence of this increased apoptosis appears to be associated with the endogenous stimulation (activation) of IgA production by mucosal B lymphocytes and increased nuclear c-Rel expression. Furthermore, we found that Peyer's patch lymphocytes isolated from C3H/HeJ-Faslgld(endotoxin-tolerant/Fas ligand- [FasL] deficient) as opposed to C3H/HeJ (endotoxin-tolerant) inbred mice did not exhibit increased Ao after CLP. These findings indicate that increased B-cell Ao appears to be a FasL-Fas antigen-mediated process, but is not due to endotoxin sensitivity. In conclusion, we speculate that the increased Fas-associated apoptosis detected in mucosal B cells (as opposed to splenic or bone marrow B cells) may be due to increased luminal antigens other than endotoxin, released due to gut barrier integrity breakdown during sepsis.
PROGRAMMED CELL DEATH (PCD), is a process by which cells undergo a form of non-necrotic cellular suicide. As opposed to necrotic cell death (typically produced by exposure to a variety of noxious agents), PCD by definition is dependent on the de novo synthesis of specific genes that initiate the cellular suicide program in response to stimuli.1,2 The induction of PCD in immune cells is typically evidenced by a pathological process referred to as apoptosis (A0). Ao is typified by deformation of the cell (blebbing/boiling membrane) membrane, cell shrinkage, and condensation of the nuclear chromatin (due to endogenous endonuclease activity on the genomic DNA).1,2 For the majority of cells this is a constitutive response, but Aomay also be induced in certain cells of the immune system by a variety of stress mediators (ie, glucocorticoids, inflammatory cytokines such as TNF, nitric oxide, etc) that are present during pathological conditions including sepsis. In this respect, sepsis is reported to induce an increase in the rate of Ao in immature lymphocytes residing in hematopoietic tissues such as the thymus and bone marrow.3 4 Alternatively, secondary lymphoid tissue such as the spleen exhibit little innate (unstimulated) evidence of Ao.
With respect to B lymphocytes, it was observed that cells of the bone marrow exhibited evidence of increased B-cell Ao not observed in the splenic B cells.4 Whereas this may in part be explained by variation in the maturational state of these lymphocytes, it may also reflect differences in local tissue exposure to mediators and/or antigens released during polymicrobial sepsis. Inasmuch, one would speculate that lymphoid cells resident in the intestinal wall, such as Peyer's patch cells, would be exposed to increased enteric antigenic burden because studies indicate that after traumatic injury, shock, and/or sepsis, gut barrier permeability is increased.5,6 Such exposure should lead directly or indirectly to the stimulation of local mucosal lymphoid (T- and/or B-cell) tissue, which contributes to local inflammatory response. These mediators in turn may contribute to the suppression of B- and T-cell responses that have been observed after trauma, shock, and sepsis.7 The Peyer's patches are also the major site in which mucosal B cells ultimately become committed to IgA production.8 As the secretion of IgA is an important component in maintaining gut mucosal epithelia immune function,9 and the production of IgA is an outcome of the activation of the B cell,10 alterations in this response may provide insight into the ongoing immune response developed in response to a polymicrobial septic challenge. In this respect, B-lymphocyte activation (as evidenced by nuclear factors activation11,12 and subsequent IgA release) itself is associated with increased Ao as a possible autoregulatory mechanism with pathologic potential.13 14 We, therefore, hypothesize that among the many factors that may play an important role in the modulation of mucosal immunity during sepsis, is the induction of Ao.
The aim of this study was to determine: (1) whether or not mucosal lymphoid cells derived from the Peyer's patches show evidence of increased Ao after polymicrobial sepsis; (2) if such changes are detected, are they associated with alterations in mucosal lymphocyte function, such as IgA production and/or nuclear factor activation; and (3) if such alterations are mediated by endotoxin and/or Fas ligand-Fas antigen (Apo-1/CD95) interaction.
MATERIALS AND METHODS
Cecal ligation and puncture (CLP).15
Male inbred C3H/HeN mice (endotoxin-sensitive)(Charles River, Portage MI), C3H/HeJ (endotoxin-tolerant),16 17 or C3H/HeJ-Faslgld mice (endotoxin-tolerant/Fas ligand [FasL] deficient)18,19(Jackson Laboratory, Bar Harbor, ME) 6 to 8 weeks of age were lightly anesthetized with metofane [Methoxyflurane 2.2-Dichloro-1,1 difluoroethyl methyl ether. B.H.T. (Butylated hydroxytoluene 0.01% wt/wt)]. A midline incision (1.5 to 2 cm) was made just caudal to the diaphragm, to expose the internal organs. The cecum was isolated, ligated just below the ileocecal valve, and punctured (CLP) in two places to induce sepsis. For the controls (CLP-shams), the cecum was isolated but neither ligated or punctured. The muscle layer and epidermal layer were sutured in layers and xylocaine applied to the areas of the incision. Lactated Ringer's Solution (0.6 mL) was administered subcutaneously in these and the sham animals.
The studies performed here were all carried out in accordance with the National Institutes of Health Guidelines on Laboratory Animals and were approved by the Rhode Island Hospital Committee on Animal Use and Care.
Peyer's patch lymphocyte isolation.
The Peyer's patches (4 to 6 patches per mouse) were excised aseptically from the exposed small intestine of methoxyflurane-killed mice at 12 or 24 hours post-CLP or sham-CLP, then placed into petri dishes (60 × 55 mL) containing 5 mL Hank's Balanced Salts Solution (HBSS). The Peyer's patches were gently glass ground, then transferred into a 15 mL conical centrifuge tube, washed once with Dulbecco's Modified Eagle's Medium (DMEM), and centrifuged at 400 × g for 10 to 15 minutes at room temperature. The pellet was disrupted, resuspended in 8 mL of DMEM, layered over 5 mL of 67% Percoll, and centrifuged at 600 × g for 20 minutes. The cells at the interface were then harvested with a pipet and washed in 12 mL of DMEM.
Total viable cell yield.
Peyer's patch cell viability and total cell yield was determined by trypan blue exclusion.
Cell staining and flow cytometric analysis.
In an attempt to correlate the changes in the percentage of cells that were Ao+ with phenotypic expression, cells were stained with the combination of antibodies conjugated to either fluorescein isothiocyanate (FITC), phycoerythrin (PE) or Cy-Chrome, and the DNA dye 4',6-diamino-2-phenylindole, dihydrochloride (DAPI, Molecular Bioprobes Inc, Eugene, OR) for cell cycle analysis according to the methods of Telford et al,20as previously applied in this laboratory.4 In a typical staining protocol, 2 x 10⁶ cells were incubated with 10 μg nonspecific mouse IgG/mL phosphate-buffered saline (PBS), containing 1.0% bovine serum albumin (BSA) and 0.1% sodium azide (PBS-BSA-Az buffer), for 15 minutes at 4°C. The cells were then washed by centrifugation and incubated 45 minutes (4°C) with 25 μL of PBS-BSA-Az buffer containing 1 μg of monoclonal antibody against either the murine B-cell marker CD45R [also known as B220 (clone RA3-6B2, rat IgG2a)], the mouse Thelper-cell marker CD4 (clone RM4-5, rat IgG2a), or Fas (Apo-1/CD95) (clone Jo2, hamster IgG) obtained from Pharmingen Inc (San Diego, CA) conjugated to either FITC, PE, or Cy-Chrome. This step was repeated for two- or three-color monoclonal antibody staining. The cells were again washed as before and fixed for no less then 30 minutes on ice in PBS containing 1% paraformaldehyde. After fixation the cells were pelleted by centrifugation and the pellet resuspended in DAPI staining reagent [0.1% Triton X-100, 0.1 mmol/L EDTA disodium salt, 0.05 mg/mL RNase A (50 units/mg), 1 μg/mL DAPI, in PBS pH 7.4] if the extent of Ao was to be determined. Samples were stored in the dark at 4°C until analysis was carried out (usually within 24 hours). Isotypic controls, ie, 1 μg of either FITC-, PE-, or Cy-Chrome–conjugated rat IgG2a or FITC-conjugated hamster IgG (Pharmingen Inc)/106 cells, were included so as to allow us to assess the nonspecific antibody staining and gate this out appropriately.
For multicolor analysis, DAPI was excited with a Coherenet ANOVA-70S Spectrum laser (Spectrum Products Div, Palo Alto, CA) set to 360 nm and fluorescent emission detected with a 424 ± 22 nm blue reflecting dichroic filter. Alternatively, FITC, PE, and Cy-Chrome conjugates were excited with an argon laser set at 488 nm, but detection of FITC-fluorescent emission was with a 530 ± 15 nm wideband pass filter, whereas PE emission was detected with a 575 ± 13 nm dichroic filter and Cy-Chrome detected with a 670 nm long pass filter. FITC, PE, Cy-Chrome, and/or DAPI emission overlap was corrected by electronic compensation. FITC or PE single-positive as well as double-positive and double-negative DAPI cell cycle analysis was determined after gating of cell-debris and doublets for no less then 20,000 cells/sample. By using PC-Lysis Version 1.0 software (Becton Dickinson, San Jose, CA), FITC-, PE-, or Cy-Chrome–positive as opposed to fluorochrome-negative cells were established based on the fluorescent emission of the nonspecific FITC/PE isotypic antibody controls with two-color fluorescent cytograms. Histograms of the regionalized cells were then produced of cell number versus DAPI stain intensity (DAPI fluorescent emission) from which the percentage of cells residing in various stages of the cell cycle could be determined.
Alternatively, after the determination of B220+ versus B220− negative regions, as described above, histograms of the regionalized cells were then produced of cell number versus anti–Fas-FITC stain intensity (mean channel fluorescence) from which not only the percentage of cells that were Fas positive (Fas+) could be determined based on the isotypic control but also the intensity of Fas antigen expression (see Results section for the results of typical two-color data for DAPI-cell cycle analysis and Fas antigen expression) could be determined.
Light and electron microscopic examination.
For histologic examination, Peyer's patches were excised and fixed immediately by submersion in 4% buffered glutaraldehyde. After 1 to 3 hours of fixation, the buffered glutaraldehyde was then drawn off and the tissues were rinsed with 0.1 mol/L phosphate buffer. The specimens were then postfixed with osmium tetroxide for 1 hour, rinsed in phosphate buffer, and stained en bloc with 2% uranyl acetate. Samples were then dehydrated through a graded ethanol series followed by propylene oxide. The tissue was then infiltrated overnight in a 1:1 mixture of propylene oxide and (Polybed-Araldite) epoxy resin (Polysciences Inc, Warrington, PA). The following day, samples are infiltrated for 8 more hours in Polybed-Araldite resin after which they are embedded in fresh resin. Tissue blocks were polymerized for 2 days at approximately 74°C and then 1 μm sections were prepared with an LKB Ultratome and stained with 1% toluidine blue for examination by light microscopy. Areas selected for ultramicrotomy were sectioned at 70 to 90 nm with a diamond knife and placed on 300-mesh copper grids. Sections were stained with urannyl acetate for 1 hour and lead citrate for 2 to 3 minutes. All sections were examined at 60 kV on a Philips Model 301 transmission electron microscope (Philips Inc, Mahwah, NJ).
IgA ELISpot assay.
The number of Peyer's patch cells secreting IgA was determined by an Enzyme-linked Immunospot (ELISpot) assay.21 Cells were cultured (105/well) overnight on monoclonal antimouse IgA (5 μg/mL; Biosource Inc, Camarillo, CA) precoated (overnight at 4°C), sterile Multiscreen-HA 96-well nitrocellulose filtration plates (Millipore Corp, Bedford, MA). After washing and incubation (overnight at 4°C) with a secondary biotinylated monoclonal antimouse IgA (2.5 μg/mL; Pharmingen Inc, San Diego, CA), antibody color was developed with avidin-peroxidase-H202–ACE (3-amino-9-ethylcarbazole in 0.1 mol/L sodium acetate buffer [pH 5.0]). The number of spots present in the well was determined on a Mocha Image analysis system (Jandel Scientific, Corte Madera, CA).
Assessment of B-cell nuclear expression of Rel(c-Rel and RelB)/nuclear factor κB (NF-κB) factors by western blot analysis.
The nuclear appearance (expression) of Rel/NF-κB factors, c-Rel, and RelB, as an index of the potential nature of the in vivo B-cell stimulant, was assessed by Western immunoblot analysis of the nuclear extracts of B220+ cells harvested from the Peyer's patches of animals 24 hours after sham-CLP operation or CLP.
B220+ cells were selected (enriched) from 1 × 10⁷Peyer's patch cells, as previously described in our laboratory,22 by binding to 4 × 10⁷antimouse B220 coated/goat antirat IgG magnetic M-450 Dynabeads (Dynal, Inc, Great Neck, NY) per 5 mL and then gently stirring with a rotary blood mixer (Robbins Scientific Corp, Sunnyvale, CA) for 30 minutes at 4°C. (4 × 10⁷ antimouse B220 coated/goat antirat IgG magnetic M-450 Dynabeads were created when approximately 1.5 × 10⁸ Dynabeads in 10 mL of RPMI 1640 were coated overnight at 4°C with monoclonal rat antimouse B220 [Pharmingen, San Diego, CA] 10 μg/mL, and washed three times before use.) The bead-bound cells (B220+) were then concentrated by using a MCP-1 magnetic particle concentrator (Dynal, Inc) for 1 minute and the unbound (B220−) cells discarded. The cells that remained were washed one more time, magnetically concentrated, and resuspended in RPMI 1640 medium. Typical cell yield after positive magnetic selection was approximately 4 × 10⁶ cells total.
Nuclear fraction was then prepared by using a modification of the methods of Sikora et al.23 Briefly, the nuclear fraction of 2 × 10⁷ cells was prepared by the addition of two volumes of 0.2% Nonidet P-40 in cell lysis buffer (10 mmol/L HEPES pH 7.9, 0.2 mmol/L EDTA, 1 mmol/L DDT, 0.5 mmol/L PMSF, and 10 mg aprotinin/mL) to the washed cell pellet that was then incubated for 10 minutes on ice. The nuclei were pelleted by centrifugation at 3,300 × g for 15 minutes and the nuclear proteins extracted from the pellet by resuspension in half the volume of extraction buffer (20 mmol/L HEPES pH 7.9, 0.4 mol/L NaCl, 0.2 mmol/L EDTA, 1 mmol/L DDT, 0.5 mmol/L PMSF, and 10 mg aprotinin/mL), incubated for 30 minutes at 4°C, aliquoted, and stored at −70°C until required for further assay.
The protein content of nuclear extract was determined fluorometrically by using the NanoOrange Protein Kit (Molecular Bioprobes Inc, Eugene, OR). The assays were carried out in a 96-well microculture dish (Corning Scientific, Corning, NY) at a final reaction mixture volume of 250 μL and the change in fluorescence measured on a Bio-Tek FL 500 model, fluorescent plate reader (Bio-Tek Instruments, Winooski, VT).
Ten μg of nuclear extract protein (diluted in Tricine-gel sample buffer) was separated on a precast 10% to 20% Tricine-sodium dodecyl sulfate (SDS) polyacrylamide gel (Novex Experimental Technology, San Diego, CA) electrophoretically24 by using a Profile minigel electrophoresis system (Schleicher & Schuell, Keene, NH) with EC 105 power supply (approximately 90 mA, 70 V for approximately 1.5 hours; E-C Apparatus Corp, St. Petersburg, FL). The separated proteins were then electroblotted (by using a Profile miniblotter [Schleicher & Schuell, Keene, NH]; approximately 280 mA, approximately 30 V, for approximately 1.5 hours) out of the gel onto nitrocellulose (Novex Exp Tech). The blots were rinsed in Tris-buffered saline containing 0.05% Tween-20 (TBS-Tween 20) and blocked for 2 to 4 hours with TBS-Tween 20 including 5% nonfat dry milk. Blots were then washed 4 to 5 times (15 minutes per wash), incubated (4°C) with 3 to 4 mL of primary rabbit IgG polyclonal antibody directed against either c-Rel or RelB (sc-070 and sc-226, respectively; Santa Cruz Biotech, Santa Cruz, CA), or normal rabbit IgG control polyclonal nonimmune sera (Santa Cruz Biotech) at concentration of 3μg/mL for 4 hours at 4°C in a 50 mL polyethylene centrifuge tube gently rotated on a Robbins blood mixer (Robbins Sci Corp, Mountain View, CA). After washing the blots 4 to 5 times, they were incubated at room temperature for 1 hour with secondary polyclonal goat antirabbit IgG antibody conjugated to alkaline phosphatase (1:1000; Santa Cruz Biotech). Finally, after 4 to 5 washings the blots were developed in alkaline phosphatase substrate buffer (100 mmol/L Tris, 100 mmol/L NaCl, 50 mmol/L MgCl2; pH 9.5) containing 330 μg nitroblue-tetrazolium and 168 μg 5-bromo-4-chloro-3-indolyl phosphate/mL for 45 minutes. Molecular weight (kD) of the proteins of interest was determined by comparison with low molecular weight standards included in each gel. To quantify the differences present in various nuclear extract samples, the band intensities were assessed densitometrically by using a Mocha Image Analysis/SigmaGel work station (Jandel Scientific, Corte Madera, CA).
Qualitative assessment of internucleosomal DNA fragmentation by gel electrophoresis.
After washing, 3 x 10⁶ total Peyer's patch cells were extracted for genomic DNA by 10 minute lysis in 20 mmol/L Tris-HCl, pH 7.4, containing 10 mmol/L EDTA, and 0.2% Triton-X100. After removal of cell debris the supernatant was incubated overnight with Proteinase K (100 ug/mL, 50°C). The DNA was then chloroform/phenol extracted and precipitated by using isopropanol (overnight, −20°C). After centrifugation, the pellet was dried in a SpeedVac Plus (Savant Instrument Inc, Farmingdale, NY) .
Genomic DNA was dissolved in 25 μL Tris-EDTA buffer containing 1 μg RNase/mL and incubated for 1 hour (37°C). Five μL of 6 × TBE sample buffer was then added to each DNA sample, heated (65°C, 10 minutes) and then 15 μL applied to precast TBE 4% to 20% polyacrylamide gel (Novex Experimental Technology). The samples and standard (Lambda-DNA hindIII) were then electrophoresed for 90 minutes (90 to 100 V), stained with ethidium bromide, rinsed, visualized under UV light, and documented with Polaroid film (Polaroid Corp, Cambridge, CA).
Presentation of data and statistical analysis.
The data are presented as a mean and SE of the mean for each group. Differences for total viable cell yields were considered to be significant if P < .05, as determined by ANOVA (Spectrum Products Div) and a Tukey's test, was applied for multiple comparison. Differences in percentile data (ie, percentage of Ao+) were considered to be significant if P < .05, as determined by using the Mann-Whitney U test.
RESULTS
Polymicrobial sepsis induces a marked increase in the frequency of Ao detected in Peyer's patches.
Figure 1A illustrates that a small but statistically significant decline in total viable Peyer's patch cell yield from endotoxin-sensitive C3H/HeN mice was detected at 24 hours but not 12 hours after CLP. Alternatively, at 24 hours but not 12 hours, a significant increase in the frequency of cells that were undergoing Ao was evident as detected by hypoploid DAPI DNA staining ( Fig 1B). Evidence of endogenous endonuclease activity, as detected by the fragmentation of genomic DNA, was also observed in the DNA obtained from the septic-mouse Peyer's patch cells harvested at 24 hours post-CLP (Fig 2).
Peyer's patch (A) total viable cell yield (as determined by trypan blue exclusion) from C3H/HeN mice is significantly different 24 but not 12 hours after CLP. Sepsis (CLP) induces a significant increase in the percentage of mixed Peyer's patch cells that are determined to be (B) Ao+ by DAPI stain. Significance indicated by * at P< .05 versus sham, Mann-WhitneyU test; Mean ± SEM; n = 6 mice sampled /group.
Peyer's patch (A) total viable cell yield (as determined by trypan blue exclusion) from C3H/HeN mice is significantly different 24 but not 12 hours after CLP. Sepsis (CLP) induces a significant increase in the percentage of mixed Peyer's patch cells that are determined to be (B) Ao+ by DAPI stain. Significance indicated by * at P< .05 versus sham, Mann-WhitneyU test; Mean ± SEM; n = 6 mice sampled /group.
Genomic DNA extracted from mixed Peyer's patch cells of C3H/HeN mice typically exhibits increased evidence of endogenous endonuclease activity in the form of DNA fragmentation as detected by TBE-PAGE after the onset of sepsis (CLP).
Genomic DNA extracted from mixed Peyer's patch cells of C3H/HeN mice typically exhibits increased evidence of endogenous endonuclease activity in the form of DNA fragmentation as detected by TBE-PAGE after the onset of sepsis (CLP).
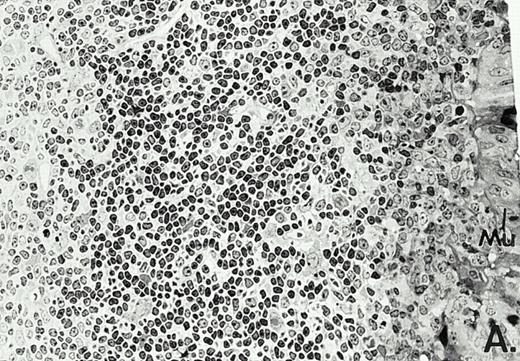
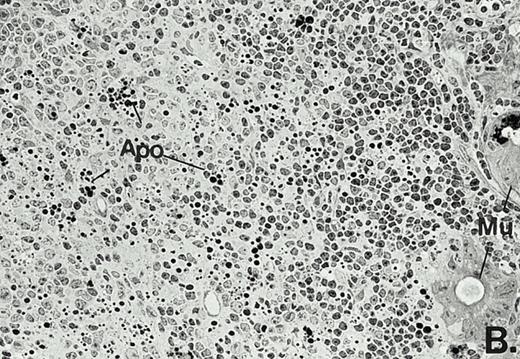
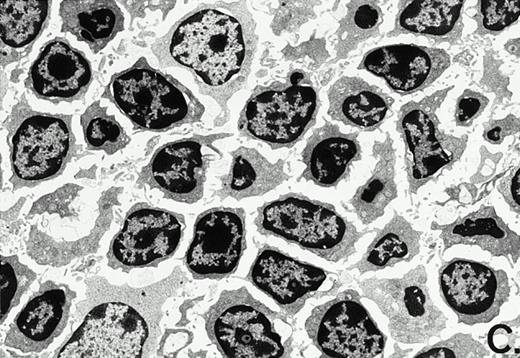
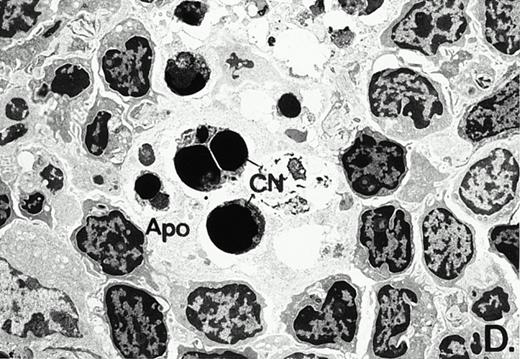
To determine whether the alterations observed in the ex vivo isolated cells represented in vivo changes at the tissue level, we examined the Peyer's patches harvested from C3H/HeN mice at both a light and electron microscopic level for evidence of Ao. Figure 3A and C are representative samples taken from a 24-hour postsham-operated mouse that exhibited typical Peyer's patch morphology. However, Peyer's patches taken from mice 24 hours after onset of polymicrobial sepsis showed a marked change in morphology (Fig 3B). With respect to the septic mouse Peyer's patches, the majority of the apoptotic cells appear to be clustered in the germinal center and not in the T-cell region localized more proximal to the mucosal epithelial layer. Closer inspection of these apoptotic clusters on an electronic micrographic level revealed karyorrhectic cells with condensed nuclei and what appear to be apoptotic bodies (Fig3D).
Marked changes in the C3H/HeN CLP mouse Peyer's patch histology are evident at both the light microscopic (A v B) level and at the electron microscopic level (C v D) 24 hours postsham or CLP. (A) Illustrates typical lymphocyte morphology. The figure is oriented with the mucosal epithelia (Mu) appearing on the right side of the picture moving towards the germinal center on the left-hand side (magnification = 216X). (C) Shows normal lymphocytic morphology encountered at an electron microscopic level in the sham mouse's Peyer's patch (magnification = 4825X). (B) Alternatively, shows changes typically encounter in the Peyer's patch of a septic mouse at a light microscopic level. Clusters of apoptotic cells (Apo), with condense nuclei, can be observed, appearing to increase in frequency within the germinal center of the CLP mouse's Peyer's patch, as opposed to the T-cell zone adjacent to the mucosal epithelia (Mu)(magnification = 216X). (D) Electron microscopic inspection of a typically cluster of apoptotic cells within the germinal center showed marked nuclear condensation (CN), cytoplasmic shrinkage, as well as evidence of apoptotic fragmentation (Apo)(magnification = 4825X).
Marked changes in the C3H/HeN CLP mouse Peyer's patch histology are evident at both the light microscopic (A v B) level and at the electron microscopic level (C v D) 24 hours postsham or CLP. (A) Illustrates typical lymphocyte morphology. The figure is oriented with the mucosal epithelia (Mu) appearing on the right side of the picture moving towards the germinal center on the left-hand side (magnification = 216X). (C) Shows normal lymphocytic morphology encountered at an electron microscopic level in the sham mouse's Peyer's patch (magnification = 4825X). (B) Alternatively, shows changes typically encounter in the Peyer's patch of a septic mouse at a light microscopic level. Clusters of apoptotic cells (Apo), with condense nuclei, can be observed, appearing to increase in frequency within the germinal center of the CLP mouse's Peyer's patch, as opposed to the T-cell zone adjacent to the mucosal epithelia (Mu)(magnification = 216X). (D) Electron microscopic inspection of a typically cluster of apoptotic cells within the germinal center showed marked nuclear condensation (CN), cytoplasmic shrinkage, as well as evidence of apoptotic fragmentation (Apo)(magnification = 4825X).
Increased endogenous Ao detected in septic mouse Peyer's patch cells is restricted to cells of the B- but not T-cell linage.
In an effort to delineate the population of C3H/HeN mouse Peyer's patch cells undergoing Ao after the onset of sepsis, cells were concomitantly stained with the nonspecific murine B-cell marker B220 (CD45) and the DNA dye DAPI.
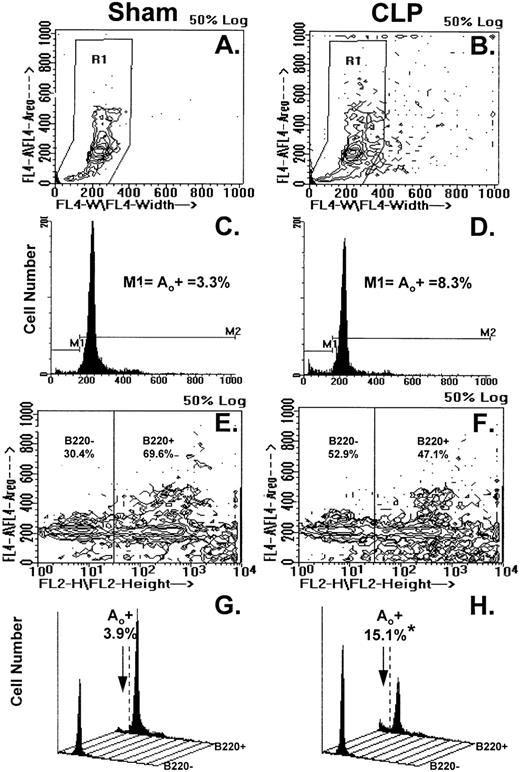
Figure 4A through H illustrates the results of typical two-color flow cytometric analyses of cell suspensions obtained from the Peyer's patch 24 hours after sham-CLP (sham) or CLP (simultaneously stained and analyzed). The contour plots in Fig 4A and B show the typical cell cycle progression for sham or CLP-mouse Peyer's patch cells and the primary region (R1) established around these populations. In Fig 4C and D, the cell cycle histograms of cell number versus DNA content generated from the R1 region in Fig 4A and B are shown. By using the sham, the histogram was divided into two subregions (M1=apoptotic [Ao+] cell cycle region and M2=which includes G0/G1, S, and G2/M cell cycle region, respectively). These regions were kept consistent for all samples analyzed in a given experiment. With respect to the sham, it can be observed that Peyer's patch cells extracted from a septic mouse at 24 hours exhibited a population of cells tailing off towards the lower left-hand corner with lower DNA content from the G0/G1 peak (Fig 4A and B). This is reflected by the increased percentage of apoptotic cells detected in the M1 region of the histogram (Fig 4C and D). By using a rat IgG-PE control, B220+ cells were discriminated from B220− cells as depicted in Fig 4E and F and then cell cycle histograms were produced (Fig 4G and H). Cell cycle histograms of DNA content produced from each of these gated phenotypic populations illustrate that the majority of the increase in apoptotic cells was typically present in the B220+- stained cell population (Fig 4G and H).
(A through H) illustrates the results of typical two-color flow cytometric analysis of a cell suspension obtained from the Peyer's patch 24 hours after sham-CLP (sham)(A, C, E, G) or CLP (B, D, F, H; simultaneously stained and analyzed). (A and B) represents contour plots of the total cell sample delineated by DAPI fluorescence (FL4-A) versus cell size (width; FL4-W). The primary region (R1) typically established to enclose those cells in the various stages of the cell cycle is also depicted. (C and D) are the cell cycle histograms of cell number versus DNA content (DAPI fluorescent intensity) generated from the R1 gated populations in (A and B). (E and F) are the representative contour plots of these same cell samples assessed by their phenotypic expression, ie, DAPI (FL4-A) versus B220 (FL2-H) fluorescent staining intensity. The nonspecific/negatively (-) stained cells were delineated from the positively stained cells by the use of isotypic antibody controls as indicated in the methods and these regions are indicated as “B220-” or “B220+” regions and the percentage of cells expressing a given phenotype are given. Cell cycle histograms (G and H) of cell number versus DNA content (DAPI fluorescent intensity) produced from each of the phenotypically defined populations in (E and F), respectively, illustrate the typical changes observed in frequency apoptotic cells encountered after CLP in Peyer's patch cells.
(A through H) illustrates the results of typical two-color flow cytometric analysis of a cell suspension obtained from the Peyer's patch 24 hours after sham-CLP (sham)(A, C, E, G) or CLP (B, D, F, H; simultaneously stained and analyzed). (A and B) represents contour plots of the total cell sample delineated by DAPI fluorescence (FL4-A) versus cell size (width; FL4-W). The primary region (R1) typically established to enclose those cells in the various stages of the cell cycle is also depicted. (C and D) are the cell cycle histograms of cell number versus DNA content (DAPI fluorescent intensity) generated from the R1 gated populations in (A and B). (E and F) are the representative contour plots of these same cell samples assessed by their phenotypic expression, ie, DAPI (FL4-A) versus B220 (FL2-H) fluorescent staining intensity. The nonspecific/negatively (-) stained cells were delineated from the positively stained cells by the use of isotypic antibody controls as indicated in the methods and these regions are indicated as “B220-” or “B220+” regions and the percentage of cells expressing a given phenotype are given. Cell cycle histograms (G and H) of cell number versus DNA content (DAPI fluorescent intensity) produced from each of the phenotypically defined populations in (E and F), respectively, illustrate the typical changes observed in frequency apoptotic cells encountered after CLP in Peyer's patch cells.
Figure 5 depicts the summary of the data from no less than six independent animals. Peyer's patch samples were examined in each group. Although a small decline in the percentage of cells that are B220+ was observed in the CLP mice, this was not statistically significant (Fig 5A). Alternatively, there was a marked increase in the percentage of cells that were apoptotic in septic mice, as compared with sham mice, as determined by cell cycle analysis in the population of cells that were B220+ (Fig5B). No similar change was evident in the B220− cell population. Although not shown, combined staining with antibody against the T-helper cell marker CD4 and DAPI did not show evidence of an increased frequency of Ao in this cell population (data not shown).
Phenotypic assessment of the percentage Ao+ cells from C3H/HeN mice indicates that marked augmentation of Ao is present in the Peyer's patch cells is confined primarily to B220+ (B lymphocytes) subpopulation but not the B220- (B). This occurred despite the lack of significant change in the frequency of B220+ cells (A). Significance indicated by * at P < .05 versus sham, Mann-Whitney U test; mean ± SEM, n = 6 to 7 mice sampled /group. Although not shown, Peyer's patch cells stained with antibody to CD4 (Thelper-cell) showed no change in the percentage Ao+ cells.
Phenotypic assessment of the percentage Ao+ cells from C3H/HeN mice indicates that marked augmentation of Ao is present in the Peyer's patch cells is confined primarily to B220+ (B lymphocytes) subpopulation but not the B220- (B). This occurred despite the lack of significant change in the frequency of B220+ cells (A). Significance indicated by * at P < .05 versus sham, Mann-Whitney U test; mean ± SEM, n = 6 to 7 mice sampled /group. Although not shown, Peyer's patch cells stained with antibody to CD4 (Thelper-cell) showed no change in the percentage Ao+ cells.
Polymicrobial sepsis induces an increase in the number of Peyer's patch B cells that are secreting IgA.
To determine the potential functional significance of the increase in B-lymphocyte Ao during sepsis, the ability of cells harvested from these animals to secret IgA was determined by using an ELISpot method. The result in Fig 6indicates that septic C3H/HeN mouse Peyer's patch cells exhibited a marked increase in the number of cells secreting IgA.
Sepsis (CLP) induces a significant increase in the number of Peyer's patch cells from C3H/HeN mice secreting IgA as determined by ELISpot. Significance indicated by * at P < .05 versus Sham, Mann-Whitney U test; Mean ± SEM; n = 5 to 6 mice sampled /group.
Sepsis (CLP) induces a significant increase in the number of Peyer's patch cells from C3H/HeN mice secreting IgA as determined by ELISpot. Significance indicated by * at P < .05 versus Sham, Mann-Whitney U test; Mean ± SEM; n = 5 to 6 mice sampled /group.
Polymicrobial sepsis induces an increase in the nuclear expression of c-Rel but not RelB in Peyer's patch B cells.
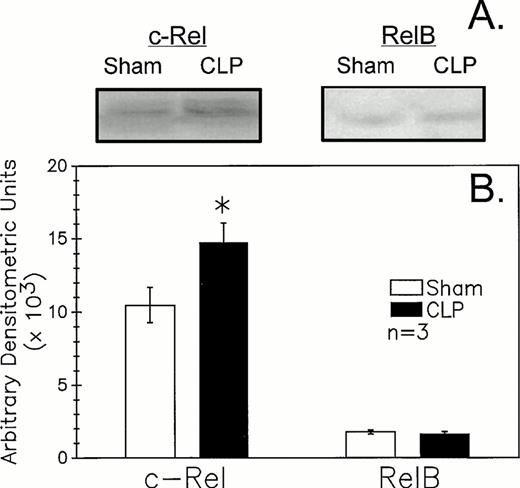
Because recent studies11,12 25 indicate that mature B-cell activation through the B-cell (Ig) receptor induces a marked increase in the nuclear translocation/activation of the c-Rel component of the Rel family of NF-κB factors, as opposed to stimulants such as endotoxin (ie, lipopolysaccharide) or CD40 ligand, which appear to activate alternative components, such as RelB. We thought it should be possible to obtain indirect insight as to the nature of the in vivo B-lymphocyte stimulant acting on these cells after CLP. The results of the western immunoblot analysis of the B220+ cell nuclear extracts documented an increase in expression of c-Rel (approximately 75 kD) in septic mice relative to sham (Fig 7A and B). Alternatively, it was observed that RelB (approximately 68 kD) did not appear to differ in its expression between sham and CLP mouse samples. Although not shown, no staining in the molecular weight range of either c-Rel or RelB with the control rabbit sera provided for these antibodies was seen.
CLP of C3H/HeN mice typically induced an increase in B220+ cell nuclear extract c-Rel expression (A) as compared to sham mouse cells at 24 hours observed by Western immunoblot analysis. Alternatively, RelB expression (B) although evident is not typically markedly different in extracts from sham or CLP mice. These densitometric results are presented for three repeated independent experiments.
CLP of C3H/HeN mice typically induced an increase in B220+ cell nuclear extract c-Rel expression (A) as compared to sham mouse cells at 24 hours observed by Western immunoblot analysis. Alternatively, RelB expression (B) although evident is not typically markedly different in extracts from sham or CLP mice. These densitometric results are presented for three repeated independent experiments.
The increased Ao detected in Peyer's patch cells during sepsis is Fas-ligand but not an endotoxin-mediated process.
Because recent studies have indicated that lymphocyte activation is associated with accelerated Ao that may be mediated via the cell surface antigen known as Fas antigen and its associate ligand,26 we performed experiments to assess the expression of this antigen in the Peyer's patch cells at 12 and 24 hours after the onset of polymicrobial sepsis.
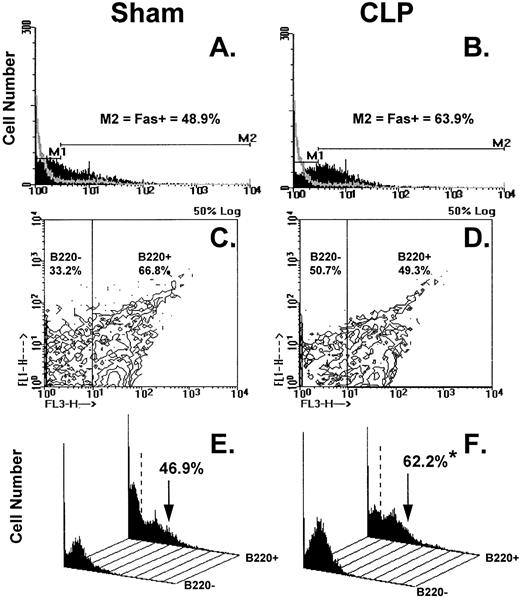
Figure 8A through F illustrates the results of typical two-color flow cytometric analyses of cell suspensions obtained from the C3H/HeN mice Peyer's patch 24 hours after sham-CLP (sham) or CLP concomitantly stained and analyzed for Fas antigen and B220. The histograms in Figure 8A and B show the typical Fas antigen staining pattern for sham- or CLP-mouse Peyer's patch cells over which the hamster IgG-FITC control antibody staining was superimposed. By using the isotype control the histograms were divided into two subregions (M1 = Fas− and M2 = Fas+). These regions were kept consistent for all samples analyzed in a given experiment. With respect to the sham, it can be observed that the mixed Peyer's patch cells extracted from a septic mouse at 24 hours exhibited a population of cells that are shifted to the right resulting in an increase in the percentage of Fas+cells (Fig 8A and B, as well as summary data for repeated experiments provided in Fig 9A and B). By using a rat IgG-PE control, B220+cells were again discriminated from B220− cells as depicted in Fig 8C and D and then the percentage of cells that were Fas+ was again determined as depicted in the histograms in Fig 8E and F. These histograms of Fas+ staining produced from each of the gated phenotypic populations show that the majority of the increase in Fas+cells was restricted to the B220+stained cell population (Fig 8E and F, as well as summary data for repeated experiments provided in Fig 10).
(A through F) shows the results of typical two-color flow cytometric analysis of a cell suspension obtained from C3H/HeN mice Peyer's Patches 24 hours after sham-CLP (sham)(A, C, E, G) or CLP (B, D, F, H; simultaneously stained and analyzed). (A and B) are histograms of cell number versus FITC-fluorescent intensity generated from the ungated populations stain either antibody to Fas antigen (solid black histogram) or isotypic antibody control (light gray overlayed histogram)(summary data for repeated experiments is provided in Fig 9A and B). The nonspecific/negatively (M1) stained cells were delineated from the Fas-antigen positively (M2) stained cells by the use of isotypic antibody controls. Similarly, B220+ cells were discriminated from B220- cells by using isotypic Cychrome antibody control. The percentage of cells expressing a given phenotype are given (C and D). Histograms (E and F) of cell number v Fas antigen fluorescent intensity produced from each of the B220 phenotypically defined populations, respectively, illustrate the typical changes observed in the frequency of Fas antigen positive cells encountered after CLP in the Peyer's patch cells (summary data for repeated experiments is provided in Fig 10).
(A through F) shows the results of typical two-color flow cytometric analysis of a cell suspension obtained from C3H/HeN mice Peyer's Patches 24 hours after sham-CLP (sham)(A, C, E, G) or CLP (B, D, F, H; simultaneously stained and analyzed). (A and B) are histograms of cell number versus FITC-fluorescent intensity generated from the ungated populations stain either antibody to Fas antigen (solid black histogram) or isotypic antibody control (light gray overlayed histogram)(summary data for repeated experiments is provided in Fig 9A and B). The nonspecific/negatively (M1) stained cells were delineated from the Fas-antigen positively (M2) stained cells by the use of isotypic antibody controls. Similarly, B220+ cells were discriminated from B220- cells by using isotypic Cychrome antibody control. The percentage of cells expressing a given phenotype are given (C and D). Histograms (E and F) of cell number v Fas antigen fluorescent intensity produced from each of the B220 phenotypically defined populations, respectively, illustrate the typical changes observed in the frequency of Fas antigen positive cells encountered after CLP in the Peyer's patch cells (summary data for repeated experiments is provided in Fig 10).
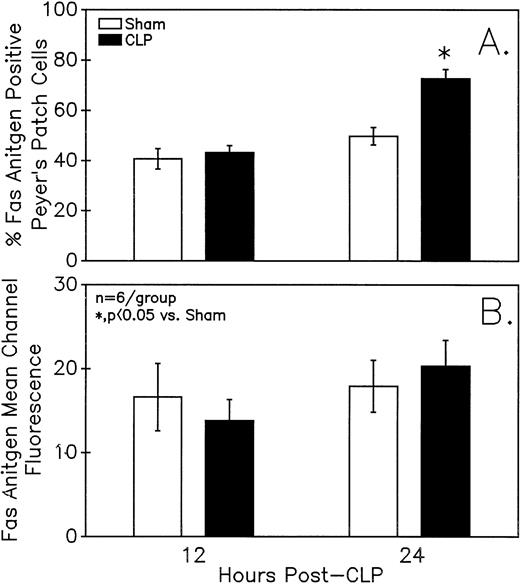
Assessment of the Fas antigen expression in mixed Peyer's Patch cells from C3H/HeN mice illustrates that both the percentage of cells that are Fas+ (A) as well as the Fas antigen expression per cell (as shown by increased mean channel fluorescence) (B) is increased at 24 hours after the onset of sepsis. Signficance indicated by * at P< .05 versus sham, Mann-Whitney U test; Mean ± SEM; n = 6 mice sampled /group.
Assessment of the Fas antigen expression in mixed Peyer's Patch cells from C3H/HeN mice illustrates that both the percentage of cells that are Fas+ (A) as well as the Fas antigen expression per cell (as shown by increased mean channel fluorescence) (B) is increased at 24 hours after the onset of sepsis. Signficance indicated by * at P< .05 versus sham, Mann-Whitney U test; Mean ± SEM; n = 6 mice sampled /group.
Phenotypic assessment of the percentage Fas+ cells indicates that marked augmentation of Fas antigen expression present in the Peyer's patch cells from C3H/HeN mice is confined primarily to the CLP mouse B220+ (B lymphocytes) subpopulation but not the B220−. This occurred despite the lack of significant change in the Fas antigen mean channel fluorescence of B220+ cells. Significance indicated by * at P < .05 versus sham, Mann-Whitney Utest; mean ± SEM; n = 6 mice sampled/group. Although not shown, Peyer's patch cells stained with antibody to CD4 (Thelper-cell) showed no marked change in the percentage of Fas+ cells or their mean channel fluorescence.
Phenotypic assessment of the percentage Fas+ cells indicates that marked augmentation of Fas antigen expression present in the Peyer's patch cells from C3H/HeN mice is confined primarily to the CLP mouse B220+ (B lymphocytes) subpopulation but not the B220−. This occurred despite the lack of significant change in the Fas antigen mean channel fluorescence of B220+ cells. Significance indicated by * at P < .05 versus sham, Mann-Whitney Utest; mean ± SEM; n = 6 mice sampled/group. Although not shown, Peyer's patch cells stained with antibody to CD4 (Thelper-cell) showed no marked change in the percentage of Fas+ cells or their mean channel fluorescence.
Summary data of no less that six animal's cells samples in each group were presented in Fig 9A and B. At 12-hours post-CLP, no marked change in Fas antigen expression was evident in the mixed Peyer's patch cell population. However, by 24 hours a significant increase in the percentage of cells that were positive for Fas antigen on septic mouse cells was evident. Also although Fas antigen mean channel fluorescence trended towards an increase in these septic mouse cells, it was not statistically significant. Additionally, the percentage of Fas antigen-positive cells was determined as a component of B220 antigen expression. The results indicated that the increase in the percentage of Fas antigen positive cells observed in the mixed septic mouse Peyer's patch cells at 24 hours was primarily caused by a marked increase in the percentage of cells that were B220+, which were expressing Fas antigen and were not caused by changes in the B220- population (Fig 10B). In this respect, no increase in the percentage of Fas antigen positive cells on cells expressing the T-cell phenotype, CD4 was observed (data not shown).
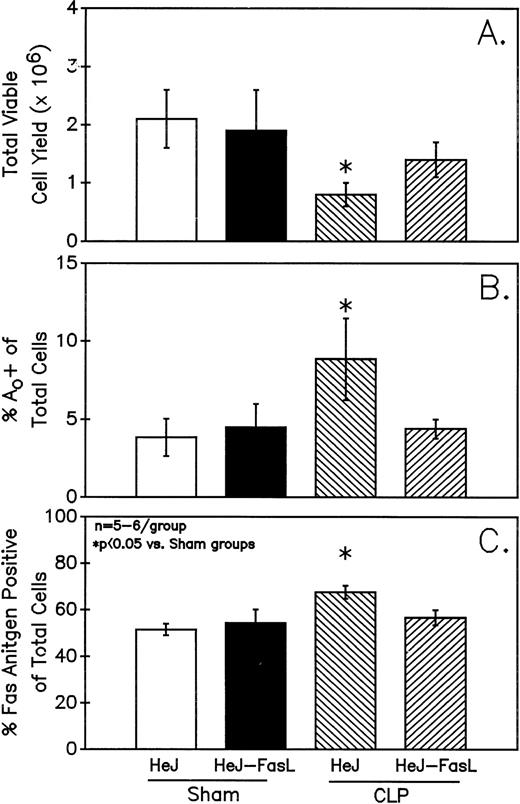
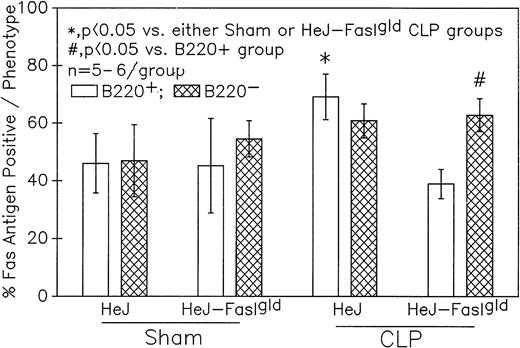
A series of experiments were performed to determine if the increase in Ao C3H/HeN mouse Peyer's patch B220+ cells was due to either endotoxin (ETX; a product of gram-negative bacteria observed in CLP mice) and/or the Fas ligand.18 19Figure 11A illustrates that only in the Peyer's patch cells harvested from endotoxin-tolerant C3H/HeJ16,17 septic mice was a marked decline in viable cell yield detected. Alternatively, although there was a slight decline in the viable cell yield from the FasL-deficient C3H/HeJ-Faslgld septic mice, it was not statistically significant. Figure 11B shows that only the cells obtained from CLP C3H/HeJ mouse and not the C3H/HeJ-Faslgld mice exhibited increase in the percentage of Ao+. This increase in the percentage of Ao+ was also associated with a significant increase in the percentage of Fas+ cells (Fig 11C). Here again, the enhancement in percentage of Fas+ cells was restricted to the B220+ cell population and was not a response to changes in the B220− population (Fig 12).
Only Peyer's patch cells harvested from C3H/HeJ CLP mice showed a marked decline in viable cell yield (A), which is associated with a significant increase in both the frequency of Ao (B) and percentage of Fas+ cells (C). Significance indicate by * at P< .05 versus sham, Mann-Whitney U test; Mean ± SEM; n = 6 mice sampled /group.
Only Peyer's patch cells harvested from C3H/HeJ CLP mice showed a marked decline in viable cell yield (A), which is associated with a significant increase in both the frequency of Ao (B) and percentage of Fas+ cells (C). Significance indicate by * at P< .05 versus sham, Mann-Whitney U test; Mean ± SEM; n = 6 mice sampled /group.
Phenotypic assessment of the percentage of Fas+ cells indicates that marked augmentation of Fas antigen expression is present in the Peyer's patch cells is confined primarily to the B220+ (B-lymphocytes) subpopulation but not the B220- of cells harvested from septic (CLP) C3H/HeJ mice. Significance indicated by * at P< .05 v sham, Mann-Whitney U test; mean ± SEM; n = 5 to 6 mice sampled/group.
Phenotypic assessment of the percentage of Fas+ cells indicates that marked augmentation of Fas antigen expression is present in the Peyer's patch cells is confined primarily to the B220+ (B-lymphocytes) subpopulation but not the B220- of cells harvested from septic (CLP) C3H/HeJ mice. Significance indicated by * at P< .05 v sham, Mann-Whitney U test; mean ± SEM; n = 5 to 6 mice sampled/group.
DISCUSSION
The results presented here show that mucosal lymphocytes obtained from Peyer's patches undergo a marked induction of Ao during sepsis. This is supported by evidence of augmented endonuclease activity in the septic animal's Peyer's patch cells (as detected by both flow cytometry or TBE-PAGE, as well as by the increased presence of morphologically apoptotic cells detected in the septic mouse Peyer's patch germinal centers). The majority of these changes appear to be restricted to cells of the B-cell lineage (B220+). It could be argued that this increase in apoptotic frequency (from approximately 3.5% in the sham to approximately 7.3% in CLP) might not be sufficient to account for the approximately 2/3 reduction in Peyer's patch viable cell yield. However, it should be noted that the clearance of apoptotic cells is a dynamic process in which macrophages are constantly involved in the removal of nonviable cells.27 Hence, the accumulation of apoptotic cells at any one time point in vivo would not necessarily have to be large. The increase in Ao detected in these septic mice appears to be associated with an augmented endogenous IgA secretory response. We would speculate that this is in part a response to altered exposure to enteric antigens released due to increased gut permeability observed during sepsis.5,6 Inasmuch, this increase of Aoin Peyer's Patch B cells would appear to be an example of activation-induced lymphocyte Ao.28 29
With respect to the kinetics of the apoptotic response exhibited here in the Peyer's patch B220+ lymphoid cell population after CLP, we observed that increased Ao was not evident until 24 hours and not at 12 hours after the onset of polymicrobial sepsis. A similar observation was made with respect to viable cell yield. Interestingly, although the delay in the expression of increased Ao in the Peyer's patch cells differs from our previous observations made with respect to cells of the thymus,3,4in which evidence of an increased frequency of Ao was detectable as early as 4 hours post-CLP; these findings are comparable to our findings made with respect to bone marrow B-lymphocyte Ao in which only late (24-hours post-CLP) after the onset of sepsis was an increase in apoptotic frequency observed.4However, these results differ from splenic B cells in which no detectable increase in innate Ao was observed up through 24-hours post-CLP. This supports the hypothesis that immune cells of a given linage, be they T cells,4 macrophages,30and/or granulocytes,31 respond differently with respect to the induction of apoptotic processes in response to polymicrobial sepsis. This is due not only to differences in their respective microenvironments, but their ontological/differentiation status, as well as variation in the local concentration and/or form of potential antigens and/or mediators capable of altering the apoptotic process. In this respect, the increased apoptotic response of mucosal B cells, such as Peyers patch cells examined here, as compared to splenic B cells lack of Ao, we speculate is a reflection of the difference in their exposure to enteric antigens moving across the mucosal cell barrier. It has been well documented that gut barrier function is reduced after trauma, shock, and/or sepsis that would lead to a marked influx of such enteric antigens.32,33 To the extent that the finding of augmented B-cell Ao might be a peculiarity of Peyer's patches, we have recently observed in preliminary studies that B220+ lymphocyte subset of the lamina propria also exhibit a marked increase in Ao during sepsis (24 hours; sham, 30.9 ± 2.3v CLP; 40.0% ± 2.0%* Ao+, P< .05, n = 6/group). To the extent that this is a reflection of the teleological linkage between which is thought to exist in the development of a mucosal B-cell IgA-mediated response (antigenic stimulation of Peyer's patch B cells [commitment to IgA production] leading to differentiation, migration, through messenteric lymph nodes and eventually to the lamina propria8) or a reflection of a global nonspecific cellular intestinal response, must still be determined. However, as we have not as yet assessed IgA production in the Lamina propria B-cell population, it is unknown if this increased Ao is comparably associated with activation of IgA release in Peyer's patch cells.
The enhanced expression of Fas antigen is in line with the onset of activation-induced B-cell Ao.29 However, the mechanism underlying the induction of Fas antigen expression in this cell population during sepsis remains unknown. FasL has been shown to act as an inducer of its own receptor's expression19 in T lymphocytes whereby it acts to mediate lymphocyte activation-induced Ao.26,34,35 In this respect, we attempted to determine the contribution of FasL-Fas antigen interaction to the enhanced B220+ cell population Ao detected in septic mouse Peyer's patch cells obtained from C3H/HeN-FasLgld mice subjected to either sham-CLP or CLP 24 hours earlier. This mouse strain contains a point mutation that abolishes the capacity of FasL to bind Fas receptor/antigen.19,36 By using FasL-deficient C3H/HeJ-Faslgld mice it was found that CLP did not markedly enhance B-cell Ao in these animals' cells. These findings indicate that FasL regulates not only the upregulation of Fas antigen observed here but also the induction of Ao. However, the source of FasL that might control this mucosal B-cell process is less clear. B cells are not a typical source/producer of FasL,35 most likely ruling out autocrine mediation of the increased expression of Fas antigen in these cells. Alternatively, paracrine release of FasL by Peyer's patch T cells and/or nonlymphoid cells might mediate the increased expression of B-cell Fas in septic mice. In this respect, although T cells are a documented source of FasL,26,34,35 37 we did not detect increased Fas antigen/receptor expression on the T-helper cell population. This indirectly suggests that T-cell FasL expression/release is not markedly augmented in the Peyer's patch. This, however, remains to established by direct measurement of either cell surface FasL expression and/or its release.
Studies have also suggested that the stimulation of CD40 antigen on the surface of the B cell during activation acts to upregulate the expression of Fas antigen making the activated B cell more susceptible to FasL-mediated apoptotic cell death.13,14 Here again the B cell is not the primary source of CD40 ligand and the activated T cell appears to provide this stimulant.13 14 However, because the expression of CD40 antigen or CD40 ligand were not assessed it is unknown whether either of these costimulatory components are absent in the Peyer's patch cells from septic mice.
With respect to other mediators that might be implicated in the induction of Ao in polymicrobial septic mouse lymphocytes, studies by Zhang et al38 reported that thymic Ao could be induced by the exposure of mice to endotoxin, a component of the cell wall of gram-negative bacteria (that is also a polyclonal B-cell activator) commonly associated with systemic infection associated with sepsis. However, the dosage of lipopolysaccharide required to induce marked Ao was ≥ 50 μg/mouse (ip, 18 hours; equivalent to 2.5 mg/kg/body weight). This dose of LPS typically produces blood levels of endotoxin that are significantly higher then the circulating levels of this agent detected in septic patients.39-41 It should also be noted that the model of CLP used in this study induces the release of low levels of circulating endotoxin (range 0.07 to 5 ng/mL serum) detectable as early as 1 hour post-CLP, which steadily increases over the first 24 hours thereafter to a maximum of approximately 60 ng/mL serum.15,42,43 This model of sepsis is also polymicrobial in nature as it is associated with not only gram-negative but also gram-positive bacteria. Nonetheless, because studies have suggested the role of endotoxin in the induction of thymic Ao38,44 we examined the potential contribution of endotoxin in increasing Ao in Peyer's patch lymphocytes after sepsis.15,42,45,46 In this respect, the data we have presented here by using the endotoxin-resistant C3H/HeJ mouse strain16,17 show that the frequency of Ao is not only increased in 24-hour CLP mice when compared with sham, but is comparable to that observed in cells from septic endotoxin-sensitive C3H/HeN mouse strain. These results would imply that endotoxin is not a primary agent responsible for the induction of Ao in the Peyer's patch. Furthermore, this also implies that the presence of organisms not only of a gram-negative origin, but also gram-positive bacteria46 47 and/or fungal agents may be required to induce the enhanced Ao observed here.
The present results also show that polymicrobial sepsis and not the stress associated with trauma, in the form of the midline laparotomy, produces a marked increase in the frequency of Ao in Peyer's patch lymphocytes.
The degree to which other inflammatory mediators released during sepsis, such as cytokines like tumor necrosis factor, transforming growth factor-β, lymphokines, prostanoids, steroids, etc, play a role in the induction of mucosal B-cell Ao remains to be examined.
With respect to the functional significance of the enhanced Ao observed in the Peyer's patch B-lymphocytic population, this appears to be a reflection of an antigen-specific response to the influx of enteric antigens and not the response to nonspecific polyclonal mitogenic stimulation, such as might be mediated by endotoxin. This conclusion is based not only on our observation that Ao is still enhanced in septic endotoxin-tolerant mouse Peyer's patch cells but also on the ex vivo assessment of the nuclear factor footprint that is present in the cells obtained from the septic-mouse Peyer's patch. Neumann et al25 recently reported that the activation of individual members of the nuclear factor-κB (NF-κB) complex (eg, RelB and c-Rel) are differentially affected (with respect to their translocation to the nucleus and/or their transcription) by various B-cell stimuli. They reported that the translocation and transcription of RelB was markedly enhanced in cells that had been stimulated through the CD40 receptor as opposed to either the receptor for endotoxin (ie, lipopolysaccharide) or the Ig receptor of the B-cell receptor complex (which is evident but weak). Alternatively, stimulation through the Ig receptor of the B-cell receptor complex induced marked translocation of c-Rel to the nucleus, but only a weak activation/translocation when stimulated through the CD40 antigen and no marked translocation of c-Rel was observed with endotoxin. Such a footprint of NF-κB nuclear translocation48 may provide some insight into the nature of the stimulant responsible for the induction of IgA secretion in the septic mouse Peyer's patch cells and the associated increase in activation-induced Ao observed here. The results of the western immunoblot analysis of nuclear protein extracts obtained from these septic animals supports the suggestion that the B-cell activation observed here is most likely Ig receptor-mediated, hence a specific response to enteric antigens, and does not appear to be due to nonspecific polyclonal B-cell activation by agents like endotoxin. However, although we speculate here that such a relationship exists, direct linkage between increased B-cell IgA release, increased c-Rel translocation, and the eventual induction of Ao remains to be determined.
In summary, our findings indicate that mucosal B-cell Aoappears to be markedly increased by polymicrobial sepsis and that this appears to be the result of a FasL-mediated process. Evidence of antigen-specific polyclonal activation suggests the possible induction of B-cell Ao and eventual germinal center B-cell functional impairment.
ACKNOWLEDGMENT
We thank Dr Louis King at Michigan State University as well as Sally A. Johnson and Paul Monfils at the Central Research facilities at Rhode Island Hospital for their assistance with the flow cytometry.
Supported by grant No. R01-GM53209 from the National Institutes of Health, Bethesda, MD.
Address correspondence to Alfred Ayala, PhD, Center for Surgical Research, 211 Middle House, Rhode Island Hospital, 593 Eddy Street, Providence, RI 02903.
The publication costs of this article were defrayed in part by page charge payment. This article must therefore be hereby marked “advertisement” in accordance with 18 U.S.C. section 1734 solely to indicate this fact.





This feature is available to Subscribers Only
Sign In or Create an Account Close Modal