Abstract
The further improvement of gene transfer into hematopoietic stem cells and their direct progeny will be greatly facilitated by markers that allow rapid detection and efficient selection of successfully transduced cells. For this purpose, a retroviral vector was designed and tested encoding a recombinant version of the Aequorea victoria green fluorescent protein that is enhanced for high-level expression in mammalian cells (EGFP). Murine cell lines (NIH 3T3, Rat2) and bone marrow cells transduced with this retroviral vector demonstrated a stable green fluorescence signal readily detectable by flow cytometry. Functional analysis of the retrovirally transduced bone marrow cells showed EGFP expression in in vitro clonogenic progenitors (GM-CFU), day 13 colony-forming unit-spleen (CFU-S), and in peripheral blood cells and marrow repopulating cells of transplanted mice. In conjunction with fluorescence-activated cell sorting (FACS) techniques EGFP expression could be used as a marker to select for greater than 95% pure populations of transduced cells and to phenotypically define the transduced cells using antibodies directed against specific cell-surface antigens. Detrimental effects of EGFP expression were not observed: fluorescence intensity appeared to be stable and hematopoietic cell growth was not impaired. The data show the feasibility of using EGFP as a convenient and rapid reporter to monitor retroviral-mediated gene transfer and expression in hematopoietic cells, to select for the genetically modified cells, and to track these cells and their progeny both in vitro and in vivo.
RETROVIRAL VECTORS based on the Moloney murine leukemia virus (MoMLV) backbone are widely studied as vehicles for gene transfer into hematopoietic cells based on their potential for highly efficient transduction and integration in the host genomic DNA.1-6 Significant restrictions of these vectors are the dependence on cell division for successful integration7,8 and an inconsistent expression level of vector-encoded proteins in target cells.9,10 These issues are currently addressed in retroviral-mediated gene transfer procedures for hematopoietic stem cells, a small population of predominantly noncycling cells.11 12 However, determination of transduction efficiency and expression in these cells has been difficult and relied mostly on studying the presence of the transgene in more differentiated cell types after outgrowth in in vitro cell culture assays or in vivo repopulating assays. Therefore, an important tool to improve gene transfer procedures is the availability of markers that allow rapid detection of the transferred gene in immature hematopoietic cells and enrichment of the transduced cell populations.
Retroviral vectors encoding selectable reporter molecules have been used to study the efficiency of transduction in immature hematopoietic cells and the long-term presence of the transgene in their progeny after transplantation in recipient animals. The encouraging results obtained for murine hematopoietic stem cells13-15 have stimulated the use of recombinant retroviruses for the genetic modification of the corresponding cells of larger animals. However, comparably high transduction efficiencies of long-term repopulating cells of canine, rhesus monkey, or human origin have not been achieved yet.16-18 Nevertheless, the neomycin phosphotransferase gene (neo) has proven to be particularly useful in tracking retrovirally transduced human hematopoietic cells both in vitro and in vivo, and in the identification of cells capable of causing leukemic relapse after autologous bone marrow (BM) transplantation.19-21 For the enrichment of immature and transduced hematopoietic cells this marker gene is less suitable, mostly because a selective advantage is only obtained after time-consuming exposure to toxic drug concentrations under in vitro culture conditions that stimulate cell division and terminal differentiation. The bacterial β-galactosidase gene (lacZ) has also been used as a selectable reporter molecule for hematopoietic cells,22-25 but the relatively high endogenous β-galactosidase activity in some cell types and the requirement for transporting fluorogenic substrates across the cell membrane while maintaining cell viability have limited its application.
Recently, several groups have independently studied transduction of hematopoietic cells with retroviral vectors encoding marker molecules expressed at the cell surface, thus allowing for the direct identification of transduced cells with specific antibodies.26-29 These studies included the successful transduction of CD4+ and CD8+ T lymphocytes with the gene for the human low-affinity nerve growth factor receptor29 and transduction of human CD34+CD38+ and the more immature CD34+ CD38low BM cells by a retroviral vector encoding the murine heat-stable antigen.27 Such approaches offer as potential advantages the rapid study of a variety of parameters on gene transfer efficiency of immature hematopoietic cells. Prerequisites for this type of procedure evidently are the absence or low-level expression of the reporter molecule in the target cells and the availability of antibodies specific for the marker.
The green fluorescent protein (GFP) of the jellyfish Aequorea victoria has recently been introduced as a promising reporter for monitoring gene transfer and expression in eukaryotic cells.30 Purified wildtype GFP emits green light after illumination with UV light.31-33 Except for the presence of oxygen and excitation with blue light, it requires no further exogenous molecules to fluoresce and, therefore, appears to be superior to other markers used for the selection of viable cells thus far. However, because wildtype GFP has only a minor absorption maximum at 470 nm it produces only a relatively weak green fluorescence signal when excited by a standard fluorescence-activated cell sorter (FACS) or a fluorescence microscope. Several GFP variants have been created with maximum excitation peaks at 490 nm which are better suited for detection of expression by these methods.34-37 Recently, the generation of stable producer cell lines for retroviral vectors encoding GFP variants has been independently reported by a number of groups and the powerful potential of GFP as a selectable marker of retroviral-mediated gene transfer was demonstrated in murine and human cell lines.38-41 In a direct comparison of the relative fluorescence intensities of retroviral vectors encoding distinct GFP variants we showed by FACS analysis that EGFP, a GFP variant enhanced for high-level expression in mammalian cells, provided the highest fluorescence intensity in murine fibroblasts.41 The present study was directed at the use of EGFP for the identification and selection of retrovirally transduced primary murine BM cells and tracking their progeny after transplantation in recipient mice.
MATERIALS AND METHODS
Animals and cells. Animals used in these experiments were bred in the Central Animal Department of the Erasmus University (Rotterdam, The Netherlands) and maintained under specific pathogen-free conditions. For retroviral transduction experiments, BM cells were used from 8-week-old female (C57BL × CBA)F1 hybrid (BCBA) mice. Mice used as recipients in the colony-forming unit-spleen (CFU-S)/marrow repopulating ability (MRA) assays were ≥12-week-old female BCBA mice. Murine BM cells were prepared by flushing femora with an enriched version of Dulbecco's modified Eagle's medium (DMEM; GIBCO, Gaithersburg, MD). The DMEM used for this study was enriched with L-alanine (25 mg/L), L-asparagine (50 mg/L), L-aspartic acid (30 mg/L), L-cysteine (70 mg/L), L-glutamic acid (75 mg/L), L-proline (40 mg/L), sodium pyruvate (110 mg/L), vitamin B12 (25 μg/L), and biotin (30 μg/L) (all from Sigma, St Louis, MO). Murine BM cells were cultured in this enriched DMEM further supplemented with 1% (wt/vol) BSA (Fraction V; Sigma), 0.3 mg/mL human transferrin, 0.1 μmol/L sodium selenite, 1 mg/L nucleosides (cytidine, adenosine, uridine, guanosine, 2′-deoxycytidine, 2′-deoxyadenosine, thymidine, and 2′-deoxyguanosine; Sigma), 0.1 mmol/L β-mercaptoethanol, 15 μmol/L linoleic acid, 15 μmol/L cholesterol, 1 μmol/L hydrocortison, and 1 μmol/L isoprotenol.42-44 The ecotropic and amphotropic packaging cell lines GP+E-8645 and GP+envAm12,46 respectively, as well as Rat247 and NIH 3T3 fibroblasts were cultured in DMEM supplemented with 10% (vol/vol) newborn calf serum. Media for all cultures routinely included 100 U/mL of penicillin and 100 μg/mL of streptomycin. The cultures were maintained at 37°C with 10% CO2 /90% air in a humidified atmosphere.
Retroviral vectors. For all experiments, retrovirus was used derived from the MFG retroviral vector48 provided by Dr R.C. Mulligan (Whitehead Institute for Biomedical Research, Cambridge, MA). To construct MFG-EGFP, a 726-bp fragment encoding EGFP was inserted into the Nco I/BamHI sites of MFG using standard procedures. The EGFP-specific fragment was generated by polymerase chain reaction (PCR) using two synthetic oligonucleotides (Pharmacia, Uppsala, Sweden) as primers and pEGFP-C1 (Clontech Laboratories Inc, Palo Alto, CA) as template. The 5′-primer, 5′-TTTAAGCTTGCCACCATGGTGAGCAAGGGCGAG-3′, corresponds to nucleotides 607 to 630 of pEGFP-C1 and contains the start codon embedded into an Nco I site. The 3′-primer, 5′-TTTGGATCCTTACTTGTACAGCTCGTCCATGCC-3′, corresponds to nucleotides 1309 to 1330 of pEGFP-C1 and contains downstream of the termination codon a BamHI site. In this way, EGFP expression is controlled by the MoMLV long terminal repeat (LTR) with its start codon placed exactly at the position of the MoMLV envelope ATG.48
Retrovirus production. GP+E-86 ecotropic retroviral packaging cells were cotransfected with both the MFG-EGFP vector and pSV2neo using calcium phosphate precipitation, and subsequently cultured in the presence of G418 (500 μg/mL of active drug) to select for a polyclonal population of stable transfected cells. Cells displaying the brightest green fluorescence were cloned by single-cell FACS selection and expanded. The viral titer of the clonal ecotropic MFG-EGFP producer (eMFG-EGFP) used for this study was in the order of 105 infectious particles per milliliter as assessed by the transfer of EGFP expression to NIH 3T3 fibroblasts. Clonal amphotropic retroviral producer cell lines were obtained by transduction of GP+envAm12 cells with supernatants containing ecotropic retrovirus followed by single-cell FACS selection on the basis of green fluorescence expression as mentioned above. The viral titer of the clonal amphotropic MFG-EGFP producer (aMFG-EGFP) used for this study was in the order of 106 infectious particles per milliliter. Absence of replication-competent virus was verified by failure to transfer green fluorescence protein expression from a transduced cell population to NIH 3T3 fibroblasts.
RNA blot analysis. Total RNA was purified from the aMFG-EGFP producer cell line and, as a control, GP+envAm12 cells as described49 and resolved by 2.2 mol/L formaldehyde/1.2% agarose gel electrophoresis. After blotting to a nylon membrane, RNAs were visualized by hybridization with a 32P-labeled EGFP-specific cDNA.
Retroviral transduction of cell lines and BM cells. Supernatants containing recombinant retrovirus were generated by culturing approximately 80% confluent producer cells for 16 to 24 hours in the appropriate culture medium. The culture supernatant was subsequently procured and passed through a 0.45-μm filter. For transduction of Rat2 and NIH 3T3 fibroblasts supernatants containing aMFG-EGFP retrovirus were supplemented with hexadimethrine bromide at 4 μg/mL (Sigma) and layered onto subconfluent cell monolayers. The next day, the cells were fed fresh culture medium and culture was continued for at least 24 hours before analysis by flow cytometry.
Falcon 1008 (35-mm) bacteriological culture dishes were coated with the recombinant fibronectin fragment CH-296 (Takara Shuzo, Otsu, Japan) at a concentration of 10 μg/cm2 as described previously.50 Murine BM cells were prestimulated for 2 days in their appropriate culture medium, as mentioned above, supplemented with 10 ng/mL human interleukin-6 (hIL-6; Ares-Serono, Geneva, Switzerland), 10 ng/mL murine IL-3 (mIL-3; Research & Development, Minneapolis, MN), and 100 ng/mL murine stem cell factor (mSCF; Immunex, Seattle, WA) at a starting cell concentration of 5 × 10⁵ nucleated cells/mL. Before adding BM cells to the fibronectin-coated dishes, the CH-296 was preincubated with supernatant containing the ecotropic or amphotropic MFG-EGFP vector for 1 hour at 37°C.51 52 Subsequently, nucleated cells were resuspended at 0.5 to 2.0 × 10⁶/mL in vector-containing supernatant supplemented with hIL-6, mIL-3, and mSCF, and added to the dishes. Over a period of 2 days retrovirus supernatant was changed an additional four times, each time resuspending nonadherent cells into fresh retrovirus supernatant. Mock transductions were standard and similarly performed with supernatants of the corresponding packaging cell lines GP+E-86 or GP+envAm12. Finally, the cells were procured and used for FACS analysis/sorting, and in vitro clonogenic progenitor, CFU-S, and MRA assays.
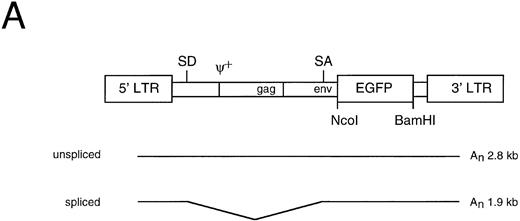
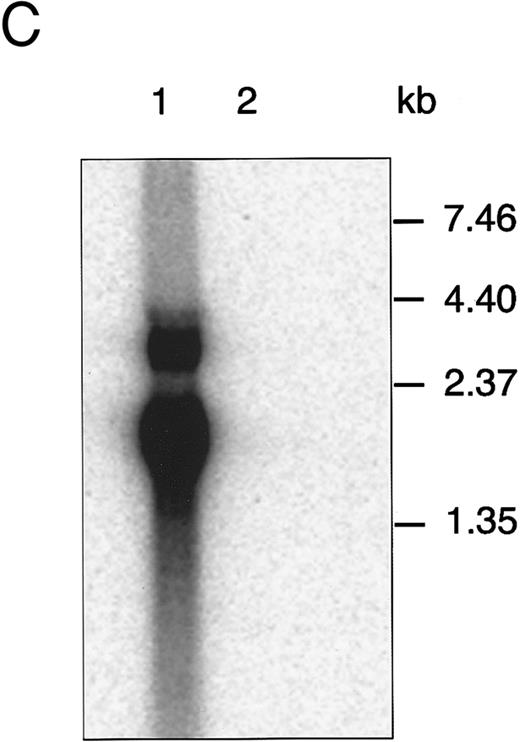
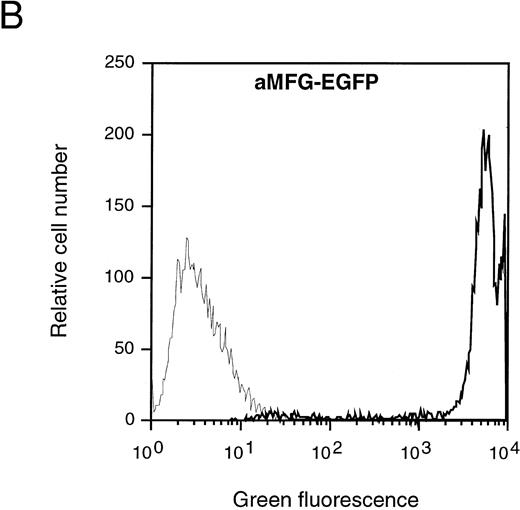
Characterization of the aMFG-EGFP retroviral producer cell line. (A) Schematic representation of the MFG-EGFP retroviral vector. LTR, long terminal repeat; ψ, viral packaging signal; SD and SA, splice donor and acceptor sites, respectively; gag and env indicate the presence of part of the MoMLV gag and env sequences. The predicted sizes of the two expected RNA isoforms are indicated. (B) FACS analysis of EGFP expression; the corresponding profile of the packaging cell line GP+envAm12 (thin line) is overlaid for comparison. (C) Northern blot analysis of aMFG-EGFP RNA. Total RNA (25 μg) from producer cells (lane 1) and GP+envAm12 (lane 2) was resolved by electrophoresis, blotted to a nylon membrane, and hybridized with a probe specific for EGFP.
Characterization of the aMFG-EGFP retroviral producer cell line. (A) Schematic representation of the MFG-EGFP retroviral vector. LTR, long terminal repeat; ψ, viral packaging signal; SD and SA, splice donor and acceptor sites, respectively; gag and env indicate the presence of part of the MoMLV gag and env sequences. The predicted sizes of the two expected RNA isoforms are indicated. (B) FACS analysis of EGFP expression; the corresponding profile of the packaging cell line GP+envAm12 (thin line) is overlaid for comparison. (C) Northern blot analysis of aMFG-EGFP RNA. Total RNA (25 μg) from producer cells (lane 1) and GP+envAm12 (lane 2) was resolved by electrophoresis, blotted to a nylon membrane, and hybridized with a probe specific for EGFP.
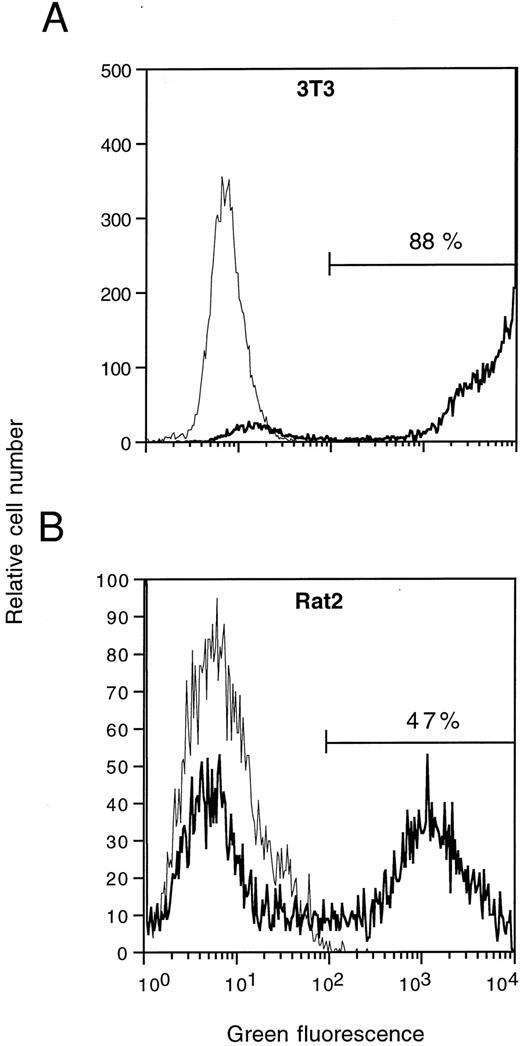
Flow cytometric analysis of EGFP expression in NIH 3T3 (A) and Rat2 (B) cells transduced with aMFG-EGFP retroviral-containing supernatant. The corresponding profiles for cells mock-transduced with GP+envAm12-derived supernatant (thin lines) are overlaid for comparison. Percentages of cells positive for EGFP expression are indicated.
Flow cytometric analysis of EGFP expression in NIH 3T3 (A) and Rat2 (B) cells transduced with aMFG-EGFP retroviral-containing supernatant. The corresponding profiles for cells mock-transduced with GP+envAm12-derived supernatant (thin lines) are overlaid for comparison. Percentages of cells positive for EGFP expression are indicated.
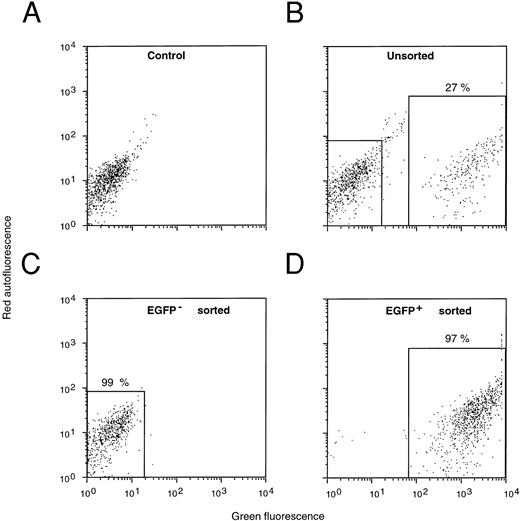
FACS selection of MFG-EGFP-transduced murine BM cells. Dot-plot profiles of mock-transduced (A), MFG-EGFP-transduced total BM cells (B), FACS sorted EGFP-negative (C), and EGFP-positive cells (D) are shown. The number of events obtained in the FL2 emission channel (= red autofluorescence) is plotted versus the number obtained in the FL1 channel (= green fluorescence). Percentages of cells in the sort windows are indicated. Cells from each of these fractions were used for in vitro clonogenic progenitor (GM-CFU) and day 13 CFU-S assays and individual colonies were analyzed for EGFP expression by FACS (Table 1).
FACS selection of MFG-EGFP-transduced murine BM cells. Dot-plot profiles of mock-transduced (A), MFG-EGFP-transduced total BM cells (B), FACS sorted EGFP-negative (C), and EGFP-positive cells (D) are shown. The number of events obtained in the FL2 emission channel (= red autofluorescence) is plotted versus the number obtained in the FL1 channel (= green fluorescence). Percentages of cells in the sort windows are indicated. Cells from each of these fractions were used for in vitro clonogenic progenitor (GM-CFU) and day 13 CFU-S assays and individual colonies were analyzed for EGFP expression by FACS (Table 1).
EGFP Expression in Individual GM-CFU Methylcellulose Colonies and Day 13 CFU-S Derived From Mock, Unsorted, EGFP-Negative, and EGFP-Positive Sorted Murine BM Cells After Retroviral Transduction
| Cells . | No. EGFP-Positive GM-CFU/Total No. GM-CFU Analyzed (%) . | No. EGFP-Positive CFU-S/Total No. CFU-S Analyzed* (%) . | ||
|---|---|---|---|---|
| . | . | . | . | . |
| Total mock | 0/39 | (0) | 0/30 | (0) |
| Total EGFP | 29/73 | (40) | 38/50 | (76) |
| EGFP-negative sorted | 1/19 | (5) | 5/20 | (25) |
| EGFP-positive sorted | 24/25 | (96) | 17/20 | (85) |
Individual GM-CFU or day 13 CFU-S derived from the appropriate marrow fractions were isolated and analyzed for EGFP expression by flow cytometry as described in Materials and Methods. The cumulative results for four (GM-CFU) or two (CFU-S) independent experiments are shown.
A CFU-S was determined to be EGFP-positive if >10% of the resuspended cells displayed a distinct green fluorescent signal.
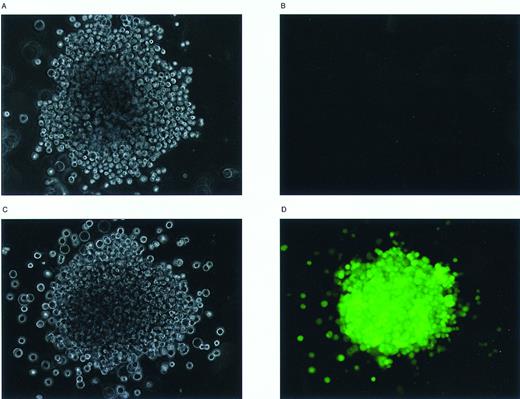
Examination of EGFP expression in individual GM-CFU methylcellulose colonies by inverted fluorescence microscopy. Murine BM cells were transduced with the MFG-EGFP retroviral vector and subsequently analyzed for the presence of in vitro clonogenic progenitor cells. Individual GM-CFU were then examined with an Olympus IX70 inverted fluorescence microscope. Phase-contrast (A, C) and fluorescence micrographs (B, D) were prepared of an EGFP-negative (A, B) and an EGFP-positive GM-CFU (C, D); original magnification × 100.
Examination of EGFP expression in individual GM-CFU methylcellulose colonies by inverted fluorescence microscopy. Murine BM cells were transduced with the MFG-EGFP retroviral vector and subsequently analyzed for the presence of in vitro clonogenic progenitor cells. Individual GM-CFU were then examined with an Olympus IX70 inverted fluorescence microscope. Phase-contrast (A, C) and fluorescence micrographs (B, D) were prepared of an EGFP-negative (A, B) and an EGFP-positive GM-CFU (C, D); original magnification × 100.
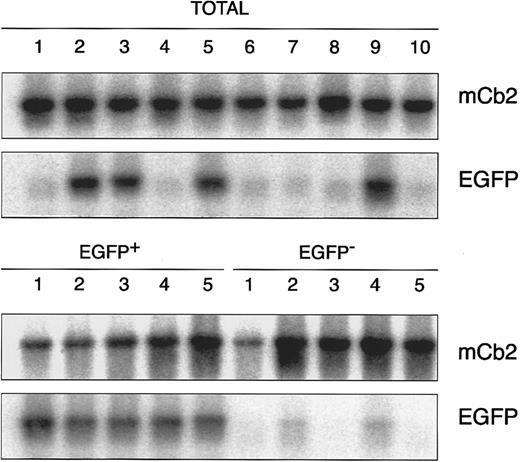
Demonstration of proviral integration analysis of in vitro clonogenic progenitor cells derived from retrovirally transduced murine BM cells. Individual colonies were isolated from methylcellulose cultures containing total EGFP-transduced BM cells, FACS-sorted EGFP-negative or EGFP-positive cells, and analyzed by PCR using primers specific for EGFP (EGFP). As a positive control for PCR, primers specific for the murine peripheral cannabinoid receptor (mCb2) were used.58
Demonstration of proviral integration analysis of in vitro clonogenic progenitor cells derived from retrovirally transduced murine BM cells. Individual colonies were isolated from methylcellulose cultures containing total EGFP-transduced BM cells, FACS-sorted EGFP-negative or EGFP-positive cells, and analyzed by PCR using primers specific for EGFP (EGFP). As a positive control for PCR, primers specific for the murine peripheral cannabinoid receptor (mCb2) were used.58
Flow cytometry. Cell samples were analyzed/sorted using a FACScan flow cytometer, a FACSCalibur, or a FACS Vantage cell sorter (Becton Dickinson, San Jose, CA). Green fluorescence was measured through a 530-nm/30-nm bandpass filter after illumination with the 488-nm line of an argon ion laser. Dead cells were excluded from analysis based on propidium iodine (Sigma) or Hoechst 33258 (Molecular Probes, Eugene, OR) staining. Immunophenotyping of EGFP- and mock-transduced BM cells was performed by staining with two rat monoclonal antibodies (MoAbs), ER-MP20 (Ly-6C) and ER-MP12, which recognize distinct subsets within the murine hematopoietic cell compartment.53-55 Unlabeled ER-MP20 (hybridoma culture supernatant) and biotinylated ER-MP12 rat MoAbs were kindly provided by Dr M. de Bruijn (Department of Immunology, Erasmus University Rotterdam, The Netherlands). Cells were sequentially stained with unlabeled ER-MP20, Cyanine-5 conjugated goat-antirat antibodies (GaR-Cy5; Amersham, Buckinghamshire, UK), biotinylated ER-MP12, and Tricolor-conjugated streptavidin (SA-Tricolor; Caltag, San Francisco, CA). All incubations were performed in Hanks' Balanced Salt Solution, supplemented with 2% (wt/vol) bovine serum albumin, 0.05% (wt/vol) sodium azide, and 2% (vol/vol) heat-inactivated mouse serum. During the second incubation step, 2% (vol/vol) goat serum was added to block nonspecific binding, and before the third incubation, cells were incubated with 4% (vol/vol) rat serum to block residual binding sites on the GaR-Cy5 antibodies. Spillover of EGFP fluorescence in the FL3 channel and of Tricolor in the FL4 channel were electronically compensated using appropriately stained control samples.
In vitro clonogenic progenitor assays. Murine BM cells were plated at appropriate numbers in Falcon 1008 (35-mm) bacteriological culture dishes in 1 mL of semisolid methylcellulose culture medium containing 0.8% (wt/vol) methylcellulose (Methocel A4M Premium grade; Dow Chemical Co, Barendrecht, The Netherlands) in enriched DMEM, 1% (wt/vol) BSA, 0.3 mg/mL human transferrin, 0.1 μmol/L sodium selenite, 1 mg/L nucleosides (as above), 0.1 mmol/L β-mercaptoethanol, 15 μmol/L linoleic acid, 15 μmol/L cholesterol, 10 μg/mL insulin, 100 U/mL penicillin, and 100 μg/ml streptomycin.42,56 Granulocyte/macrophage colony formation (GM-CFU) was stimulated by 10 ng/mL mIL-3, 100 ng/mL mSCF, and M-CSF purified from pregnant mouse uteri extract essentially as described before.56 GM-CFUs were scored at day 8 to 10 of culture, individually isolated, and analyzed by FACS and/or PCR. BFU-E growth was induced by 100 ng/mL mSCF and 4 U/mL human erythropoietin (hEPO; Behringwerke, Marburg, Germany) in the presence of 2 × 10⁻⁴ mol/L hemin (bovine, type I; Sigma), whereas CFU-E growth was stimulated similarly with hEPO alone. CFU-E colonies were counted after 2 days and BFU-E colonies after 8 to 10 days of culture. Megakaryocyte progenitor cells (CFU-Meg) were stimulated in 0.375% agar cultures supplemented with 100 ng/mL mSCF, 10 ng/mL mIL-3, and 10 ng/mL murine thrombopoietin (mTPO; Genentech Inc, San Francisco, CA). Colonies were dried after 10 days, stained for acetylcholinesterase positive cells, and counted.57 All cultures were grown in duplicate and maintained at 37°C with 10% CO2 /90% air in a humidified atmosphere.
CFU-S assay. Lethally irradiated recipient female BCBA mice (8.5 Gy, 137Cs γ-rays) were injected intravenously with 0.75 × 10⁴, 1.25 × 10⁴, 1.5 × 10⁴, or 2.5 × 10⁴ eMFG-EGFP-transduced BM cells. As a control, irradiated mice were injected with BM cells treated similarly with supernatant of the ecotropic packaging cell line GP+E-86. Thirteen days later, mice were killed and total spleen and individual macroscopic spleen colonies were dissected and resuspended for flow cytometric analysis and in vitro clonogenic progenitor assays.
MRA assay. Lethally irradiated recipient female BCBA mice (8.5 Gy, 137Cs γ-rays) were injected intravenously with 1 × 10⁵ eMFG-EGFP-transduced BM cells or, as a control, with BM cells treated similarly with supernatant of the ecotropic packaging cell line GP+E-86. At day 13, the animals were killed and both the peripheral blood and femoral marrow content were analyzed by flow cytometry. The femoral marrow was assayed for the presence of in vitro clonogenic progenitors (GM-CFU) as mentioned above.
Amplification of genomic DNA sequences. Individually isolated colonies were disrupted by boiling and subsequently lysed for 1 hour at 56°C in Taq polymerase buffer (ie, 50 mmol/L KCl, 1.5 mmol/L MgCl2 , and 10 mmol/L Tris-HCl, pH 9.0) supplemented with 0.1% gelatine, 0.5% NP40, 0.5% Tween 20, 4.3 μg/mL proteinase K, and 24 μg/mL RNAse A. After denaturation by boiling, genomic DNA sequences specific for EGFP and, as a positive control, the murine cannabinoid receptor (mCb2) were amplified by PCR.58 The PCR reactions were performed with Taq polymerase buffer supplemented with 0.1% gelatine, 200 μmol/L dNTPs, 1 μmol/L primers, and 2.5 U of Taq polymerase under the following conditions: initial denaturation at 94°C for 5 minutes; followed by 40 cycles of denaturation (1 minute at 94°C), annealing (1 minute at 58°C for mCb2 or at 64°C for EGFP) and polymerization (1 minute at 72°C). The primer sequences used to amplify a 709-bp fragment of the mCb2 gene were 5′-AGCGTGATCTTCGCCTGCAA-3′ and 5′-CTTCTTCCAGCCTATCAGGC-3′. Similarly, the primer sequences used to amplify a 468-bp fragment of the EGFP gene consisted of 5′-GAAGTTCATCTGCACCACCGGCAA-3′ and 5′-TAGTGGTTGTCGGGCAGCAGCACG-3′. The amplified products were purified by phenol/chloroform extraction and ethanol precipitation, resolved by 1% agarose gel electrophoresis, and analyzed by Southern blotting/hybridization using specific 32P-labeled cDNA probes according to standard procedures.59
RESULTS
Generation of the MFG-EGFP retroviral producer cells. A retroviral vector was constructed in which the complete coding sequence of EGFP was placed under transcriptional control of the MoMLV LTR in the MFG retroviral backbone (Fig 1A). This MFG-EGFP plasmid was used to generate polyclonal cell populations of the ecotropic and amphotropic retroviral producer cell lines GP+E-86 and GP+envAm12, respectively, as described earlier.41 Cells displaying the brightest green fluorescence were single-cell selected by FACS and expanded. Ecotropic (eMFG-EGFP) and amphotropic (aMFG-EGFP) clonal producer cell lines were thus established and characterized by flow cytometry and Northern blot analysis. As is shown in Fig 1B for aMFG-EGFP, over 95% of the viable cells displayed a bright green fluorescence upon excitation at 488 nm in the flow cytometer. Northern blot analysis of total RNA isolated from this cell line showed the presence of the predicted 1.9- and 2.8-kb RNA transcripts (Fig 1C). The eMFG-EGFP and aMFG-EGFP cell lines were producing recombinant retrovirus at titers of 105 and 106 infectious particles per milliliter, respectively, as assessed by EGFP gene transfer to NIH 3T3 cells. These retroviral producer cell lines have been cultured for at least 2 months without loss of this phenotype, indicating the stability and the absence of any detrimental effects of EGFP expression. The data show that selective cell sorting on the basis of EGFP expression can be applied for the isolation of stable and recombinant retrovirus producing cell clones.
To explore the potential of EGFP as a marker for monitoring gene transfer and expression in murine cells, we transduced both NIH 3T3 and Rat2 fibroblasts with supernatants from aMFG-EGFP. FACS analysis of viable transduced cells showed EGFP expression in 88% of the NIH 3T3 and 47% of the Rat2 cells under the conditions used (Fig 2), indicating the feasibility of detecting gene transfer efficiencies on the basis of EGFP expression.
Transduction and selection of primary murine BM cells. Normal murine BM cells were prestimulated with hIL-6, mIL-3, and mSCF for 2 days and subsequently transduced by a recombinant fibronectin-mediated supernatant transduction procedure in the presence of the same growth factors. Bacteriological culture dishes were coated with fibronectin fragment CH-296 and preloaded with retroviral vector before the addition of hematopoietic progenitor cells and fresh retroviral supernatant. Over a period of 2 days new retroviral supernatant was added four times. Subsequently, the cells were recovered from the dishes and analyzed directly by FACS. The transduction efficiencies obtained with this procedure ranged from 17% to 38% of the viable nucleated BM cells (four independent experiments). Sorting of the BM cells on the basis of EGFP expression showed that the transduced cells displayed a strong green fluorescent signal, well separated from the EGFP-negative cells (Fig 3B v Fig 3A). The BM cells could be FACS sorted into greater than 95% EGFP-negative and EGFP-positive cell populations (Fig 3C and D, respectively). Each cell fraction was evaluated for the presence of in vitro clonogenic progenitor cells in defined methylcellulose cultures; individual colonies were isolated and assayed for EGFP expression by flow cytometry (Table 1), fluorescence microscopy (Fig 4), or for proviral integration by PCR (Fig 5).
EGFP-positive in vitro clonogenic progenitor cells could not be recovered from the total mock transduced BM cells, whereas only 1 of 19 GM-CFU recovered from the EGFP-negative sorted cell population proved to be EGFP-positive by FACS (Table 1). Approximately 40% of the in vitro clonogenic progenitors present in the total EGFP-transduced cells displayed EGFP expression (cumulative results of four independent experiments), whereas greater than 95% of those from the EGFP-positive sorted cells proved to be positive by flow cytometric analysis. For further illustration of EGFP expression in in vitro clonogenic progenitor cells, fluorescence micrographs of an EGFP-negative and an EGFP-positive GM-CFU are shown in Fig 4. Similar results were obtained when individual colonies derived from the different fractions were analyzed for the presence of the provirus (Fig 5). The almost exclusive presence of the MFG-EGFP provirus in the EGFP-positive sorted in vitro clonogenic progenitors is most likely the result of the relatively high fluorescence intensity differences between the EGFP-negative and EGFP-positive cells and the stringent sorting windows chosen. These results show that it is possible to enrich for retrovirally transduced in vitro clonogenic progenitors on the basis of EGFP expression. Moreover, EGFP expression remained stable without any selective pressure during methylcellulose cultures.
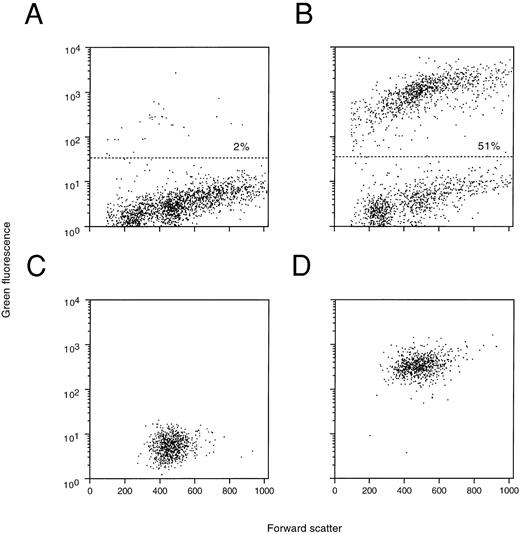
EGFP expression in CFU-S and marrow-repopulating cells. To evaluate the presence and expression of the MFG-EGFP retroviral vector in CFU-S and marrow repopulating cells, murine BM cells were transduced with the eMFG-EGFP retroviral vector and injected into lethally irradiated recipients. For analysis of EGFP expression, individual spleen colonies were dissected at day 13 posttransplantation and analyzed by flow cytometry. Examples of the fluorescence profiles of EGFP-negative and EGFP-positive CFU-S colonies are shown in Fig 6A and B, respectively. Whereas none of the 30 individual spleen colonies analyzed for the mock transduction provided for a positive green fluorescence signal, 38 of the 50 spleen colonies (76%) derived from mice injected with total MFG-EGFP–transduced BM cells displayed EGFP expression in over 10% of the resuspended cells (Table 1). This number of EGFP-positive colonies increased to 85% (17/20) when the CFU-S were derived from mice injected with EGFP-positive selected BM cells. In contrast, only 5 of 20 CFU-S (25%) proved to be positive when EGFP-negative sorted BM cells were used as the donor cells.
Demonstration of EGFP expression in individual isolated spleen colonies and GM-CFU derived thereof. Mice were injected with MFG-EGFP–transduced murine BM cells and 13 days later individual spleen colonies were dissected. The viable cells were analyzed by flow cytometry and cultured in standard colony assays for the presence of in vitro clonogenic progenitor cells. Examples are shown of an EGFP-negative (A) and EGFP-positive (B) spleen colony as well as a representative GM-CFU derived from these colonies (C and D, respectively). Percentages of cells positive for EGFP expression are indicated.
Demonstration of EGFP expression in individual isolated spleen colonies and GM-CFU derived thereof. Mice were injected with MFG-EGFP–transduced murine BM cells and 13 days later individual spleen colonies were dissected. The viable cells were analyzed by flow cytometry and cultured in standard colony assays for the presence of in vitro clonogenic progenitor cells. Examples are shown of an EGFP-negative (A) and EGFP-positive (B) spleen colony as well as a representative GM-CFU derived from these colonies (C and D, respectively). Percentages of cells positive for EGFP expression are indicated.
An individual control, EGFP-negative and EGFP-positive CFU-S colony were assayed for EGFP expression in secondary GM-CFU. As determined by FACS analysis, EGFP-positive secondary in vitro clonogenic progenitor cells could only be detected in the EGFP-positive spleen colony, but not in the control or EGFP-negative spleen colony. Examples of an EGFP-negative and EGFP-positive GM-CFU are shown in Fig 6C and Fig D, respectively. These results indicate that EGFP expression remained stable during the in vivo generation of CFU-S and the following secondary in vitro clonogenic progenitor assays.
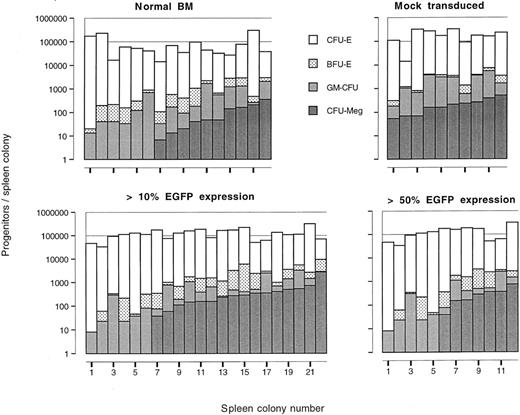
The influence of EGFP expression on the outgrowth and differentiation potential of immature hematopoietic cells, present in the dissected spleen colonies, was evaluated by enumeration of progenitor cells along the granulocyte/macrophage, erythroid, and megakaryocyte lineages. As shown in Fig 7, individual spleen colonies which expressed EGFP in greater than 10% of the cells, or more stringently, in greater than 50% of the cells, contained 104 to 105 progenitor cells which was similar to the number obtained with mock-transduced or primary BM derived spleen colonies. The distribution of progenitor cells in individual spleen colonies was also not significantly different (Fisher's exact test) in the four groups examined. These data show that expression of EGFP does not impair multilineage outgrowth of immature hematopoietic cells.
Distribution of erythroid, granulocyte/macrophage, and megakaryocytic progenitor cells in individual dissected spleen colonies derived from primary normal BM cells, total mock-transduced, and total MFG-EGFP–transduced BM cells. For the mock transduction of BM cells supernatant derived from the corresponding packaging cell line was used.
Distribution of erythroid, granulocyte/macrophage, and megakaryocytic progenitor cells in individual dissected spleen colonies derived from primary normal BM cells, total mock-transduced, and total MFG-EGFP–transduced BM cells. For the mock transduction of BM cells supernatant derived from the corresponding packaging cell line was used.
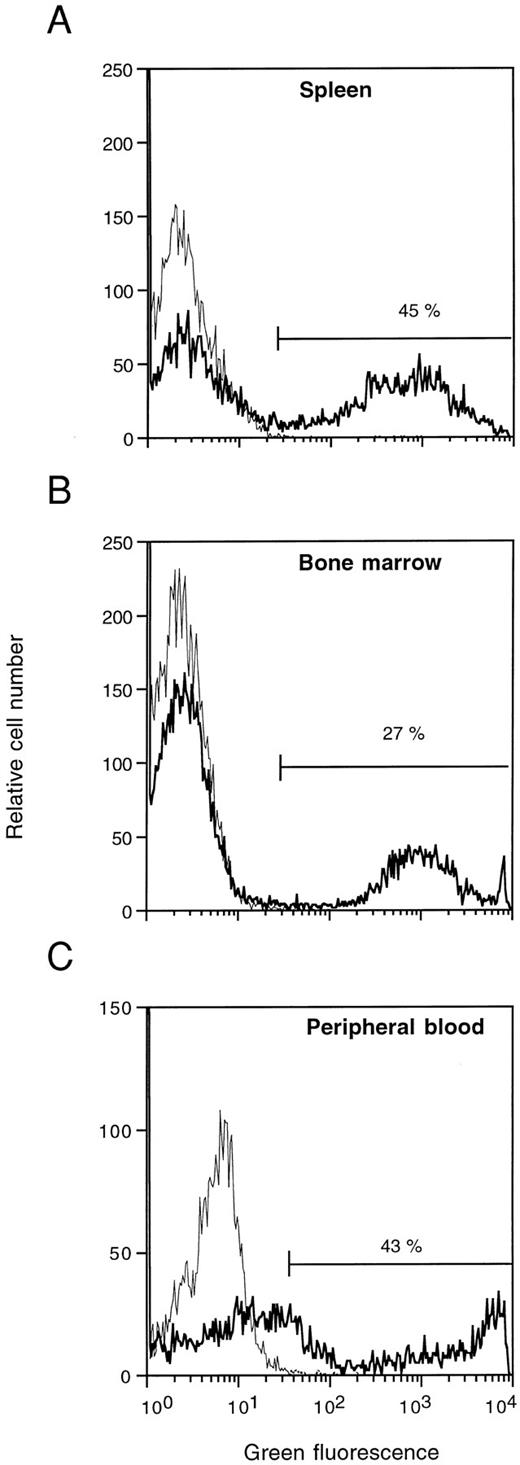
Total spleen, BM, and peripheral blood of lethally irradiated recipient BCBA mice were also studied on day 13 posttransplantation for the presence of EGFP expression. As is shown in Fig 8 for one representative animal, FACS analysis revealed EGFP expression in 45% of the spleen cells (Fig 8A), 27% of femoral BM cells (Fig 8B), and 43% of peripheral blood cells (Fig 8C), whereas the corresponding cells derived from control animals were negative. A bright green fluorescent signal was detected in 30% to 55% of the peripheral blood nucleated cells of 6 out of 6 animals studied in this way. Moreover, EGFP expression was also observed in secondary GM-CFU derived from the BM in contrast to those isolated similarly from control BM (results not shown). Taken together, these results show that EGFP is expressed in readily detectable frequencies in day 13 CFU-S, circulating blood cells, BM cells, and in secondary clonogenic progenitors recovered from the CFU-S colonies and BM.
Flow cytometric analysis of EGFP expression 13 days posttransplantation in the spleen (A), BM (B), and peripheral blood (C) of mice injected with mock-transduced (thin lines) or MFG-EGFP–transduced murine BM cells. The results for one representative animal are shown. Percentages of cells positive for EGFP expression are indicated.
Flow cytometric analysis of EGFP expression 13 days posttransplantation in the spleen (A), BM (B), and peripheral blood (C) of mice injected with mock-transduced (thin lines) or MFG-EGFP–transduced murine BM cells. The results for one representative animal are shown. Percentages of cells positive for EGFP expression are indicated.
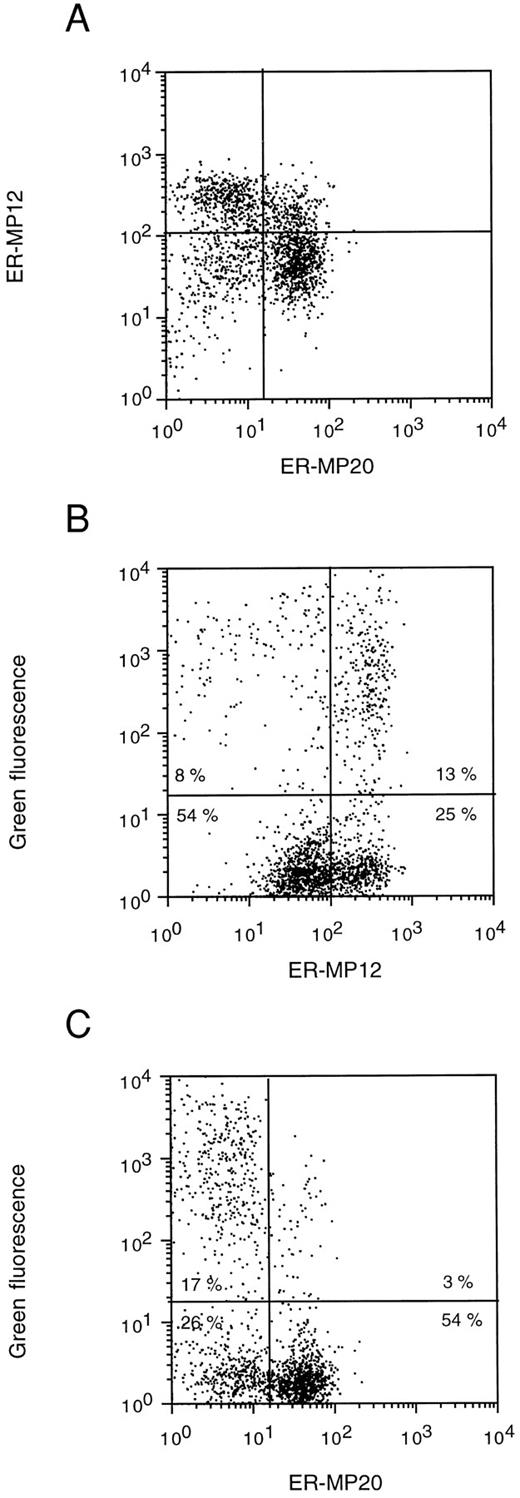
Immunophenotyping of retrovirally transduced BM cells. To examine the transduction efficiency in different hematopoietic subsets, EGFP expression in transduced BM cells was compared with expression of the ER-MP12 and ER-MP20 antigens. Differential expression of these antigens has been shown to identify distinct immature hematopoietic cell populations in murine BM.54,55 For example, the subpopulation of cells that is defined as ER-MP12-positive and ER-MP20-negative appeared to contain cells with long-term repopulating, day 12 spleen colony-forming ability, and clonogenic progenitors, whereas ER-MP20-positive and ER-MP12-negative cells consist of mature granulocytes.55 Using antibodies specific for these antigens in three-color flow cytometric analysis the total EGFP-transduced cell population could be divided into four subsets (Fig 9A). EGFP expression was detected in approximately 34% of the ER-MP12-positive cells and in only 13% of the ER-MP12-negative cells (Fig 9B). Similarly, approximately 40% of the ER-MP20-negative cells and only 5% of the ER-MP20-positive cells displayed a bright green fluorescence (Fig 9C). These results indicate that the cell fraction described to contain immature hematopoietic cells is preferentially transduced with the MFG-EGFP retroviral vector, whereas the fraction that contains relatively mature myeloid cells contains few transduced cells. Moreover, these data show the feasibility of using EGFP expression as a convenient marker to determine transduction efficiencies in phenotypically defined hematopoietic cell populations.
FACS analysis of EGFP expression in relation to ER-MP12 and ER-MP20 antigen expression in normal murine BM cells directly after transduction. The cells were stained sequentially with unlabeled ER-MP20 followed by GaR-Cy5 for detection of ER-MP20 antigen expression in the FL4 channel (ER-MP20), and with biotinylated ER-MP12 followed by SA-Tricolor for detection of ER-MP12 antigen expression in the FL3 channel (ER-MP12) of the FACSCalibur. The dot-plot profiles of ER-MP12 versus ER-MP20 (A) and of ER-MP12 and ER-MP20 versus green fluorescence (B and C, respectively) are shown. The lines used to discriminate between negative and positive cell populations are indicated and defined on the basis of appropriate control samples. In (B) and (C) the percentages of cells occurring in each quadrant are indicated.
FACS analysis of EGFP expression in relation to ER-MP12 and ER-MP20 antigen expression in normal murine BM cells directly after transduction. The cells were stained sequentially with unlabeled ER-MP20 followed by GaR-Cy5 for detection of ER-MP20 antigen expression in the FL4 channel (ER-MP20), and with biotinylated ER-MP12 followed by SA-Tricolor for detection of ER-MP12 antigen expression in the FL3 channel (ER-MP12) of the FACSCalibur. The dot-plot profiles of ER-MP12 versus ER-MP20 (A) and of ER-MP12 and ER-MP20 versus green fluorescence (B and C, respectively) are shown. The lines used to discriminate between negative and positive cell populations are indicated and defined on the basis of appropriate control samples. In (B) and (C) the percentages of cells occurring in each quadrant are indicated.
DISCUSSION
In this study we investigated the potential use of EGFP as a retrovirally encoded reporter molecule in the genetic modification and selection of murine BM cells. Since long-term expression of recombinant proteins from the MFG retroviral vector has been shown in lethally irradiated recipient mice after reconstitution of the hematopoietic system with retrovirally transduced murine BM cells,48,60 the EGFP gene was placed under transcriptional control of the MoMLV LTR in this vector. Both clonal ecotropic and amphotropic virus producer cell lines were generated using single-cell FACS cloning followed by cell expansion, and subsequently characterized. Flow cytometric analysis of these cells showed a bright green fluorescence in over 95% of the cells whereas Northern analysis confirmed the presence of the predicted vector-specific RNA species, indicating correct processing and splicing of the RNA and expression of the protein. Interestingly, the level of spliced RNA appears to be several-fold higher than that of unspliced RNA, a feature that has recently been correlated with augmented expression from the MFG retroviral vector.60 Despite earlier reports on the instability of retroviral producers containing GFP-specific vector sequences,61 62 the eMFG-EGFP and aMFG-EGFP producer cell lines described here proved to be stable with respect to EGFP expression and high-titer virus production.
The utility of EGFP as a reporter molecule of retroviral-mediated gene transfer was then tested in murine cell lines and primary hematopoietic cells. Flow cytometric analysis together with functional studies showed EGFP expression directly after termination of the transduction procedure in NIH 3T3 and Rat2 cell lines, as well as in primary BM in vitro clonogenic progenitors and day 13 CFU-S. Moreover, EGFP expression was readily detectable by FACS in the peripheral blood of lethally irradiated recipient mice 13 days posttransplantation with retrovirally transduced BM cells as well as in secondary BM in vitro clonogenic progenitors. The latter marrow repopulating assay demonstrated stable EGFP expression in actively proliferating primary hematopoietic cells during approximately 1 month after transduction. FACS-determined transduction efficiencies in primary BM cells correlated well with the percentage positive in vitro clonogenic progenitors as determined by flow cytometric and proviral integration analysis of individual methylcellulose colonies. The corresponding transduction frequencies shown by FACS and PCR analysis for the in vitro clonogenic progenitors suggest that EGFP expression is, at least directly after transduction, optimal from the MFG vector in these cells. Similarly, the recovery of EGFP-positive day 13 CFU-S and marrow repopulating cells indicates directly that the MoMLV promotor is able to provide for high-level EGFP expression in these immature hematopoietic cell populations of BM. However, a clear discrepancy was noticed in the transduction efficiency of primary BM cells and the CFU-S derived thereof (17% to 38% v 76%). A likely explanation for this phenomenon might be that the combination of growth factors and the use of a medium that promotes the in vitro proliferation of CFU-S43 for the prestimulation and transduction of murine BM cells has resulted in preferential transduction of immature cells that generate the macroscopic spleen colonies studied here. In this respect it is interesting that immunophenotyping of total EGFP-transduced murine BM cells with antibodies directed against the ER-MP12 and ER-MP20 antigens showed a preferential transduction of an ER-MP12-positive/ER-MP20-negative cell population, which recently has been correlated with the enriched presence of cells with long-term repopulating and spleen colony-forming ability.55 The availability of the EGFP retroviral marker together with two- or possibly three-color flow cytometric analysis will further facilitate the identification of transduction conditions for phenotypically defined hematopoietic cells capable of long-term reconstitution. It should be noted that day 13 CFU-S are cells associated with short-term (ie, several months) reconstitution of irradiated recipients, while cells with marrow repopulating ability correlate to long-term repopulating cells.63 In this stage it remains to be determined whether cells capable of long-term hematopoietic reconstitution have been transduced as well and whether EGFP expression is still detectable in defined hematopoietic cell types at 6 months posttransplantation.
The feasibility of using EGFP as a marker for the selection of retrovirally transduced target cells was evaluated for BM in vitro clonogenic progenitor cells and day 13 spleen colonies. Retrovirally transduced BM cells were sorted on the basis of green fluorescence intensity in greater than 95% EGFP-negative and EGFP-positive cell populations and these fractions were used for in vitro clonogenic progenitor assays. Flow cytometry showed that ≥90% of the GM-CFU derived from the EGFP-positive population proved to be EGFP-positive; in contrast, ≥90% of the GM-CFU derived from the EGFP-negative population proved to be EGFP-negative. The percentage EGFP-negative and EGFP-positive day 13 CFU-S obtained from mice injected with the corresponding FACS sorted BM populations, however, were less stringent (25% and 85%, respectively). The generation of EGFP-positive CFU-S from negatively selected primary BM cells might be due to the lack of an extensive expression period in between the end of the transduction and the FACS sorting in our procedure. Differences between EGFP-negative and EGFP-positive primary BM cells were not observed with respect to the number and morphology of the derived GM-CFU (see, for example, Fig 4) and day 13 CFU-S (data not shown), and to the multilineage production of secondary progenitor cells in individual spleen colonies. These results clearly show the feasibility of using EGFP as a rapid selectable marker of retroviral-mediated gene transfer in primary hematopoietic cells.
The application of EGFP as a retrovirally encoded reporter for murine BM cells might be advantageous above the use of other selectable markers such as, eg, the bacterial β-galactosidase gene22 and the human CD24 cell-surface antigen.28 EGFP has no requirement for secondary molecules, such as antibodies or substrates, for analysis of expression by FACS or fluorescence microscopy and therefore limits time and effort necessary for the detection of the transduced cells. The fluorescence intensity differences between EGFP-positive and EGFP-negative murine BM cells are relatively high, thus facilitating and improving the efficiency of the FACS selection of retrovirally transduced cells. As with, eg, the human CD24 cell-surface antigen, EGFP expression can be directly related to additional phenotypic markers (as demonstrated here for the cell-surface ER-MP12 and ER-MP20 antigens) using multiparameter flow cytometry to test, eg, various retroviral infection protocols for therapeutically relevant hematopoietic cells and to isolate pure populations of transduced cells with defined phenotypes, which will allow for functional analysis of their intrinsic properties. The use of EGFP as a reporter molecule might further facilitate studies on features of retroviral vector design, such as transcriptional control sequences, and serve as a fusion partner for biologically and/or therapeutically relevant genes. This marker might also facilitate in vivo studies on the homing and (growth-factor–stimulated) proliferation/differentiation of transplanted stem cells and the distribution properties of their progeny.
ACKNOWLEDGMENT
We are grateful to Dr R.C. Mulligan (Whitehead Institute for Biomedical Research, Cambridge, MA) for providing the MFG-lacZ plasmid and to Dr M.F.T.R. de Bruijn (Erasmus University Rotterdam, The Netherlands) for the ER-MP12 and ER-MP20 antibodies; Genetix Pharmaceuticals (Tarrytown, New York) for providing the GP+E-86 and GP+envAm12 packaging cell lines; Takara Shuzo Co (Shiga, Japan) for supplying CH-296; Ares-Serono (Geneva, Switzerland) for providing the hIL-6; Immunex (Seattle, WA) for providing the mSCF; Behringwerke (Marburg, Germany) for providing the hEPO; and Genentech Inc (San Francisco, CA) for providing the mTPO and mIL-3. We gratefully acknowledge K. van Rooyen for photographical artwork and E. van Bodegom for taking care of the mice.
Supported in part by the Netherlands Cancer Foundation Koningin Wilhelmina Fonds, the Dutch Organization for Scientific Research NWO, the Royal Netherlands Academy of Arts and Sciences, and Contracts of the Commission of the European Communities.
Address reprint requests to Marti F.A. Bierhuizen, PhD, Institute of Hematology, Erasmus University Rotterdam, Dr Molewaterplein 50, 3015 GE Rotterdam, The Netherlands.

This feature is available to Subscribers Only
Sign In or Create an Account Close Modal