Abstract
The interaction of thrombin with plasminogen activator inhibitor 1 (PAI-1) is shown to result in the simultaneous formation of both cleaved PAI-1 and a sodium dodecyl sulfate-stable thrombin-PAI-1 complex. The kinetics of this reaction can be described by a “suicide substrate” mechanism that includes a branched reaction pathway, which terminates in either the stable inhibitor-enzyme complex or the cleaved inhibitor plus free enzyme. Because of the branched pathway, approximately three moles of PAI-1 are needed to completely inhibit one mole of thrombin. Heparin and vitronectin enhance the rate of inhibition from 9.8 × 10² L mol−1 s−1 to 6.2 × 10⁴ L mol−1 s−1 and 2.1 × 10⁵ L mol−1 s−1, respectively, under optimal conditions. In addition to enhancing the rate of inhibition, both cofactors increase the apparent stoichiometry of the PAI-1–thrombin interaction, with cofactor concentration dependencies similar to the inhibition reaction. Thus, at 37°C approximately six cleavage reactions occur per inhibition reaction. Therefore, thrombin will efficiently inactivate PAI-1 in the presence of either vitronectin or heparin, unless a sufficient excess of the inhibitor is present. These results show that physiological cofactors are able to switch a protease-serpin inhibition reaction to a substrate reaction, depending on the local concentrations of each of the components.
PLASMINOGEN activator inhibitor 1 (PAI-1)1 is the main physiological inhibitor of both tissue-type (t-PA) and urokinase-type (u-PA) plasminogen activator1 and belongs to the ‘serpin’ superfamily of homologous proteins.2-5 Thrombin is inhibited by PAI-1 at a slow rate, but we have described that the cofactors heparin and vitronectin increase this rate by about two orders of magnitude.6,7 The physiological relevance of this finding was shown in the endothelial cell matrix (ECM), where efficient thrombin/PAI-1 complex formation is strongly dependent on the presence of endogenous vitronectin.8 Experiments performed with metabolically labeled ECM showed that addition of thrombin, t-PA or u-PA to the ECM resulted not only in the formation of sodium dodecyl sulfate (SDS)-stable PAI-1/protease complexes, but also in proteolytically cleaved PAI-1.8 Apparently, in this setting PAI-1 can be cleaved, either before or after complex formation with these proteases.
The interaction of t-PA with PAI-1, which has been studied in great detail, is dependent on the presence of a positively charged variable region (VR1) on the protease domain of t-PA, which presumably interacts with negatively charged residues on PAI-1.9-12 Evidence of the importance of the VR1 domain of t-PA for the interaction with PAI-1 was provided by mutagenesis experiments: deletion of VR1 or replacement of the positively charged residues of VR1 by negative ones, reduced the second-order rate constant of inhibition for this reaction by at least three orders of magnitude (from 2 × 10⁷ to ≤104 L mol−1 s−1).10 Consistent with these data, we showed that a thrombin variant having its entire variable region 1 substituted by that of t-PA (thrombin-VR1), showed a 2,000-fold increased rate of inhibition by PAI-1.13 In this case, as with native thrombin, substantial PAI-1 cleavage was observed during the time course of inhibition. In contrast to the inhibition of native thrombin by PAI-1, thrombin-VR1 inhibition is only marginally influenced by the presence of cofactors.
The interaction of a serpin with its target protease has been suggested to occur via the branched pathway of a so-called suicide substrate mechanism.14-16 In the ‘substrate’ pathway, the serpin acts as a substrate, ultimately leading to cleaved inhibitor and the release of active protease. Cleavage of the inhibitor occurs between the reactive site P1 and P′1 residues on an exposed surface loop, located about 30 residues from the C-terminus. In the ‘inhibition’ pathway presumably reversible complex formation also occurs but at some point the reaction is arrested, resulting in the formation of a SDS-stable, inactive serpin-protease complex. Within this complex, ultimate cleavage of the inhibitor is very slow and, consequently, in vivo the complexes will be cleared before progressive cleavage occurs. This mechanism was proposed because the balance between the two pathways, as defined by the partition ratio of rate constants k3 (substrate pathway) and k4 (inhibition pathway), can be modulated.17-23 The studies which lead to this proposal, however, were performed under special (mostly nonphysiological) conditions, eg, in the presence of SDS,21 at high versus low ionic strength,19 at 4°C,17 or in the presence of peptides.20 In the case of thrombin inhibition by PAI-1, however, we observed substrate behavior of PAI-1 under conditions that might be relevant in vivo, ie, in the ECM,8 where both cofactors vitronectin and heparin are present.24 25 Therefore, we set out to describe the mechanism of thrombin inhibition by PAI-1 and the role of both cofactors in more detail. In view of the proposed suicide substrate mechanism for serpin action, we investigated a possible influence of these cofactors on the inhibition rates and product distribution.
EXPERIMENTAL PROCEDURES
Materials.Unfractionated heparin from porcine intestinal mucosa (# H-3125, grade I, Lot 29F-0314; specific activity of 178 U/mg, average Mr of 15,000 to 18,000) and hirudin were obtained from Sigma (St Louis, MO). The chromogenic substrates CH3SO2 -D-HHT-Gly-Arg-p-nitroanilide (Pefachrome tPA) and H-D-Phe-Pip-Arg-p-nitroanilide (where Pip is pipecolic acid; S2238) were obtained from Pentapharm (Basel, Switzerland) and Chromogenix (Mölndal, Sweden), respectively. The fluorescent active-site directed, reversible inhibitor of thrombin Dansylarginine N-(3-Ethyl-1,5-pentanediyl)amide (DAPA) was prepared as described.26 The irreversible active-site directed thrombin inhibitor Phe-Pro-Arg-Chloromethyl-ketone (PPACK) was obtained from Calbiochem (San Diego, CA).27
Proteins.Human α-thrombin and the recombinant thrombin variant, designated thrombin-VR1 (containing the VR1 domain of t-PA), were obtained as described.13,28,29 Thrombin and thrombin-VR1 were active site-titrated with calibrated hirudin.13 Vitronectin was kindly donated by Dr K.T. Preissner (Max-Planck Institute, Bad Nauheim, Germany). Two-chain Bowes melanoma t-PA (616,000 IU/mg) was purchased from Biopool (#2114154, Umea, Sweden). Active PAI-1 was generously provided by Dr T.M. Reilly (Dupont de Nemours, Wilmington, DE).
Gel electrophoretic analysis of PAI-1 cleavage and complex formation.To prevent protein adsorption all experiments were performed in Eppendorf tubes or in wells of a microtiter plate (Nunc Maxisorp; GIBCO-BRL, Gaithersburg, MD) that had been pretreated for 1 hour at 37°C with 1% (wt/vol) polyethylene glycol 20,000 and subsequently washed with distilled water. Thrombin (600 nmol/L) and PAI-1 (3,600 nmol/L) were incubated at 37°C in HBST buffer (20 mmol/L HEPES [pH 7.4], 150 mmol/L NaCl, and 0.1% [vol/vol] Tween 80). At specific intervals, samples of 55 μL were taken and the reaction was quenched by mixing the aliquot with an equal volume of sample buffer (5% [wt/vol] SDS, 45% [vol/vol] glycerol, 0.05 mol/L TRIS-HCl [pH 6.8], and 0.05% [wt/vol] bromphenol blue). Mixtures were heated at 95°C for 5 minutes and subsequently subjected to 10% (wt/vol) SDS-polyacrylamide gel electrophoresis (SDS-PAGE) under nonreducing conditions in a Hoefer apparatus (Hoefer Scientific Instruments, San Francisco, CA). Proteins were stained with Coomassie Brilliant Blue (GIBCO-BRL) and reaction products were quantified by laser densitometry. At identical time points, 20 μL aliquots were withdrawn and the reaction was quenched by adding the aliquots to 680 μL 0.5 mmol/L of the chromogenic substrate S2238. Residual thrombin amidolytic activity in these aliquots was measured at 37°C after a 25-fold dilution in HBST buffer, containing 0.5 mmol/L S2238, by continuously recording the absorbance at 405 nm in a Titertek Twinreader (Flow Laboratories, Irvine, UK).
Fluorometric assay for thrombin inhibition.The reaction between thrombin and PAI-1 was monitored by including the fluorescent, reversible thrombin inhibitor DAPA26 in the reaction solution as described.30 Traditional progress curve analysis could not be performed, since PAI-1 is rapidly inactivated by a number of chromogenic substrates tested (Van Meijer M. and Horrevoets A.J.G., unpublished observations, March 1993, and ref 31). Fluorescence intensity was measured at 37°C with a Perkin-Elmer LS-50 fluorimeter (Norwalk, CT). The excitation wavelength was 280 nm with a band pass of 10 nm, the emission wavelength was 565 nm with a 15-nm band pass, using a 430-nm cut-off filter in the emission beam. The dissociation constant (kd) for DAPA of the thrombin used in this study was determined to be 63.5 nmol/L.26 Briefly, a solution of thrombin (final concentration of 18.6 nmol/L or 36.6 nmol/L) was prewarmed in HBST buffer in the presence of DAPA (370.4 nmol/L or 182.9 nmol/L) and vitronectin or heparin at various concentrations in a fluorimeter microcuvette (Hellma Benelux, Rijswijk, the Netherlands). The inhibition reaction was started by the addition of a small volume of PAI-1 and the reaction was monitored continuously until no further change in fluorescence intensity was observed. Alternatively, the inhibition reaction was stopped after approximately 10 minutes by the addition of 0.5 μL of 3.2 mmol/L of the active-site directed irreversible thrombin inhibitor PPACK to determine the maximal change in fluorescence intensity. Initial reaction rates of thrombin inhibition were calculated from the slope of a plot of fluorescence intensity versus time. The initial reaction rate equals: To*slope/(Fi−Fo ), in which To represents total thrombin concentration, Fi is the initial fluorescence intensity at time zero, and Fo is the fluorescence intensity at complete inhibition. Alternatively, initial reaction rates were determined by fitting inhibition curves with single exponential decay and multiplying the rate constant with To . To correct for the attenuation of the reaction by DAPA, rates were multiplied with: (1) 1+(DAPAt /kd ) when DAPA concentrations exceeded the thrombin concentration by at least 10-fold,30 or with (2) (1−((1/2 * ((kd + To+ DAPAt)−Sqrt((kd + To+ DAPAt)2− (4 * DAPAt* To))))/To))−1 when DAPA concentrations were similar to the thrombin concentrations, necessitating the use of the quadratic equilibrium binding equation. The terms DAPAt and kd , represent total DAPA concentration and the dissociation constant of thrombin for DAPA, respectively. The data for the inhibition of thrombin by PAI-1 in the presence of vitronectin were analyzed according to a model in which only the PAI-1/vitronectin complex contributes significantly to the reaction rate. In such a model the rate of thrombin inhibition can be expressed by the second-order rate equation: (3) Rate = k * [thrombin] * [PAI/VN]. The symbol k represents the second-order rate constant for thrombin inhibition by the PAI-1/VN complex, the concentration of which is calculated according to the quadratic equilibrium binding equation: (4) [PAI/VN] = 1/2 * (P + V + kd − Sqrt((P + V + kd)2 − 4 * P * V)), in which P = PAI-1, V = vitronectin, kd = dissociation constant of the PAI-1/vitronectin complex. Our experimental data were subjected to a global fit to these equations, which yields values for k and kd, by employing the nonlinear regression algorithm of Marquardt-Levenberg.
Determination of the apparent stoichiometry.The apparent stoichiometry for the interaction of PAI-1 with thrombin, thrombin-VR1, or t-PA was determined by titration of the enzyme with step-wise increased concentrations of PAI-1 as described in detail.7 These titrations were performed for various times (between 1.5 and 18 hours) at 37°C with various concentrations (between 2 and 100 nmol/L) of either thrombin, thrombin-VR1, or t-PA in a volume of 25 μL of HBST buffer. The incubation times used were determined from calculations using known inhibition rate constants. Control experiments indicated that these incubation times were sufficient for completion of the reaction. In all cases, a control incubation containing no inhibitor was included. In some reactions, various concentrations of vitronectin or heparin were included. Residual protease activity was subsequently determined at 37°C by the addition of a sample to a mixture of 150 μL HBST buffer and 25 μL of 4 mmol/L of the chromogenic substrate S2238 (thrombin or thrombin-VR1) or Pefachrome tPA (t-PA), respectively, by measuring the increase in absorbance at 405 nm in a Titertek Twinreader. Results were plotted as the fraction of residual enzyme activity versus the initial inhibitor concentration. The intercept on the abscissa is the apparent stoichiometry of the reaction, being equal to 1 + the partition ratio (r ).15 This partition ratio (k3 /k4 , see Fig 1) represents the number of catalytic turnovers per inactivation event.
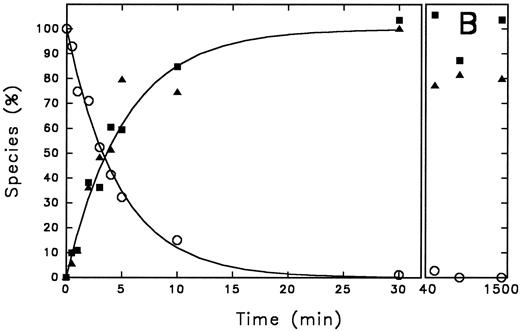
Time course of PAI-1 cleavage by thrombin and of thrombin/PAI-1 complex formation. Thrombin (600 nmol/L) and PAI-1 (3,600 nmol/L) were incubated at 37°C as described under the Experimental Procedures. At the indicated time points aliquots were withdrawn and subjected to 10% (wt/vol) SDS-polyacrylamide gel electrophoresis, stained with Coomassie Brilliant Blue (A). The indicated reaction products were quantified by densitometry and the amounts obtained were expressed as percentage of maximum intensity observed for each individual band (B). The lines represent the outcome of nonlinear regression analysis, according to a single-exponential reaction mechanism. The rate of disappearance of the thrombin band yields a second-order rate constant for inhibition of 9.8 × 10² L mol−1 s−1. (A) “A” represents PAI-1; “B” represents thrombin. Times were as indicated (min). (B) (○), thrombin; (▪), cleaved PAI-1; (▴), PAI-1/thrombin complex.
Time course of PAI-1 cleavage by thrombin and of thrombin/PAI-1 complex formation. Thrombin (600 nmol/L) and PAI-1 (3,600 nmol/L) were incubated at 37°C as described under the Experimental Procedures. At the indicated time points aliquots were withdrawn and subjected to 10% (wt/vol) SDS-polyacrylamide gel electrophoresis, stained with Coomassie Brilliant Blue (A). The indicated reaction products were quantified by densitometry and the amounts obtained were expressed as percentage of maximum intensity observed for each individual band (B). The lines represent the outcome of nonlinear regression analysis, according to a single-exponential reaction mechanism. The rate of disappearance of the thrombin band yields a second-order rate constant for inhibition of 9.8 × 10² L mol−1 s−1. (A) “A” represents PAI-1; “B” represents thrombin. Times were as indicated (min). (B) (○), thrombin; (▪), cleaved PAI-1; (▴), PAI-1/thrombin complex.
RESULTS
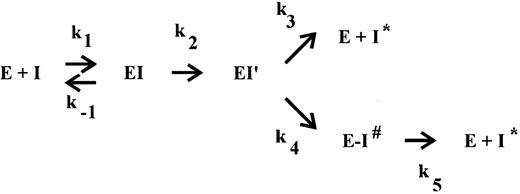
Time course of PAI-1 cleavage by thrombin and of thrombin/PAI-1 complex formation.Gel electrophoretic analysis of the time course of inhibition of thrombin by PAI-1 shows the appearance of cleaved inhibitor, in addition to stable complex formation (Fig 1A). This observation can be explained by two different reaction pathways: (1) after formation of the SDS-stable complex, hydrolysis of the complex results in release of active enzyme and cleaved inhibitor, and (2) the serpin can act as a suicide substrate. This means that after the formation of the reversible complex, two pathways can be followed: one leading to the formation of the SDS-stable complex (inhibition pathway) and one leading to cleavage of the inhibitor and release of the active enzyme (substrate pathway) (Fig 2). To discriminate between these possibilities, the progress of the reaction between thrombin and PAI-1 and the appearance of the different species was followed for a time period much longer than the time needed to inhibit all thrombin present. The reaction products seen on the gel were quantified using laser densitometry (Fig 1A and B). Complex formation and cleavage of PAI-1 clearly occur simultaneously during the reaction as depicted by the fitted first-order reaction curve for the appearance of both species. The rate of disappearance of the thrombin band agrees with a second-order rate constant of 9.8 × 10² L mol−1 s−1, which is consistent with published numbers. As a control, the amidolytic activity of thrombin was determined at similar time points and was shown to decrease with an identical second-order rate constant (data not shown). Furthermore, the concentration of cleaved inhibitor remained stable during a further 19 hours incubation without reappearance of free active thrombin and little degradation of the complex was observed. The apparent stoichiometry determined within the experimental limits of gel quantitation was about 3, which is in good agreement with the more accurate numbers as determined by titration (Table 1). Control experiments performed with latent PAI-1, which is unable to complex with thrombin, revealed no cleavage of PAI-1 (data not shown).
The branched pathway of a suicide substrate mechanism. The inhibitor (I) forms a reversible complex (EI) with its target serine protease (E), characterized by the bimolecular rate constant k1 and the dissociation rate constant k−1 . Subsequently, an intermediate complex (EI′) is formed, which can convert with a rate constant k4 into the SDS-stable complex E-I# or it can react according to a substrate mechanism, resulting in free enzyme and cleaved inhibitor (I*) with the corresponding rate constant k3 . The partition ratio (r = k3/k4 ) represents the number of catalytic turnovers per inactivation event, 1 + r is the apparent stoichiometry. Finally, the stable bimolecular complex (E-I#) can dissociate with a rate constant k5 into the free active enzyme (E) and cleaved, inactive inhibitor (I*).
The branched pathway of a suicide substrate mechanism. The inhibitor (I) forms a reversible complex (EI) with its target serine protease (E), characterized by the bimolecular rate constant k1 and the dissociation rate constant k−1 . Subsequently, an intermediate complex (EI′) is formed, which can convert with a rate constant k4 into the SDS-stable complex E-I# or it can react according to a substrate mechanism, resulting in free enzyme and cleaved inhibitor (I*) with the corresponding rate constant k3 . The partition ratio (r = k3/k4 ) represents the number of catalytic turnovers per inactivation event, 1 + r is the apparent stoichiometry. Finally, the stable bimolecular complex (E-I#) can dissociate with a rate constant k5 into the free active enzyme (E) and cleaved, inactive inhibitor (I*).
Apparent Stoichiometry for Protease Inhibition by PAI-1
| Protease . | 1.5 h . | 2.5 h . | 4.3 h . | 18 h . | +Heparin . | +Vitronectin . |
|---|---|---|---|---|---|---|
| Thrombin | 3.2 | 3.1 | 2.8 | 3.0 | 7.1 | 5.1 |
| Thrombin-VR1 | 2.3 | 2.9 | 2.3 | 2.3 | 6.6 | 7.4 |
| t-PA | 1.0 | 1.0 | 1.0 | 1.0 | 1.0 | 1.0 |
| Protease . | 1.5 h . | 2.5 h . | 4.3 h . | 18 h . | +Heparin . | +Vitronectin . |
|---|---|---|---|---|---|---|
| Thrombin | 3.2 | 3.1 | 2.8 | 3.0 | 7.1 | 5.1 |
| Thrombin-VR1 | 2.3 | 2.9 | 2.3 | 2.3 | 6.6 | 7.4 |
| t-PA | 1.0 | 1.0 | 1.0 | 1.0 | 1.0 | 1.0 |
The apparent stoichiometries were determined by titration at 37°C at least in duplicate as described under “Experimental Procedures.” Indicated are results obtained at different time points and, when indicated, in the presence of either an optimal heparin concentration (ie, 1 U/mL in case of thrombin (502.5 nmol/L) inhibition, and 0.5 U/mL in case of thrombin-VR1 (20 nmol/L inhibition), or 200 nmol/L vitronectin.
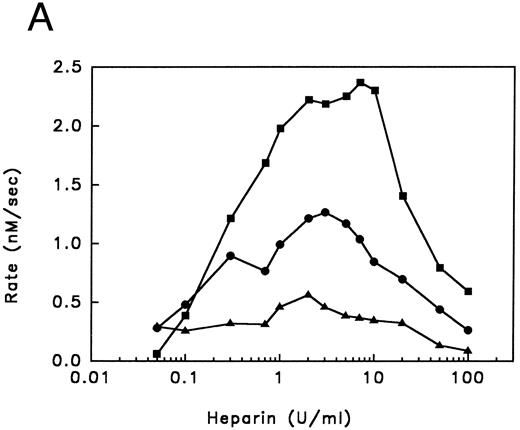
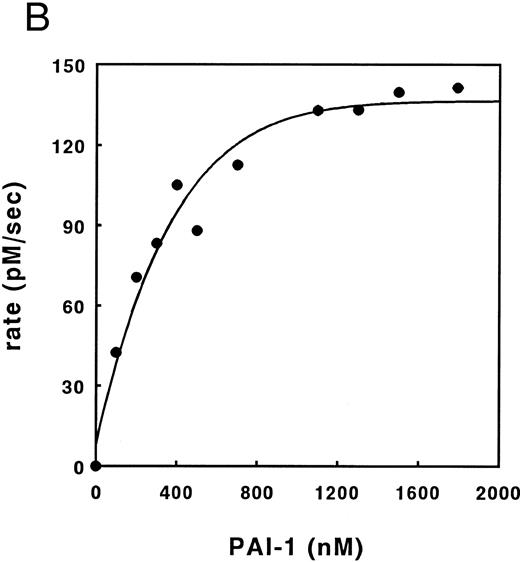
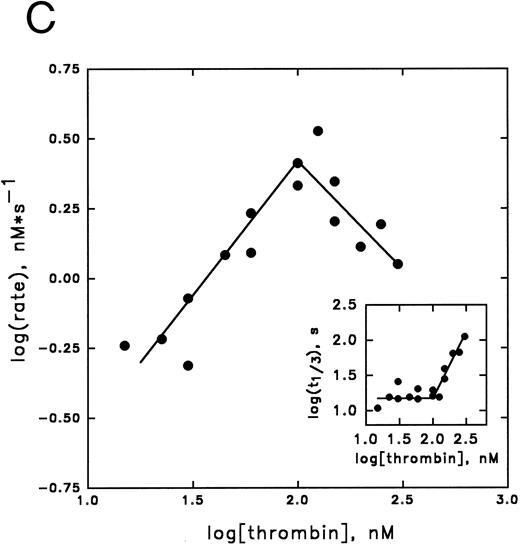
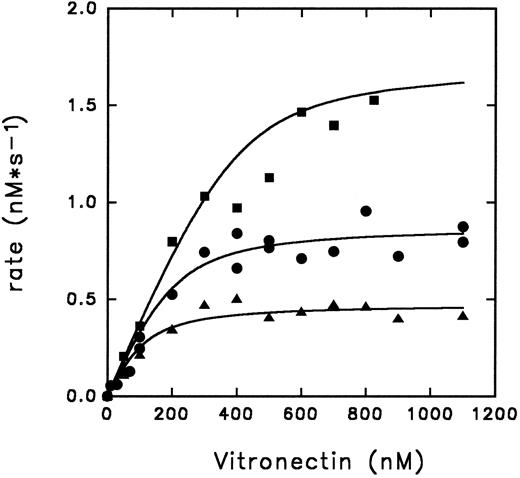
Kinetic analysis of cofactor influence on the inhibition pathway.Previous data from our laboratory,6,32 suggested that heparin might accelerate the inhibition of thrombin by PAI-1 by acting as a template. In Fig 3 we have now elaborated on these observations by studying this reaction in more detail. This was done by studying these kinetics by means of displacement of the thrombin specific fluorescent inhibitor DAPA from the active site by PAI-1. Traditional progress curve analysis could not be performed, since we observed that PAI-1 is rapidly inactivated by a number of chromogenic substrates tested (data not shown) as has been reported during the progress of these studies by others.31 Central to the template mechanism is that inhibitor and enzyme are concentrated on the template in a way that favors the interaction. At any fixed concentration of inhibitor and enzyme, an optimum in the inhibition rate with increasing concentrations of heparin is observed. Furthermore, the reaction rate saturates in both proteins at a fixed concentration of heparin.33 Figure 3A illustrates that increased concentrations of heparin, in the presence of fixed concentrations of thrombin and PAI-1, result in increased initial rates of thrombin inhibition up to a maximum, followed by a decrease in rates. Furthermore, with increasing concentrations of PAI-1, the rate obtained at the peak of the bell-shaped curves, and the heparin concentration required to obtain the maximum, increases. The maximal rate of inhibition accords to a second-order rate constant for inhibition of 6.2 × 10⁴ L mol−1 s−1, representing a 124-fold increase over the rate in the absence of heparin. As shown in Fig 3B, the thrombin inhibition rate saturates at high PAI-1 concentrations, reflecting saturation of the binding sites on heparin with PAI-1. The existence of saturation implies that PAI-1 does not effectively compete with functionally significant bound thrombin. In contrast, when the rate of thrombin inhibition was determined at various thrombin concentrations at fixed concentrations of PAI-1, heparin, and DAPA, the observed rate of inhibition increases up to a maximum and then decreases (Fig 3C). This decrease in the inhibition rate may indicate that thrombin can bind to functionally significant PAI-1 binding sites on heparin.33 The linear increase in the double-logarithmic plot of rate versus thrombin exhibits a slope of 1.0, indicating that the reaction is first order with respect to thrombin. The inset of Fig 3C shows the relation between fractional lifetime (t1/3 ) as a function of thrombin concentration.30 The inflection point indicates a transition from first to zero-order kinetics with respect to the thrombin concentration upon saturation of the heparin template. This occurs when approximately two molecules of thrombin are bound to one heparin molecule. Figure 4 shows the effect of increasing concentrations of vitronectin on the rate of thrombin inhibition by PAI-1. Increasing concentrations of vitronectin result in increased rates for inhibition up to a maximum. Within the experimentally feasible range of concentrations, however, no decrease is observed at higher concentrations of this cofactor. Apparently, at each of the PAI-1 concentrations tested, rates are maximal when all the PAI-1 is complexed to vitronectin. In agreement with this finding, the maximum rate of thrombin inhibition observed was proportional to the concentration of PAI-1 present. Furthermore, the rates as a function of the bimolecular PAI-1/vitronectin complex at each of the PAI-1 concentrations could be well fitted with a kd of approximately 50 nmol/L for the formation of the PAI-1/vitronectin complex and a second-order rate constant for thrombin inhibition by this complex of 2.1 × 10⁵ L mol−1 s−1 (solid lines, Fig 4).
Inhibition of thrombin by PAI-1 in the presence of heparin. (A) Initial rates of thrombin (36.6 nmol/L) inhibition in the presence of heparin and PAI-1 (concentrations as indicated), were determined. Initial rates were corrected for the presence of DAPA (182.9 nmol/L) as described under Experimental Procedures. (▴), 190 nmol/L PAI-1; (•), 570 nmol/L PAI-1; (▪), 1,476 nmol/L PAI-1. (B) Initial rates of thrombin (30 nmol/L) inhibition by increasing concentrations of PAI-1 (100 to 1,800 nmol/L) were measured at a fixed concentration of heparin (0.17 U/mL; 60 nmol/L) and corrected for the presence of DAPA (370.4 nmol/L) as described under Experimental Procedures. (C) Initial reaction rates were measured at fixed concentrations of heparin (0.17 U/mL; 60 nmol/L), PAI-1 (1 μmol/L), and DAPA (150 nmol/L) at various concentrations of thrombin. Rates were corrected for the presence of DAPA, according to equation (2), as described under Experimental Procedures. The linear increase in the double-logarithmic plot of rate versus thrombin exhibits a slope of 1.0, indicating that the reaction is first-order with respect to thrombin. The inset shows the relation between fractional lifetime (t1/3 ) as a function of thrombin concentration. The inflection point indicates a transition from first-order to zero-order kinetics with respect to thrombin concentration, as a result of saturation of the heparin template. For further details see Experimental Procedures.
Inhibition of thrombin by PAI-1 in the presence of heparin. (A) Initial rates of thrombin (36.6 nmol/L) inhibition in the presence of heparin and PAI-1 (concentrations as indicated), were determined. Initial rates were corrected for the presence of DAPA (182.9 nmol/L) as described under Experimental Procedures. (▴), 190 nmol/L PAI-1; (•), 570 nmol/L PAI-1; (▪), 1,476 nmol/L PAI-1. (B) Initial rates of thrombin (30 nmol/L) inhibition by increasing concentrations of PAI-1 (100 to 1,800 nmol/L) were measured at a fixed concentration of heparin (0.17 U/mL; 60 nmol/L) and corrected for the presence of DAPA (370.4 nmol/L) as described under Experimental Procedures. (C) Initial reaction rates were measured at fixed concentrations of heparin (0.17 U/mL; 60 nmol/L), PAI-1 (1 μmol/L), and DAPA (150 nmol/L) at various concentrations of thrombin. Rates were corrected for the presence of DAPA, according to equation (2), as described under Experimental Procedures. The linear increase in the double-logarithmic plot of rate versus thrombin exhibits a slope of 1.0, indicating that the reaction is first-order with respect to thrombin. The inset shows the relation between fractional lifetime (t1/3 ) as a function of thrombin concentration. The inflection point indicates a transition from first-order to zero-order kinetics with respect to thrombin concentration, as a result of saturation of the heparin template. For further details see Experimental Procedures.
Inhibition of thrombin by PAI-1 in the presence of vitronectin. The initial rates for thrombin inhibition by PAI-1 in the presence of increasing concentrations of vitronectin are indicated. The rates were measured at a thrombin concentration of 18.6 nmol/L and PAI-1 concentrations of 100 nmol/L (▴), 200 nmol/L (•), or 400 nmol/L (▪), and corrected for the presence of DAPA (370, 4 nmol/L) as described under Experimental Procedures. The lines represent results of a global fit of rates as a function of the bimolecular PAI-1/vitronectin complex as described under Experimental Procedures. Optimal fit was obtained with the values of 51 ± 29 nmol/L for kd and k of 2.1 ± 0.1 × 10⁵ L mol−1 s−1.
Inhibition of thrombin by PAI-1 in the presence of vitronectin. The initial rates for thrombin inhibition by PAI-1 in the presence of increasing concentrations of vitronectin are indicated. The rates were measured at a thrombin concentration of 18.6 nmol/L and PAI-1 concentrations of 100 nmol/L (▴), 200 nmol/L (•), or 400 nmol/L (▪), and corrected for the presence of DAPA (370, 4 nmol/L) as described under Experimental Procedures. The lines represent results of a global fit of rates as a function of the bimolecular PAI-1/vitronectin complex as described under Experimental Procedures. Optimal fit was obtained with the values of 51 ± 29 nmol/L for kd and k of 2.1 ± 0.1 × 10⁵ L mol−1 s−1.
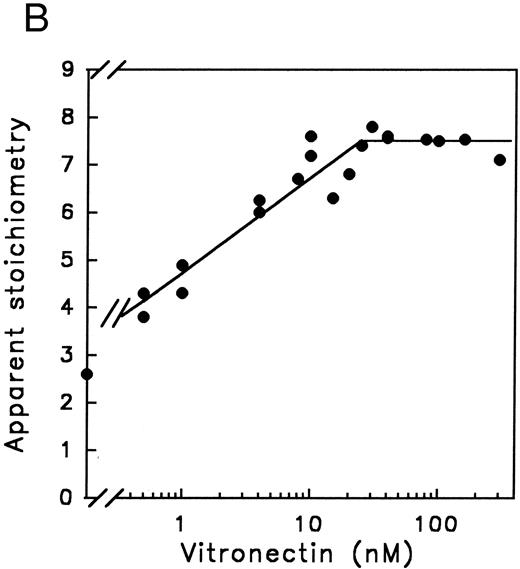
Distribution of PAI-1 over substrate and inhibition pathways.In the previous section we have shown that PAI-1 acts as a suicide substrate (Fig 1). Furthermore, we have shown that the cofactors heparin and vitronectin increase the rate of thrombin inhibition by at least two orders of magnitude (Figs 3 and 4). Initially, we hypothesized that the increased inhibition rates in the presence of the cofactors might be the result of protection against PAI-1 cleavage. Therefore, we monitored the thrombin and, as a control, the t-PA inhibition reaction under several conditions. In addition, we used a thrombin variant, denoted thrombin-VR1, that is inhibited three orders of magnitude faster by PAI-1 than native thrombin, even in the absence of cofactors.13 First, we determined that the apparent stoichiometry of the PAI-1-protease reaction is stable in time at 37°C for all proteases (Table 1) and is independent of protease concentrations (data not shown). Second, we determined the cofactor concentration dependence of the cleavage pathway by determining the amount of PAI-1 required to inhibit 1 nmol/L of thrombin-VR1. This thrombin variant was used for this study, since the inhibition rate with native thrombin is too low to perform these experiments with experimentally feasible concentrations of the proteins. As shown in Fig 5A, similar to the cofactor dependence observed for the rate of thrombin inhibition (Fig 3A), the stoichiometry showed an optimum with respect to the heparin concentration. Moreover, the optimal heparin concentrations are similar, and both pathways show a bell-shaped profile (Fig 3A and 5A). In contrast, as shown in Fig 5B, in the case of PAI-1 and vitronectin there is a maximum PAI-1 cleavage at high vitronectin concentrations. Figure 5B is an endpoint titration in which the components are incubated for one hour. Therefore, the stoichiometry of PAI-1 to vitronectin is not necessarily 1:1, since vitronectin can be recycled for another interaction with uncomplexed PAI-1. This result is comparable with the relationship of increasing vitronectin concentrations and maximum initial rate of inhibition (Fig 4). Next, we determined the apparent stoichiometry of native thrombin inhibition in the presence of optimal concentrations of the cofactors (Table 1). Both cofactors increase the apparent stoichiometry approximately twofold to threefold not only for native thrombin but also for thrombin-VR1. So although cofactors hardly influence the inhibition rate for this variant, they do have the same effect on the partition ratio. In contrast, t-PA inhibition by PAI-1 did not show an increased stoichiometry in the presence of heparin and vitronectin (Table 1). This demonstrates that the effect of the cofactors on product distribution is specific for thrombin.
Influence of cofactors on the distribution of PAI-1 over the substrate and inhibition pathway. The apparent stoichiometry for the inhibition of thrombin-VR1 by PAI-1 in the presence of increasing amounts of heparin (A), or vitronectin (B) were determined as described under Experimental Procedures. These titrations were performed at concentrations of thrombin-VR1 of 20 nmol/L (A) or 4 nmol/L (B) with an increasing concentration of PAI-1 (from 0 nmol/L to 50 nmol/L) to determine the apparent stoichiometry. This apparent stoichiometry represents 1 + the partition ratio (k3 /k4 ), as depicted in Fig 2.
Influence of cofactors on the distribution of PAI-1 over the substrate and inhibition pathway. The apparent stoichiometry for the inhibition of thrombin-VR1 by PAI-1 in the presence of increasing amounts of heparin (A), or vitronectin (B) were determined as described under Experimental Procedures. These titrations were performed at concentrations of thrombin-VR1 of 20 nmol/L (A) or 4 nmol/L (B) with an increasing concentration of PAI-1 (from 0 nmol/L to 50 nmol/L) to determine the apparent stoichiometry. This apparent stoichiometry represents 1 + the partition ratio (k3 /k4 ), as depicted in Fig 2.
DISCUSSION
The data presented in this report show that the inhibition of thrombin by PAI-1 can be described in terms of a suicide substrate mechanism (Fig 2) in which after formation of the bimolecular complex, the enzyme can either be trapped in a SDS-stable complex or can cleave the inhibitor and thereby become available for another catalytic turnover. In agreement with such a mechanism it was found that the kinetics of complex formation and PAI-1 cleavage are virtually identical (Fig 1), and prolonged incubation of thrombin and PAI-1 (19.5 hours) did not result in detectable release of active thrombin, excluding progressive cleavage of the SDS-stable thrombin/PAI-1 complexes within the experimental time. Thus the value of rate constant k5 (Fig 2) is negligible. The product distribution of the reaction between thrombin and PAI-1 can be deduced from the apparent stoichiometry of the reaction (Table 1). Notably, the variant thrombin-VR1, which is inhibited three orders of magnitude faster than thrombin, shows a similar apparent stoichiometry. In contrast, t-PA inhibition by PAI-1 in a purified system shows a 1:1 stoichiometry at 37°C, excluding the presence of a “substrate-form” of PAI-1 in our preparation.34
The kinetics of the stimulation of the rate of thrombin inhibition by PAI-1 by the cofactor heparin are fully consistent with a template mechanism as suggested previously by studies from our laboratory.6,32 Our data are comparable to those reported on the inhibition of thrombin by antithrombin III in the presence of heparin.30 In that study it was shown that the enzyme does not interfere with antithrombin III binding to heparin. It should be noted that in that study the heparin was fractionated on immobilized antithrombin III, to select the high affinity subfraction. However, we find competition when two thrombin binding sites are saturated,35 probably caused by the almost 10-fold lower affinity of PAI-1 for unfractionated heparin compared to antithrombin III.6 In contrast to the results for heparin, increasing concentrations of vitronectin result in increased rates of inhibition up to a maximum without a decrease at higher concentrations of this cofactor. Thus, within our experimental limits, we did not find evidence that vitronectin would accelerate the rate of the reaction by acting as a template. This is in agreement with our previous data obtained at nanomolar concentrations of the proteins,7 where it was shown that a 300-fold excess of vitronectin over PAI-1 did not result in a decreased rate. Naski et al,36 who used a similar range of vitronectin concentrations as in the present study, suggested such a template mechanism based on indirect evidence for binding of thrombin to vitronectin.36,37 These authors also hypothesized the existence of additional accelerating effects other than a template mechanism. Our data show optimal rates of thrombin inhibition at vitronectin concentrations that are equal to or exceed the PAI-1 concentration, indicating that the increased rate is a reflection of an increased concentration of the bimolecular PAI-1/vitronectin complex, which is maximized when all PAI-1 is complexed. Apparently, the PAI-1/vitronectin complex acts as a functionally different inhibitor species than uncomplexed PAI-1, as discussed in more detail below. A global fit of our data to this reaction mechanism yields a kd of approximately 50 nmol/L for the formation of the vitronectin/PAI-1 complex. This value inferred by kinetics is comparable with that for the low-affinity PAI-1 binding site on vitronectin (kd = 55 nmol/L), found by equilibrium binding studies.38
Previously it has been shown that addition of high concentrations of thrombin and heparin to preformed PAI-1/thrombin complexes results in the appearance of cleaved forms of the complex and PAI-1.39 However, the molecular weight of the cleaved forms of PAI-1 (<31 kD) were not consistent with cleavage within the reactive center loop. We show for the first time that the cofactors vitronectin and heparin increase the amount of reactive center loop-cleaved, inactive PAI-1 that is formed during the interaction of thrombin with PAI-1 in addition to their accelerating effect on the formation of the inactive PAI-1/thrombin complex. Again, appearance of reactive center loop-cleaved PAI-1 (MW 39 kD; SDS-PAGE, data not shown) occurs simultaneous to but not after complex formation, consistent with a suicide substrate mechanism. Apparently, these cofactors have a profound effect on more than one of the individual rate constants that constitute the suicide substrate mechanism of thrombin/PAI-1 interaction (Fig 2), since the overall rate of thrombin inhibition is increased by two orders of magnitude, and cleavage is increased twofold to threefold, as reflected by the increased apparent stoichiometry of the reaction (Table 1).
Recently, time-resolved fluorescence spectroscopy has indicated that binding of the cofactors heparin and vitronectin to PAI-1 induces a conformational change in the reactive center of PAI-1.40 Apparently, the different architecture of the exposed loop upon binding of PAI-1 to one of its cofactors makes these amino acid residues more accessible for the thrombin catalytic center. Our results imply that this altered conformation of the reactive site loop results in both increased substrate and inhibition reactions in the case of thrombin. The reaction between t-PA with PAI-1 in a purified system differs from thrombin by the appearance of cleaved inhibitor in the latter case. Apparently, the k4 of t-PA exceeds the k3 to a great extent, since no cleavage of PAI-1 is observed, unless the reaction is performed in the ECM.8 An explanation for the difference in the partition ratio between t-PA and thrombin might be that thrombin is a more potent catalyst than t-PA, both for the hydrolysis of chromogenic substrates, as reflected by more than 10-fold greater kcat values, and for the proteolysis of plasminogen and fibrinogen, which are the natural substrates for t-PA and thrombin, respectively.41 42
The notion that a serpin inhibits its target proteases via a suicide substrate mechanism has profound implications on our understanding and appreciation of this reaction in vivo. Especially so in the case of the interaction between thrombin and PAI-1, since in this case the outcome of the reaction can be locally influenced by the cofactors vitronectin and heparin, both of which increase the thrombin inhibition rate by PAI-1 at the expense of increased PAI-1 consumption through the cleavage pathway. It can be speculated that cleavage of PAI-1 rather than inhibition of thrombin will be the main event occurring in vivo, since the PAI-1 consumption exceeds the amount of complexes formed under most conditions tested. Thus, thrombin will efficiently inactivate PAI-1 in the presence of either vitronectin or heparin, provided thrombin is present in sufficient amounts to overcome the minor contribution of the inhibition reaction (1 in 6 catalytic events). This situation is likely to occur in plasma, where during coagulation high local concentrations of thrombin will be generated. This is particularly relevant in the setting of platelet-rich plasma clots, which are rich in α-granule PAI-1 and thereby thrombolysis resistant. Under these circumstances, high concentrations of thrombin will act profibrinolytic by inactivating PAI-1, the inhibitor of the fibrinolytic enzyme t-PA. Therefore, the direct and efficient inhibition of thrombin during thrombolytic therapy as adjunctive therapy to prevent reocclusion, might in fact adversely affect thrombolysis, a phenomenon that needs further study.
These findings also have implications for the processes that occur in the vessel wall under (patho)physiological conditions. A vast number of studies have shown that the proteins described in this study are synthesized in the vessel wall under inflammatory conditions. Specifically, such conditions induce the synthesis and surface exposure of tissue factor by smooth muscle cells, which may ultimately result in the generation of thrombin.43,44 Recently, it has been shown that smooth muscle cells express the specific thrombin receptor,45 permitting effects of thrombin on smooth muscle cell specific gene expression. Furthermore, several laboratories have reported on the induction of PAI-1 synthesis and secretion by smooth muscle cells by thrombin.46,47 Finally, a natural constituent of this cell matrix, namely vitronectin, has recently been shown to promote the clearance of active thrombin in a PAI-1 dependent manner by low density lipoprotein receptor-related protein-expressing cells.48 Collectively, those observations suggest a potential “feed-back” regulatory mechanism for thrombin activity. The data reported in this paper provide a mechanistic concept for the interactions between thrombin, PAI-1 and specific cofactors. Therefore, the relative amounts of active PAI-1 and thrombin at this site, which might be determined by the outcome of the suicide substrate mechanism, will have important implications for local cellular processes.
Supported by the Netherlands Organization for Scientific Research (The Hague) (Grant 902-26-132); by the Netherlands Thrombosis Foundation (The Hague) (Grant 92.003); and by the Molecular Cardiology Program of the Netherlands Heart Foundation (The Hague) (Grant M93.007).
Address reprint request to Anton J.G. Horrevoets, PhD, Academic Medical Center, Department of Biochemistry (K1-163), Meibergdreef 15, 1105 AZ Amsterdam, The Netherlands.



This feature is available to Subscribers Only
Sign In or Create an Account Close Modal