Abstract
We simulated gene therapy using parameters derived from the analysis of autologous transplantation studies in glucose-6-phosphate dehydrogenase heterozygous cats to determine how hematopoietic stem cell (HSC) biology might influence outcomes. Simulation illustrates that a successful experiment can result by chance and may not be the repeated outcome of a specific protocol design or technical approach. As importantly, in many simulated gene therapy experiments where 1, 2, or 6 of 30 transplanted HSC were labeled, there was significant variation in the contribution from marked clones over time. Variability was minimized in simulations in which large numbers of HSC were transplanted. Strategies that may permit consistent clinically successful results are presented. Taken together, these simulation studies demonstrate that the in vivo behavior of HSC must be considered when optimizing approaches to gene therapy in large animals, and perhaps by extension, in humans.
THERE ARE MANY technical obstacles that must be resolved before hematopoietic stem cell (HSC) gene therapy is a clinical reality.1-3 For example, the isolation and/or enrichment of feline, canine, monkey, ape, and human (HSCs) is difficult, and the in vitro culture of these cells may diminish their proliferative potential.4-6 Also, vector systems that guarantee the efficient delivery of DNA to HSC, and the continued high level expression of this DNA in progeny cells, need to be developed. In addition, the intrinsic in vivo behavior of the target cell, the HSC, has not been studied in depth.
To address this latter issue, we have observed hematopoiesis in G6PD heterozygous cats for up to 6 years after lethal irradiation and reconstitution with small numbers of autologous marrow cells (1 to 2 × 10⁷ nucleated marrow cells/kg).7,8 We assumed that hematopoiesis was stochastic, and that each decision (HSC self-renewal, HSC apoptosis, the commitment of HSC to a differentiation pathway, and the time from the initiation of differentiation to the exhaustion of a differentiating clone) was determined by chance. We compared simulated transplantation studies and our data to derive possible probabilities for each decision.8 These probabilities were then used to simulate gene therapy. For each experiment, HSC were labeled and then “transplanted” into a computer, rather than into a cat. Burst-forming unit erythroids (BFU-E) and colony-forming unit granulocyte macrophages (CFU-GM) were “sampled” every 4 weeks from the differentiating cell compartment during 6 years of computational time so that the simulated data contained the biological and measurement variance seen in data obtained from studies in cats.
MATERIALS AND METHODS
The general approach used to simulate transplantation is detailed in a previous report.8 For each experiment, HSC were labeled and then “transplanted” into the stem cell reserve (see Fig 1). Studies used the Splus statistical programming language and the cc C compiler on a network of Sun, Sgi, and Dec workstations.
A two compartment model of hematopoiesis. Hematopoietic stem cells have three possible fates: replication (self-renewal), which occurs with intensity λR ; the initiation of a differentiation/maturation program, which occurs with intensity μR ; and apoptosis, which occurs with intensity αR . Hematopoiesis was simulated assuming all determinations were determined by chance. Progenitor cells (BFU-E and CFU-GM) are sampled from the contributing clone compartment each 4 weeks for 6 years to mimic feline studies.
A two compartment model of hematopoiesis. Hematopoietic stem cells have three possible fates: replication (self-renewal), which occurs with intensity λR ; the initiation of a differentiation/maturation program, which occurs with intensity μR ; and apoptosis, which occurs with intensity αR . Hematopoiesis was simulated assuming all determinations were determined by chance. Progenitor cells (BFU-E and CFU-GM) are sampled from the contributing clone compartment each 4 weeks for 6 years to mimic feline studies.
In most simulations, the intensity of replication λR = p(HSC replication) = 1 per 10 weeks; the intensity of apoptosis αR = p(HSC apoptosis) = 0; the intensity of initiating a differentiation/maturation program μR = p(HSC differentiation) = 1 per 12.5 weeks, and the intensity of extinction μC = p(exhaustion of a differentiating clone) = 1 per 6.7 weeks. These values were derived from the analysis of data from G6PD heterozygous cats.8 Rates of apoptosis, αR of 1 per 100 weeks and 1 per 50 weeks, were also used in some instances. In these cases, λR was increased by the value of αR .8
For each study, 100 experiments were independently simulated. Results were plotted as the percent of marked progenitor cells at each time point of observation. A “successful” outcome was defined as observing ≥5% marked cells after week 100. The number of the 100 simulations in which ≥5% marked cells were observed at week 101 is recorded in Table 1. The number of the 100 simulations in which ≥1% of marked cells were observed at week 101 is also recorded. Although there is arbitrariness to this criterion, the conclusions did not change when data were analyzed at week 105, and the results were supported by visual review of the 100 simulations in each instance.
Contributions of Labeled Progenitor Cells to Hematopoiesis
| No. of Transplanted HSC . | Biological Effect of Label . | No. of Simulations with ≥5% Labeled . | No. of Simulations with ≥1% Labeled . | |
|---|---|---|---|---|
| Labeled . | Total . | . | Progenitor Cells at Week 101 . | Progenitor Cells at Week 101 . |
| 1 | 30 | None | 18 | 19 |
| 2 | 30 | None | 29 | 37 |
| 6 | 30 | None | 72 | 79 |
| 2 | 300 | None | 1 | 20 |
| 20 | 300 | None | 58 | 98 |
| 2 | 1,500 | None | 0 | 4 |
| 2 | 300 | 2 × p(HSC replication) | 90 | 90 |
| 2 | 300 | 2 × p(HSC differentiation) | 0 | 0 |
| 2 | 300 | 1/2 × p(HSC differentiation) | 70 | 86 |
| 2 | 300 | 1/2 × p(HSC apoptosis) | 16 | 41 |
| 2 | 300 | 1/2 × p(exhaustion of differentiating clone) | 6 | 27 |
| 2 | 1,500 | 2 × p(HSC replication) | 88 | 89 |
| 2 | 1,500 | 2 × p(HSC differentiation) | 0 | 0 |
| 2 | 1,500 | 1/2 × p(HSC differentiation) | 19 | 67 |
| 2 | 1,500 | 1/2 × p(HSC apoptosis) | 0 | 11 |
| 2 | 1,500 | 1/2 × p(exhaustion of differentiating clone) | 0 | 14 |
The number of simulations with ≥1% labeled progenitor cells at week 101 after transplantation with two labeled HSC and 300 total HSC were compared to determine whether a label with a biological effect resulted in a significantly different outcome than that of a neutral label. P values using chi-square tests for equality of proportions were <.0001 for simulations with 2 × p(HSC replication), 2 × p(HSC differentiation), and 1/2 × p(HSC differentiation). P = .002 for 1/2 × p(apoptosis). The P value (.32) for simulations with 1/2 × p(exhaustion of differentiating clone) was not significant.
In studies in which marked clones had a selective advantage, a twofold increase in HSC replication or commitment to a differentiation/maturation program were defined as λR = 1 per 5 weeks and μR = 1 per 6.25 weeks, respectively. Similarly, one-half chance of exhaustion of a differentiation clone was defined as μc = 1 per 13.4 weeks. For studies in which marked clones had one-half chance of apoptosis, αR = 1 per 100 weeks or 1 per 50 weeks for unmarked HSC and 1 per 200 weeks or 1 per 100 weeks for marked HSC, respectively. For computational convenience, the size of the hematopoietic reserve (N) was limited to 750 for the experiments with 300 transplanted HSC, and 2,000 for the experiments with 1,500 transplanted HSC. The inclusion of an upper limit had minor effects only on the rate at which marked clones dominated hematopoiesis and did not affect any conclusions. This effect was most noted in the simulations where marked HSC had twice the replication potential of unmarked cells. In this circumstance, marked clones dominated hematopoiesis in 90% of the 100 simulations with N = 750 and 86% of 100 simulations with unlimited N. When N = 750, the mean time until marked cells supported 50% of hematopoiesis was 72 ± 17 weeks (median, 69 weeks). With an unlimited N, mean and median values were 59 ± 11 weeks and 57 weeks.
RESULTS
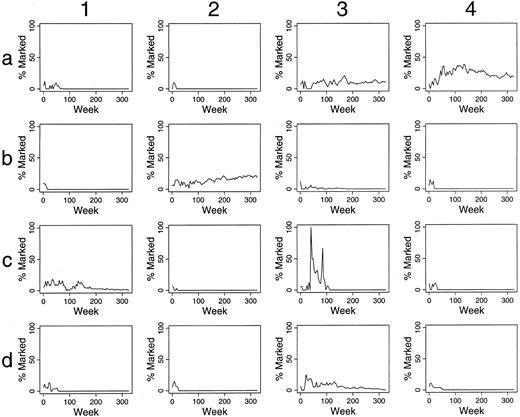
Simulations of gene therapy when differing numbers and percents of HSC are labeled.When one of 30 transplanted HSC was labeled, only small, often short-lived contributions of marked clones to hematopoiesis were seen (data not shown). When two of 30 HSC are marked, contributions over 5%, after 100 weeks, are present in 29 of 100 outcomes (29%) (Fig 2 and Table 1). When six of 30 HSC were marked, 72% of outcomes were “successful” by this definition (Table 1). Also, there was often significant variation in the contribution of marked clones over time, and in certain instances this variation was dramatic, implying that infrequent observations of in vivo transplantation could result in inappropriate conclusions. For example, in panel c3 of Fig 2, no marked clone contributed to hematopoiesis at 20 weeks, but all active clones were marked at 45 weeks after transplantation.
Simulations of gene therapy in which two marked cells were included among the 30 transplanted HSCs. The percent of marked cells (BFU-E and CFU-GM) is plotted during 300 weeks (6 years) following transplantation. The results of the first 16 independent studies are shown. Accumulated data from all 100 simulations are in Table 1.
Simulations of gene therapy in which two marked cells were included among the 30 transplanted HSCs. The percent of marked cells (BFU-E and CFU-GM) is plotted during 300 weeks (6 years) following transplantation. The results of the first 16 independent studies are shown. Accumulated data from all 100 simulations are in Table 1.
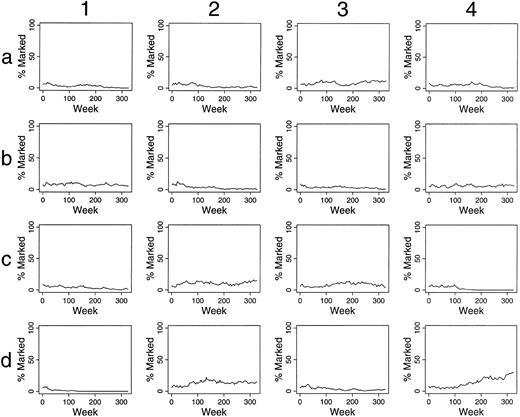
This variability is minimized if one transplants high numbers of HSC. If 20 of 300 HSC are marked, 58% of outcomes are successful (Fig 3). However, our prior studies8 suggest that 300 HSC are present per 5 × 10⁸ feline mononuclear marrow cells, so that significant enrichment of these cells would be required to allow a multiplicity of infection sufficient to ensure virion:receptor contact. HSC quiescence is a further concern for retroviral mediated gene transfer.9 Thus, technical issues make this broad approach of increasing target cell number, but retaining the percent of labeled cells, problematic.
Simulations of gene therapy in which 20 marked cells were included among the 300 transplanted HSCs.
Simulations of gene therapy in which 20 marked cells were included among the 300 transplanted HSCs.
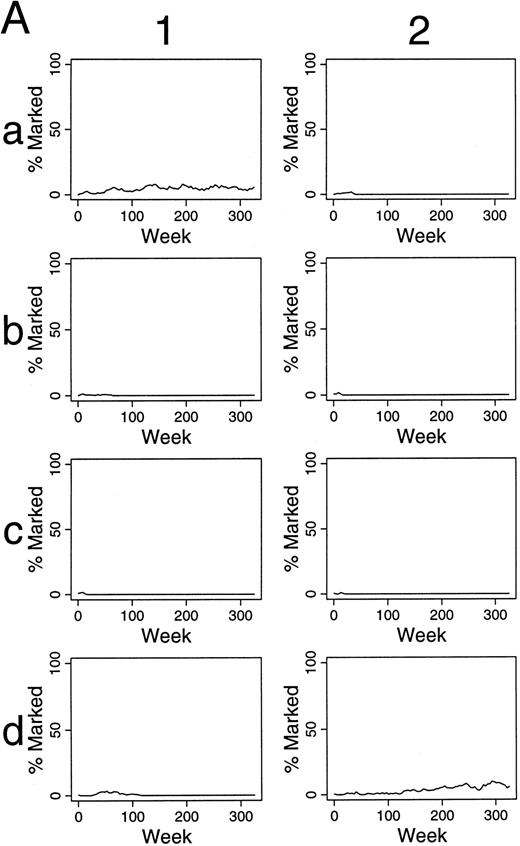
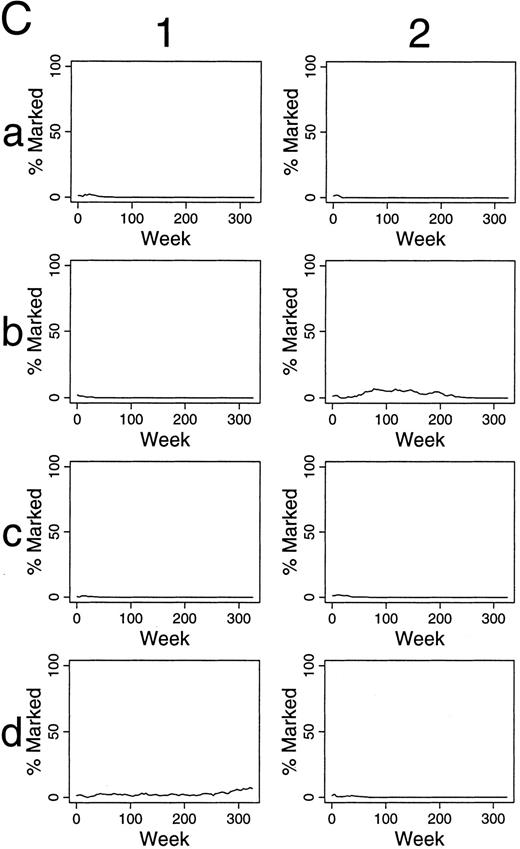
For these reasons, simulations were performed assuming that two of 300 HSC were marked. Continuous contributions of marked clones to hematopoiesis of >5% for over 100 weeks was seen in only one of 100 experiments. Contributions over 1% for over 100 weeks was seen in 20% of these simulations (Fig 4A). Similarly, if two of 1,500 HSC were labeled, contributions over 1% for over 100 weeks were seen in 4% of simulations (Table 1), and only 31% of the simulations had any contribution from marked clones at time points after 100 weeks. The contributions were intermittent and as low as 0.09%.
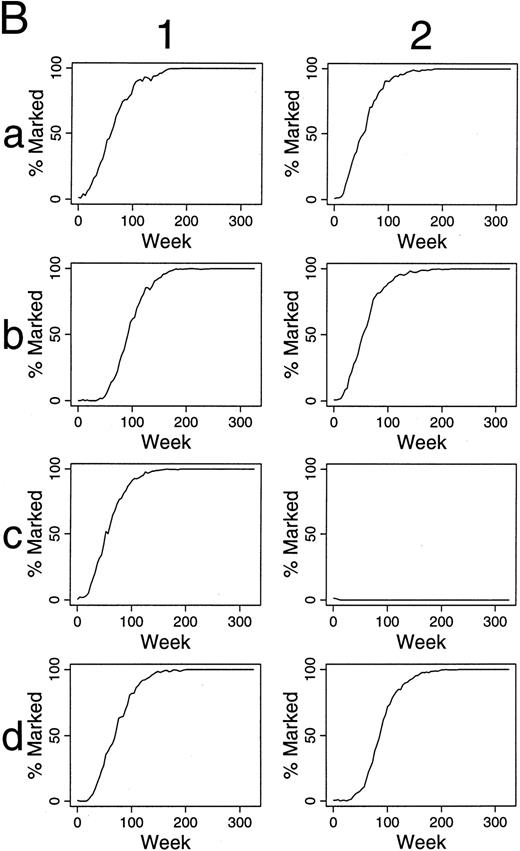
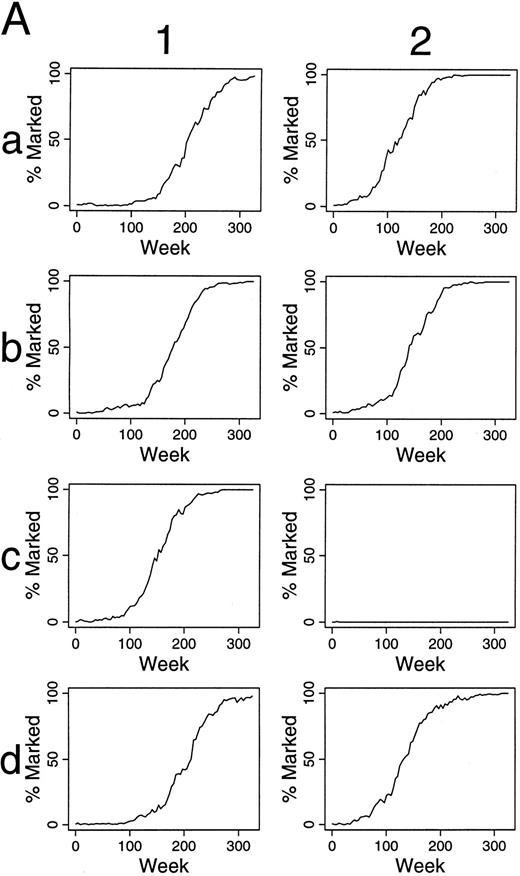
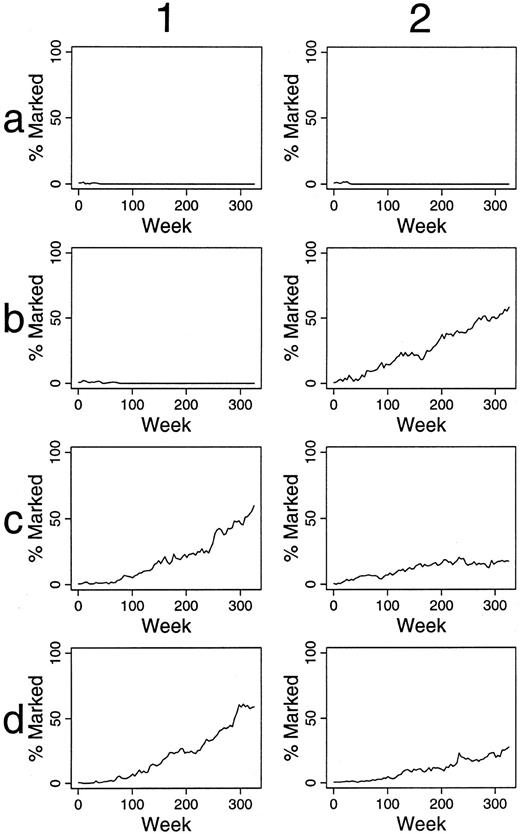
Simulations of gene therapy in which two marked cells were included among the 300 hematopoietic stem cells (A). In the comparable simulations of (B) and (C), however, the label is not neutral. In (B), it confers a twofold self-renewal advantage to HSC, ie, the p(HSC replication) for marked cells is two times that of unmarked cells.
In the simulations of (C), a marked clone has a one-half chance of exhaustion when compared with unmarked clones, ie, the p(exhaustion of a differentiating clone) is one-half that of unmarked clones.
Simulation of gene therapy when the labeled cells have a selective advantage.Different patterns of contributions were seen if marked HSC had a self-renewal, survival, and/or proliferative advantage. For example, if the label was not neutral, but rather conferred a twofold increase in replication (self-renewal) rate (when compared with unmarked HSC), 90% and 88% of experiments were successful when two of 300 HSC and two of 1,500 transplanted HSC were labeled, respectively (Fig 4B and Table 1). Eventually, marked clones dominated hematopoiesis in each successful study (Fig 4B). As seen in Fig 4C, if the transferred gene allowed differentiating clones to contribute to hematopoiesis for twice as long, but did not influence HSC kinetics, the effects were far less dramatic, and outcomes after 100 weeks were not significantly improved from studies with a neutral label (P = .32, chi-square analysis, Table 1).
As shown in Table 1, increasing the chance that an HSC initiates a differentiation/maturation program has negative impact. Conversely, decreasing the chance that an HSC differentiates (Fig 5A), leads to increasing numbers of marked HSC, and late contributions of these marked cells to hematopoiesis. The kinetics of this effect is shown in Fig 5B.
Simulations of gene therapy in which two marked cells are included among the 300 transplanted HSCs. Marked cells have one-half the chance of differentiation as unmarked HSC. In this circumstance, marked clones often dominate hematopoiesis, sometimes requiring 250 weeks from transplantation, however. The kinetics by which labeled hematopoietic stem cells dominate hematopoiesis are shown in (B). Column 1 shows the kinetics of the outcome seen in experiment a1 of (A). Marked clones first dominated the hematopoietic stem cell reserve, and then the contributing clone compartment. The last two rows of column 1 shows this effect in terms of the number of marked (solid line) and unmarked (dotted line) cells within the hematopoietic stem cell reserve, and the number of marked and unmarked clones contributing to hematopoiesis, respectively. Column 2 presents the additional data from experiment b2 of (A) and shows a similar kinetics.
Simulations of gene therapy in which two marked cells are included among the 300 transplanted HSCs. Marked cells have one-half the chance of differentiation as unmarked HSC. In this circumstance, marked clones often dominate hematopoiesis, sometimes requiring 250 weeks from transplantation, however. The kinetics by which labeled hematopoietic stem cells dominate hematopoiesis are shown in (B). Column 1 shows the kinetics of the outcome seen in experiment a1 of (A). Marked clones first dominated the hematopoietic stem cell reserve, and then the contributing clone compartment. The last two rows of column 1 shows this effect in terms of the number of marked (solid line) and unmarked (dotted line) cells within the hematopoietic stem cell reserve, and the number of marked and unmarked clones contributing to hematopoiesis, respectively. Column 2 presents the additional data from experiment b2 of (A) and shows a similar kinetics.
If the transferred gene decreases the chance of apoptosis, improved outcomes were also observed (Table 1 and Fig 6). Taken together, it appears that when one increases the number of marked HSC by changing any parameter (eg, an increase in λR , decrease in αR , or an decrease in μR ), labeled HSC accumulate within the stem cell reserve, and increasing percentages of marked progenitor cells are seen over time.
Simulations of gene therapy in which two marked cells were included among the 300 transplanted HSCs. For these simulations, the apoptosis of unmarked HSC occurred on average once per 50 weeks. The chance of apoptosis for marked cells was one-half that of unmarked HSC. This manipulation led to persistence of a marked clone in most simulations (eg, panels 1c, 1d, 2b, 2c, and 2d). The percentage of marked progenitor cells increased slowly over time in these cases.
Simulations of gene therapy in which two marked cells were included among the 300 transplanted HSCs. For these simulations, the apoptosis of unmarked HSC occurred on average once per 50 weeks. The chance of apoptosis for marked cells was one-half that of unmarked HSC. This manipulation led to persistence of a marked clone in most simulations (eg, panels 1c, 1d, 2b, 2c, and 2d). The percentage of marked progenitor cells increased slowly over time in these cases.
DISCUSSION
Retroviral vector systems have been used for most gene therapy targeting HSC because proviral DNA is integrated into the genome of the target cell and thus will be retained and expressed in all progeny cells, including differentiating and mature blood cells.1-3,9 However, efficient gene transfer requires a high multiplicity of infection (the ratio of viral particles to cells should exceed 5:1). As supernatants from amphotropic producer lines generally have 105 to 106 virions per mL, further concentration of virions, or a significant enrichment of HSC, is required to achieve these ratios. This task is technically simpler if one transplants small numbers of HSCs. In the simulated experiments of Fig 2, 30 HSC were transplanted. This number of HSC is likely present among 5 × 10⁷ mononuclear cells, and thus corresponds to the number of HSC present when 1 to 2 × 10⁷ nucleated marrow cells/kg were transplanted into 3 to 4 kg G6PD heterozygous cats.8 The results suggest that after transplantation of 30 HSC, stochastic differentiation, itself, can lead to varied outcomes, as well as inconsistent contributions of marked clones to hematopoiesis over time.
When larger numbers of hematopoietic stem cells are infused, it is technically more difficult to infect high percentages of these cells. Also, in all circumstances, retroviral gene transfer may be limited by receptor display on HSC,10 by the affinity of amphotropic receptor for virion, and by the cell cycle kinetics of the target cell (as HSC division is required for proviral integration). It is of interest that data such as that presented in the text, Fig 4A and Table 1, where two of 300 to 1,500 HSC were labeled, predict the minimal successfulness of feline, canine, and primate gene transfer experiments to date.11-13 When two of 1,500 cells were labeled, contributions were intermittent and often as low as 0.09%, consistent with the sporadic detection of transduced cells by PCR. Even when two of 300 HSC were labeled, contributions were generally small and short-lived, lasting less than 20 to 100 weeks (Fig 4A). Thus, the only prediction of our simulation studies that is testable with current methodology is compatible with observed data.
In many clinical situations, the underlying defect involves a hematopoietic cell and renders that cell at a survival or proliferative disadvantage. In these circumstances, hematopoietic cells are not solely a passive vehicle for gene expression. Rather, a corrected HSC or its progeny may have a competitive advantage. For example, red cells of patients with sickle cell disease have shortened survivals (10 to 20 days) in contrast to normal red cells (survival within the circulation, 120 days). Thalassemic red cells lyse during maturation within the marrow space. A similar ineffective erythropoiesis exists in a murine model of beta thalassemia. When affected neonatal mice are infused with normal fetal liver cells, a very small percentages (1%) of HSC are corrected, yet large numbers (eg, 30%) of normal red cells may accumulate.14 In principle, in vivo selection should apply in larger animals, or humans, but the kinetics and magnitude of this effect is less certain. Figure 4C shows simulation experiments where marked clones have one-half the probability of exhaustion as unmarked clones, and thus on average contribute for hematopoiesis for twice as long. Effects are far less significant than might be anticipated for globin disorders (where mature red cells have a >10-fold survival advantage). However, a twofold competitive advantage has a major impact when in vivo selection occurs at the level of HSC, and marked clones eventually dominate hematopoiesis in most experiments, as seen in Figs 4B, 5A, and 6. Although a possible strategy for efficient gene therapy, these kinetics may in fact describe the biology of the myeloproliferative disorders, including chronic myelogenous leukemia and Polycythemia vera. Interestingly, defective HSC (that are half as likely to commit to a differentiation program as normal cells) also dominate the hematopoietic reserve over time (Fig 5A and B). One could hypothesize that this is the mechanism for the dominance of a “defective” stem cell clone in patients with marrow aplasia.15-17
The studies presented in this report result from the simulation of hematopoiesis, not actual animal experiments. The parameters for simulation were derived from observations in G6PD heterozygous cats and are dependent on a single assumption, that stem cell fates are stochastic.8 The results provide both cautions and ideas regarding the design of optimal gene therapy. When techniques are developed to transduce cells more efficiently, and thus achieve a higher percentage of labeled cells, will the successful outcomes of Fig 3 be achieved? If the transferred gene alters the kinetics of HSC, will this cause a myeloproliferative disease and/or acute leukemia? If an initial experiment is a success, is this a chance occurrence (see Fig 2, panel a4) or the expected outcome of the experimental design? These questions need to be answered with improved technologies, creative experimental strategy, and animal studies.
As all simulations presented in this report model feline hematopoiesis, a direct extension of these results to human gene therapy is also premature. It is likely, however, that the broad concepts will apply. We are beginning to analyze hematopoiesis in the mouse by comparing data from transplantation studies with limited numbers of HSC to the data from simulation. Once probabilities for the stochastic decisions of murine HSC are determined by this approach, we will compare these results with the probabilities deduced from feline studies, and may be able to derive the principles that govern the evolutionary adaptation of hematopoiesis to increasing longevity and size, and predict probabilities for the replication/differentiation decisions of human HSC. If so, gene therapy targeting human HSC could be simulated, which should provide a powerful technique to optimize clinical strategies.
ACKNOWLEDGMENT
The authors thank Allan Dimaunahan for help in preparation of the manuscript.
Supported by R01 HL46598 from the National Institutes of Health. Dr Abkowitz is the recipient of a Faculty Research Award from the American Cancer Society.
Address reprint requests to Janis L. Abkowitz, MD, Division of Hematology, University of Washington, Box 357710, Seattle, WA 98915-77100.



This feature is available to Subscribers Only
Sign In or Create an Account Close Modal