Abstract
The consequences of long-term in vivo expression of human c-mpl ligand in a mouse model were examined. Transgenic mice expressing the human full-length cDNA in the liver exhibited a fourfold increase in circulating platelet count that persisted stably over the life of the animals. Transgenic animals thrived and appeared healthy for at least 500 days. Transgenic platelets appeared normal with respect to surface antigens and response to platelet aggregation agonists. The highest-expressing transgenic line maintained human c-mpl ligand serum levels of 3 ng/mL. Megakaryocyte numbers in bone marrow and spleen were elevated, as were bone marrow and spleen megakaryocyte colony-forming cells (MEG-CFC). Megakaryocytes were observed in the bone marrow, spleen, liver, and lung, but in no other sites. Circulating myeloid and lymphoid cell populations were increased twofold. Additionally, the animals had a slight but significant anemia despite an increase in marrow colony-forming units-erythroid (CFU-E). No evidence of myelofibrosis was observed in the bone marrow. The platelet nadir in response to administration of either antiplatelet serum (APS) or 5-fluorouracil (5FU) was significantly reduced relative to the control level. Furthermore, the red blood cell (RBC) nadir was reduced relative to control levels in both models, suggesting that c-mpl ligand can directly or indirectly support the maintenance of erythrocyte levels following thrombopoietic insult.
THROMBOCYTOPENIA associated with chemotherapy or autoimmune destruction is a significant clinical disorder.1 The ability to stimulate increased platelet production may be useful for the treatment of these conditions. Recently, several groups identified the cDNA for the c-mpl ligand, a cytokine that appears in the serum following induction of thrombocytopenia.2-6 This factor has been shown to have megakaryocytopoietic and thrombopoietic activity both in vitro and in vivo. Short-term administration of recombinant protein to either rodents3,4 or nonhuman primates7 has resulted in dose-dependent increases in the circulating platelet count. Furthermore, recombinant human megakaryocyte growth and development factor (rHuMGDF ), a recombinant human c-mpl ligand, appears to lessen the severity of thrombocytopenia in a murine model of carboplatin-induced thrombocytopenia.8
In the present study, we evaluated the in vivo effects of human c-mpl ligand in the mouse by transgenic expression of the cDNA using a liver-specific apolipoprotein E (ApoE) promoter.9 Expression of this transgene results in continuous secretion of human c-mpl ligand into the systemic circulation. The transgenic model provides sustained expression of foreign proteins usually lasting for the life of the animal. Such a model enables studies of chronic stimulation and allows examination of long-term effects or pathologies that may not be apparent when administering factor exogenously. This study examined the effects of c-mpl ligand protein on the hematopoietic lineages and in two models of experimentally induced thrombocytopenia.
MATERIALS AND METHODS
Construct and transgenic mice.A 1.2-kb Dra I/Nar I fragment containing the entire human c-mpl ligand coding region was cloned into an expression cassette downstream of the ApoE promoter with a 0.8-kb liver-specific enhancer region. Polyadenylation sequences were provided by a 375-bp region of the SV40 large T-antigen 3′-untranslated sequence.10 The construct was isolated from vector sequences as a Xho I/AflIII fragment and injected into one-celled fertilized FVB embryos as previously described.11 FVB mice were obtained from Charles River Laboratories (Wilmington, MA). The laboratory mice used in these experiments were treated in accordance with established procedures and policies reviewed by the Laboratory Animal Research Committee (LARC) at Amgen Inc. It is the policy of the LARC to adhere to regulations and guidelines established by the Animal Welfare Act and Public Health Service policy. Transgenic mice were identified by polymerase chain reaction using oligonucleotide primers specific for the human c-mpl ligand sequence: forward 5′-TCTGCTGAACCAAACCTCCAG-3′ and reverse 5′-CTTCCTGAGACAGATTCTGGG-3′.
Blood analysis.One hundred microliters of blood from the lateral tail vein was mixed with vol 3% EDTA and examined on a Technicon H1-E hematology analyzer (Myles, Tarrytown, NY) between 30 and 45 minutes after collection. Hematologic parameters examined included white blood cell count, red blood cell (RBC) count, hemoglobin, hematocrit, platelet count, mean platelet volume (MPV), and percentages of neutrophils, lymphocytes, monocytes, eosinophils, basophils, and large unstained cells.
Histology.Tissues from adult mice were harvested from normal and transgenic animals, fixed in 10% zinc-Formalin, and embedded in paraffin. Femurs were additionally decalcified for 1 hour following fixation. Tissues were cut into 4-μm sections and stained with hematoxylin/eosin (Fisher, Pittsburgh, PA) for examination. Megakaryocyte numbers in bone marrow and spleen were determined by photographing the sections at 200× magnification and then counting megakaryocytes in the photograph and determining the size of the photographic field. Data are presented as cells per 0.5-mm2 area. Megakaryocyte numbers in the liver and lung were determined by counting the number of megakaryocytes in a number of sections from at least three different animals and then calculating the total area of the sections. Megakaryocytes were identified based on defined criteria.12 In addition, representative sections were immunostained with an antibody to von Willebrand factor. The number of positively staining cells was similar to the number obtained by morphologic identification.
Colony assays.For the megakaryocyte colony-forming cell (MEG-CFC) assay, bone marrow cells were obtained by femoral aspiration and spleen cells by manual dissociation of spleen tissue. Five times 104 bone marrow cells (5 × 10⁵ spleen cells) were plated in McCoy's supplemented medium containing 15% fetal calf serum and 0.4% agar with addition of murine interleukin-3 (IL-3) (0.02 μg/mL), human IL-6 (0.1 μg/mL), human IL-11 (0.02 μg/mL), and rHuMGDF (0.1 μg/mL). The plates were incubated for 7 days at 37°C in 10% CO2 and then removed, fixed for 10 minutes with 1% glutaraldehyde in 0.1 mol/L phosphate buffer, pH 6.0, rinsed, dried overnight on glass slides, and stained for 4 hours in an acetylcholinesterase (AchE) solution.13 Colonies containing three large AchE-positive cells were counted. All experiments were performed in triplicate. For the colony-forming unit-erythroid (CFU-E) assay, 5 × 10⁴ bone marrow cells were plated in supplemented Iscove's modified Dulbecco's medium containing 0.1 U/mL erythropoietin and 0.92% methylcellulose. Plates were incubated at 37°C in 10% CO2 for 3 days, removed, and counted.
Serum enzyme-linked immunosorbent assay.Ninety-six–well plates were coated with 100 μL 2-μg/mL protein A–purified rabbit anti-rHuMGDF polyclonal antibody. Fifty microliters of serum from either transgenic or control animals was diluted with 50 μL 0.05% Tween 20 in phosphate-buffered saline (PBS), added to the coated well, incubated, washed in 0.05% Tween 20 in PBS, and visualized using a peroxidase-conjugated anti-rHuMGDF polyclonal antibody. The signal was quantified using a standard curve of purified rHuMGDF.
Phenotyping.One hundred microliters of whole blood was collected into 3 mL 10-mmol/L EDTA/PBS, and platelet-rich plasma (PRP) was obtained by low-speed centrifugation (350g for 15 minutes at 20°C). Platelet count was determined using an H1-E hematology analyzer. Two million platelets were then incubated with 1 μg of the desired antibody in 50 μL 10-mmol/L EDTA/PBS for 30 minutes at room temperature, washed twice in PBS, and stained for 20 minutes with a fluorescein isothiocyanate–conjugated secondary antibody. The first and second antibodies, respectively, were: anti-CD11a (LFA-1) and rat IgG2b; anti-CD29 (integrin-β1 ) and rat IgG2a; anti-CD61 (Gp IIIa) and hamster IgG (all from PharMingen, San Diego, CA). Flow cytometry was performed on a Becton Dickinson FACScan (Mountain View, CA). Platelets were identified by their characteristic forward and side light-scatter in logarithmic acquisition mode.
Mouse platelet aggregometry.Approximately 700 to 900 μL of whole blood was collected from the inferior vena cava into a syringe containing 100 μL heparin solution, resulting in a final heparin concentration of approximately 5 U/mL. Anticoagulated whole blood from five mice was pooled, and PRP was prepared by low-speed centrifugation. The plasma supernatant was aspirated and counted in a Coulter (Hialeah, FL) counter to determine the platelet count. The underlying RBC/white blood cell layer was then centrifuged at 2,000g for 15 minutes to obtain platelet-poor plasma (PPP). The platelet count in PRP was adjusted to 250,000/μL using autologous PPP as a diluent. Aggregometry experiments were conducted in a Chrono-log lumi-aggregometer (Chrono-log, Havertown, PA) using 250 μL PRP added to prewarmed siliconized glass cuvettes and continually stirred at 1,000 rpm. Increases in light transmission were recorded on an analog chart recorder and converted to percent platelet aggregation using the optical absorbance of PRP and PPP as a reference for 0% platelet aggregation and 100% platelet aggregation, respectively.
Aggregation of nontransgenic FVB mouse platelets using a subthreshold (weak-aggregating) concentration of collagen (1 μg/mL, equine tendon) was tested in PRP from FVB mice in the presence or absence of rHuMGDF (1 μg/mL) added directly to PRP. Individual platelet aggregometry responses were assumed to conform to a sigmoid curve and were mathematically fit to a commonly used four-parameter logistic function. Each sigmoidal plot was visually inspected to confirm an appropriate fit to the raw data. The AC50 value, ie, the concentration of agonist that produces 50% of maximum aggregation, was calculated mathematically by solving the logistic function for an “x” value (agonist concentration) using the computer-determined parameters and the “y” value (percent aggregation) set to half the maximum aggregation response for each experiment.
5-Fluorouracil administration.Ten AM107 mice and 10 control littermates were injected intraperitoneally on day 0 with 5-fluorouracil (5FU) 150 mg/kg body weight. The animals were divided into two sets and were bled on day 4 or day 6 to confirm that the injections were successful (multiple hematopoietic lineages were monitored and observed to be affected). Blood analysis was performed as described earlier. Assay points were staggered by 2 days for the two groups such that blood samples from each group were monitored every 4 days for the duration of the experiment, to minimize potential effects of the blood draw alone. Control experiments using saline injections demonstrated that this monitoring scheme had no effect on hematopoietic parameters.
Antiplatelet serum administration.One hundred microliters of a 1:2 dilution of rabbit anti-mouse platelet serum (APS) (Inter-cell Technologies Inc, Hopewell, NJ) was injected intraperitoneally into 12 AM107 and 12 control littermates. A 1:2 dilution was chosen because it produced the most profound platelet reduction in AM107 mice and yet was tolerated by the control group. This concentration is 10-fold higher than that required to cause a greater than 90% platelet reduction in control mice. A higher dose (100 μL undiluted serum) was tried, but led to significant morbidity in the control group. Platelet counts were monitored the next day to demonstrate that the treatment was effective. The animals were then divided into three groups of four to minimize potential effects of the blood draw alone. Group one was then bled on days 3 and 9, group two on day 5, and group three on day 7. Control experiments in which a 1:2 dilution of preimmune rabbit serum was injected showed no effect on platelet count.
RESULTS
A construct consisting of the ApoE promoter driving the expression of a human full-length (332 amino acids) c-mpl ligand cDNA was injected into one-celled fertilized mouse embryos. Transgenic founder mice were identified by transgene-specific amplification of genomic DNA using the polymerase chain reaction. Two transgenic lines were established and analyzed further.
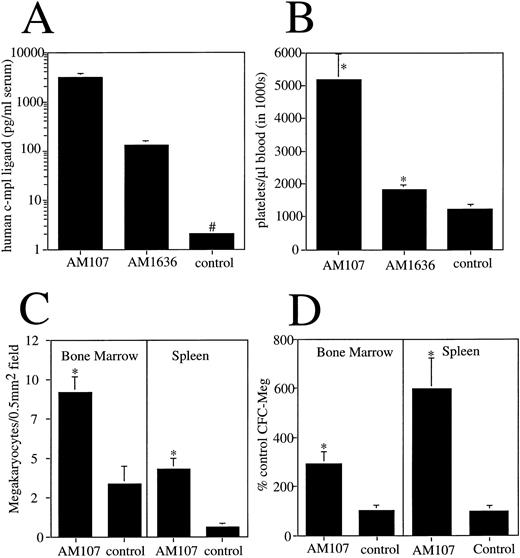
Serum from F1-generation mice from each line was analyzed for human c-mpl ligand protein levels using a human c-mpl ligand enzyme-linked immunosorbent assay. Line AM107 expressed (mean ± SD) 3 ± 0.64 ng/mL serum, and line AM1636 expressed 130 ± 8 pg/mL serum. Appropriately, control littermates had undetectable levels of human c-mpl ligand in serum (<10 pg/mL) (Fig 1A).
Expression and effects of human c-mpl ligand cDNA in transgenic mice. (A) Serum levels of human c-mpl ligand protein in transgenic lines. #Less than 10 pg/mL. n ≥ 4. (B) Platelet count in AM107 and AM1636 lines and control littermates aged 6 to 12 weeks. n ≥ 10. *P < .001 v control. (C) Megakaryocyte number in bone marrow and spleen sections of AM107 and control littermates. Sections from 3 animals were used for each determination. *P < .001. (D) MEG-CFC numbers in bone marrow and spleen of AM107 and control littermates. Data are presented as % control level (control level = 85 ± 8 per 105 bone marrow cells and 7 ± 2 per 106 spleen cells). n = 3. *P < .01.
Expression and effects of human c-mpl ligand cDNA in transgenic mice. (A) Serum levels of human c-mpl ligand protein in transgenic lines. #Less than 10 pg/mL. n ≥ 4. (B) Platelet count in AM107 and AM1636 lines and control littermates aged 6 to 12 weeks. n ≥ 10. *P < .001 v control. (C) Megakaryocyte number in bone marrow and spleen sections of AM107 and control littermates. Sections from 3 animals were used for each determination. *P < .001. (D) MEG-CFC numbers in bone marrow and spleen of AM107 and control littermates. Data are presented as % control level (control level = 85 ± 8 per 105 bone marrow cells and 7 ± 2 per 106 spleen cells). n = 3. *P < .01.
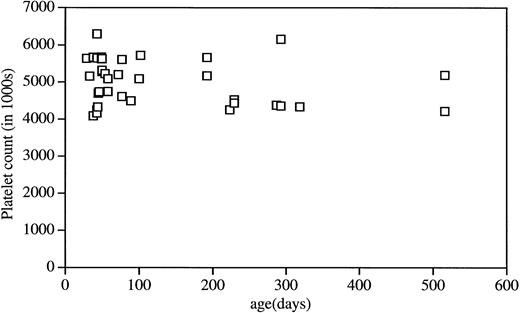
Peripheral blood analysis using a Technicon H1-E hematology analyzer showed a c-mpl ligand level–dependent increase in the circulating platelet count. F1 mice from the highest-expressing line, AM107, had a mean platelet count greater than four times normal at 5.2 × 10⁶/μL (±784,000 SD). Line AM1636 had more modest increases in the platelet count, with a mean of 1.9 × 10⁶/μL (±85,000 SD), and control littermates had a mean of 1.2 × 10⁶/μL (±144,000 SD; v either transgenic line, P < .001) (Fig 1B). MPV in line AM107 was slightly increased (5.6 μm3v control value of 5.2 μm3, P < .001). Each line maintained a stable platelet level that was evident by 21 days of age (the first time point evaluated) and persisted for at least 500 days (the age of the oldest F1 animals). Platelet counts from line AM107 were monitored over time, and the results are plotted in Fig 2.
Platelet levels in AM107 mice at different ages. Data are presented as individual determinations of mice at the indicated age.
Platelet levels in AM107 mice at different ages. Data are presented as individual determinations of mice at the indicated age.
To determine whether the increased platelet count correlated with a change in megakaryocyte number, megakaryocytes in the bone marrow and spleen of AM107 mice were enumerated. Consistent with the increased platelet levels, there was a threefold increase in bone megakaryocytes in AM107 relative to control mice (92 ± 10 v 34 ± 11 per 0.5-mm2 field, P < .001). In the spleen, there was a sevenfold increase in megakaryocytes (43 ± 7 v 6 ± 3 per 0.5-mm2 field, P < .001) (Fig 1C). This is somewhat of an overestimate due to the increased size of megakaryocytes in the transgenic mice, which will lead to an increase in their representation in the tissue sections. In addition to megakaryocytes, the number of megakaryocyte precursors in AM107 bone marrow and spleen was determined by counting MEG-CFC. Relative to controls, there was a threefold increase in bone marrow MEG-CFC (P < .001) and a sixfold increase in spleen MEG-CFC (P < .001) (Fig 1D). This suggests that the basis for the increase in platelet count derives at least in part from c-mpl ligand activity functioning as early as the MEG-CFC progenitor cell.
Comparison of Platelet Surface Antigens on Purified Platelets From AM107 and Control Littermates
| Mice . | Platelets (× 103) . | Forward-Scatter . | Side-Scatter . | MFI . | ||
|---|---|---|---|---|---|---|
| . | . | . | . | CD11a . | CD29 . | CD61 . |
| AM107 | 4.0 ± 1.0 | 28 ± 6 | 20 ± 2 | 14 ± 3* | 25 ± 2 | 89 ± 6 |
| Control | 1.6 ± 0.3 | 29 ± 1.1 | 21 ± 1 | 22 ± 1* | 25 ± 1 | 85 ± 4 |
| Mice . | Platelets (× 103) . | Forward-Scatter . | Side-Scatter . | MFI . | ||
|---|---|---|---|---|---|---|
| . | . | . | . | CD11a . | CD29 . | CD61 . |
| AM107 | 4.0 ± 1.0 | 28 ± 6 | 20 ± 2 | 14 ± 3* | 25 ± 2 | 89 ± 6 |
| Control | 1.6 ± 0.3 | 29 ± 1.1 | 21 ± 1 | 22 ± 1* | 25 ± 1 | 85 ± 4 |
Data are presented as the mean ± SD of 6 individual animals for each group.
Abbreviation: MFI, mean fluorescence intensity.
P < .001.
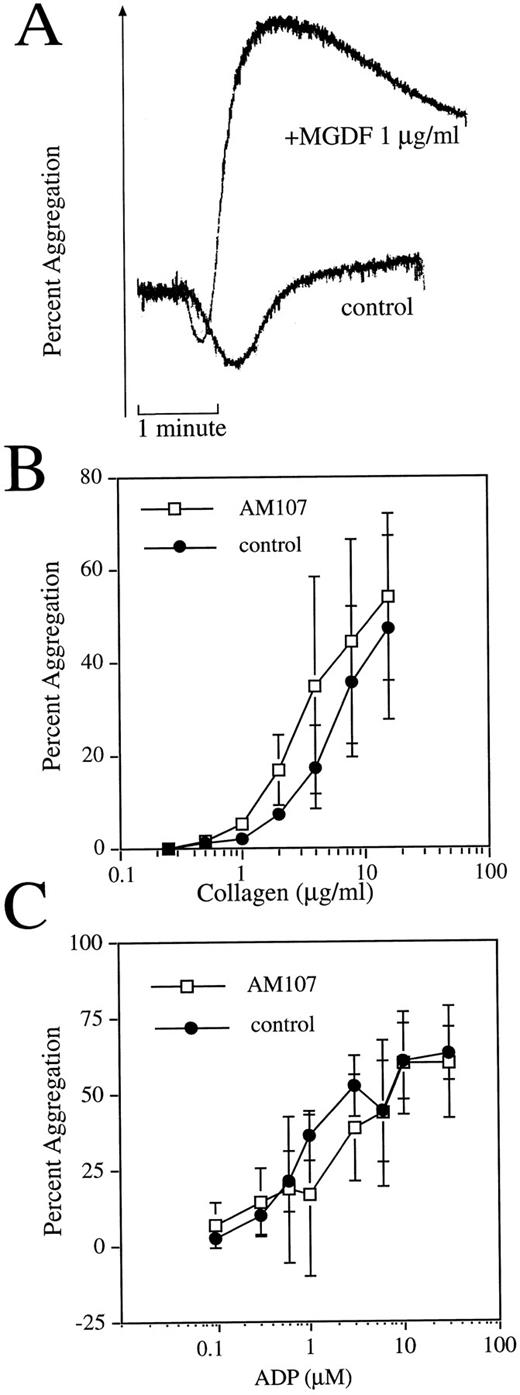
Purified transgenic platelets exhibit normal aggregation response. (A) c-mpl ligand enhances aggregation response in nontransgenic mice. Representative aggregation response to 1 μg/mL collagen with or without 1 μg/mL exogenously added rHuMGDF. (B) Comparison of collagen-induced aggregation response between AM107 and control littermates. n = 3. Data are the mean ± SD. AC50 , P = .89. (C) Comparison of ADP-induced aggregation response between AM107 and control littermates. n = 4. AC50 , P = .41.
Purified transgenic platelets exhibit normal aggregation response. (A) c-mpl ligand enhances aggregation response in nontransgenic mice. Representative aggregation response to 1 μg/mL collagen with or without 1 μg/mL exogenously added rHuMGDF. (B) Comparison of collagen-induced aggregation response between AM107 and control littermates. n = 3. Data are the mean ± SD. AC50 , P = .89. (C) Comparison of ADP-induced aggregation response between AM107 and control littermates. n = 4. AC50 , P = .41.
Values for Various Blood Parameters Determined by the H1-E Hematology Analyzer
| H1-E Selection Window . | Control . | AM107 . | P . |
|---|---|---|---|
| Hematocrit (%) | 42.2 ± 3.4 | 38.9 ± 1.9 | <.001 |
| Neutrophils (× 103) | 0.49 ± 0.21 | 1.10 ± 0.31 | <.001 |
| Lymphocytes (× 103) | 4.61 ± 0.96 | 7.45 ± 1.28 | <.001 |
| Monocytes (× 103) | 0.09 ± 0.03 | 0.27 ± 0.11 | <.001 |
| Eosinophils (× 103) | 0.09 ± 0.05 | 0.17 ± 0.15 | .013 |
| Basophils (× 103) | 0.02 ± 0.01 | 0.04 ± 0.04 | .011 |
Data are the mean ± SD of 24 individual animals from each group.
Because of the greatly increased platelet numbers in AM107 transgenic mice, it was important to determine whether transgenic platelets were functionally similar to control platelets. To characterize platelets from AM107 mice, platelet surface markers and platelet survival measurements were determined. Purified platelets were subjected to FACS analysis to examine several surface antigens thought to be involved in platelet function. The relative levels of CD61 (gpIIIa), VLB β-adherin marker CD29, and lymphocyte marker CD11a were determined on platelet preparations (Table 1). CD61 and CD29 levels were similar to those in control mice, whereas the CD11a marker was significantly reduced in transgenic platelets (63% of controls, P < .001).
To further examine platelet function, the aggregation response to two platelet agonists was examined. Some reports have indicated that platelets from normal mice display enhanced aggregation when rHuMGDF is exogenously added to PRP. To test for a rHuMGDF-enhanced aggregation response, experiments using PRP from normal FVB mice were first performed. Aggregation of mouse PRP was minimal in response to addition of 1 μg/mL collagen (Fig 3A). However, the extent of aggregation that occurred in the presence of 1 μg/mL rHuMGDF was clearly and consistently enhanced, indicating that FVB mouse platelets are sensitive to rHuMGDF-enhanced platelet aggregation.
Because the AM107 line exhibited nanogram levels of circulating c-mpl ligand, PRP from this line was studied with a range of concentrations of the aggregation agonist collagen to generate a concentration-response curve. Platelets from control littermates aggregated to collagen in a concentration-dependent fashion with an AC50 of 5.0 ± 2.1 μg/mL collagen (Fig 3B). Platelets isolated from AM107 mice also aggregated in a concentration-dependent manner and were indistinguishable from platelets obtained from nontransgenic animals, with an AC50 of 4.7 ± 2.8 μg/mL collagen (P = .89). Platelet aggregation was also assessed using adenosine diphosphate (ADP) as a platelet agonist. Platelets isolated from AM107 mice aggregated to ADP in a concentration-dependent manner and are indistinguishable from those of the control littermates (AC50 , 1.55 ± 1.16 v 1.02 ± 0.29 μmol/L ADP, P = .41) (Fig 3C). The similar response to collagen and ADP for both AM107 and control platelets suggests that the high circulating levels of c-mpl ligand do not induce an enhanced platelet aggregation response.
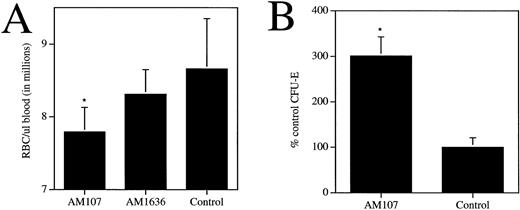
To determine any additional effects of c-mpl ligand overexpression on the hematopoietic compartment, other blood cell parameters were measured, including neutrophils, lymphocytes, monocytes, eosinophils, basophils, erythrocytes, and hematocrit (Table 2). A twofold increase in circulating levels of myeloid and lymphoid cells was observed, which contrasted with a slight decrease in the hematocrit and erythrocytes. Circulating erythrocyte levels in the AM107 line were 7.8 ± 0.34 × 10⁶/μL blood, versus 8.6 ± 0.69 × 10⁶/μL (P < .001) for control littermates (Fig 4A). Hematocrit values, consistent with the erythrocyte numbers, exhibited an approximately 10% decrease in AM107 versus control mice (Table 2). AM1636 mice, which exhibited a modest thrombocytosis, had normal erythrocyte and hematocrit levels. Despite the observed anemia, quantitation of CFU-E from the bone marrow of AM107 mice showed a threefold increase in the number of erythroid colonies relative to control levels (P < .001) (Fig 4B).
c-mpl ligand affects circulating and progenitor erythroid cells. (A) Circulating RBCs in AM107, AM1636, and control littermates. AM1636, n = 10; AM107, n = 24; control, n = 23. *P < .001. AM1636 not significantly different from control littermates (P = .14). (B) Bone marrow CFU-E in AM107 and control littermates. Data are presented as % control values (control = 74 ± 21 per 50,000 cells). n = 4. *P < .001.
c-mpl ligand affects circulating and progenitor erythroid cells. (A) Circulating RBCs in AM107, AM1636, and control littermates. AM1636, n = 10; AM107, n = 24; control, n = 23. *P < .001. AM1636 not significantly different from control littermates (P = .14). (B) Bone marrow CFU-E in AM107 and control littermates. Data are presented as % control values (control = 74 ± 21 per 50,000 cells). n = 4. *P < .001.
To further characterize direct or indirect effects of c-mpl ligand expression, a number of tissues from AM107 mice were examined histologically. In addition to the noted increase in megakaryocyte number, the size was also increased relative to that of control mice (Fig 5A and B). Otherwise, bone marrow architecture appeared normal, with no observed fibrosis or altered bone formation. Blood smears confirmed the thrombocytosis, yet no megakaryocytes were observed in circulating blood (data not shown). Examination of the spleens of these mice showed a modest splenomegaly of approximately two times the normal spleen weight. Microscopic examination showed increased numbers of megakaryocytes in red pulp regions of the spleen relative to control sections (Fig 5C and D). Megakaryocytes were also observed in low numbers in the liver (Fig 5E) and lung (Fig 5F ) of the AM107 line. In AM107 lung sections, 95 megakaryocytes or megakaryocyte nuclei/cm2 were observed, versus 8/cm2 in control sections (P < .001). In AM107 liver sections, 32 megakaryocytes/cm2 were observed, versus none in the same area of control sections (1.4-cm2 area counted). No abnormalities were observed in lymph node, digestive tract, or kidney, nor was there any evidence of thrombosis or vascular occlusion. Taken together, these observations suggest that the megakaryocytosis and consequent thrombocytosis is the primary effect of c-mpl ligand overproduction in the liver. The pathology observed in these mice was primarily limited to the presence of extramedullary megakaryocytes in several tissues, including the spleen, which appeared to cause the observed splenomegaly. These findings suggest that the thrombocytosis is well tolerated in the mice.
Megakaryocytosis in transgenic mice. Four-micron formalin-fixed sections from AM107 (A, C, E, and F ) and control (B and D) tissues were stained with hematoxylin and eosin and photographed at 400× magnification. (A, B) Bone marrow; (C, D) spleen; (E) liver; (F ) lung. Representative megakaryocytes (megakaryocyte nucleus in lung) are indicated by arrowheads. Bar = 22 μm.
Megakaryocytosis in transgenic mice. Four-micron formalin-fixed sections from AM107 (A, C, E, and F ) and control (B and D) tissues were stained with hematoxylin and eosin and photographed at 400× magnification. (A, B) Bone marrow; (C, D) spleen; (E) liver; (F ) lung. Representative megakaryocytes (megakaryocyte nucleus in lung) are indicated by arrowheads. Bar = 22 μm.
The AM107 line was next examined for the response to either of two models of induced thrombocytopenia, APS administration14 or 5FU treatment.15 These studies were performed to evaluate both the platelet response to the treatment and the recovery kinetics of the platelets. APS administration results in acute transient thrombocytopenia. Recovery from such treatment will uncover the effects of c-mpl ligand on platelet formation from existing megakaryocyte populations in vivo. 5FU treatment, in addition to having a general myelosuppressive effect, targets megakaryocyte progenitor populations. This model allows examination of the effect of c-mpl ligand pretreatment of these populations and the effect of c-mpl ligand on the ability of these cells to produce new platelets.
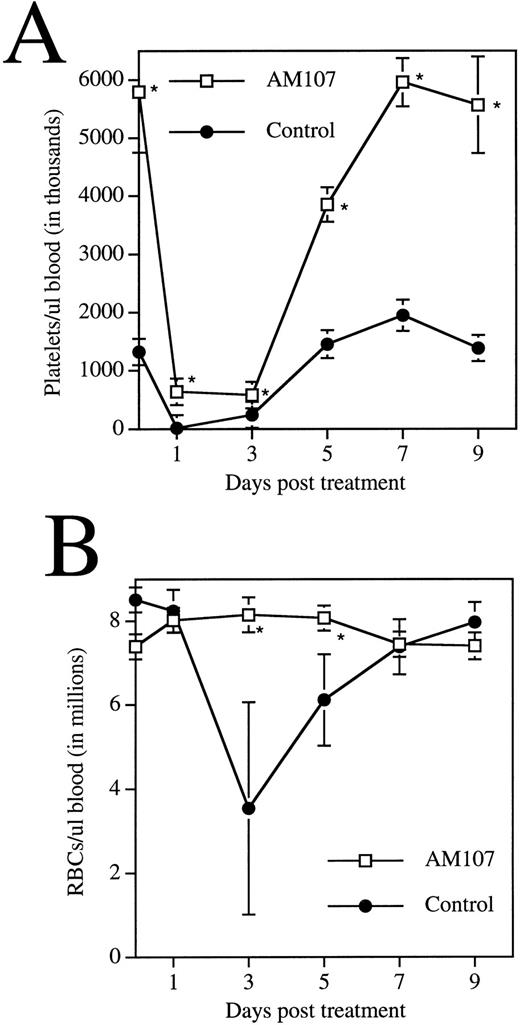
Rabbit APS was administered to 12 animals each from the AM107 and control groups. Platelet counts were then monitored over a 9-day period (Fig 6A). Control mice behaved predictably in the assay, exhibiting a platelet nadir 24 hours postinjection of 16,000/μL ± 8,000/μL, a 99% decrease. Platelet levels in AM107 mice remained relatively high at 639,000/μL ± 78,000/μL, an 89% decrease, still half the level in untreated control mice. As the platelet count began to recover to pretreatment levels, the rate of appearance of new platelets could be estimated from the rate of platelet recovery. The rate of new platelet production in the AM107 line was greater than three times the rate in control animals from day 3 to day 7 posttreatment.
Response of transgenic mice to APS treatment. Data are the mean ± SD of 4 animals. *P ≤ .01. (A) Time course of circulating platelet levels following APS injection. (B) Time course of circulating RBC levels following APS injection.
Response of transgenic mice to APS treatment. Data are the mean ± SD of 4 animals. *P ≤ .01. (A) Time course of circulating platelet levels following APS injection. (B) Time course of circulating RBC levels following APS injection.
During recovery from APS administration, erythrocyte levels in the two groups were also monitored. Erythrocyte levels remained high in both groups 24 hours posttreatment, suggesting that APS treatment did not directly affect RBCs. Erythrocyte levels in the controls then declined to approximately half the pretreatment levels at day 3 and did not completely recover until day 9 (Fig 6B). In contrast, erythrocyte levels in AM107 mice remained at pretreatment levels, suggesting that transgenic mice were protected from blood loss due to the acute thrombocytopenia induced by this procedure. It is also possible that both groups sustained a blood loss, but the blood loss in transgenic mice was masked by a more rapid production of RBCs, a hypothesis supported by the observed increase in CFU-E.
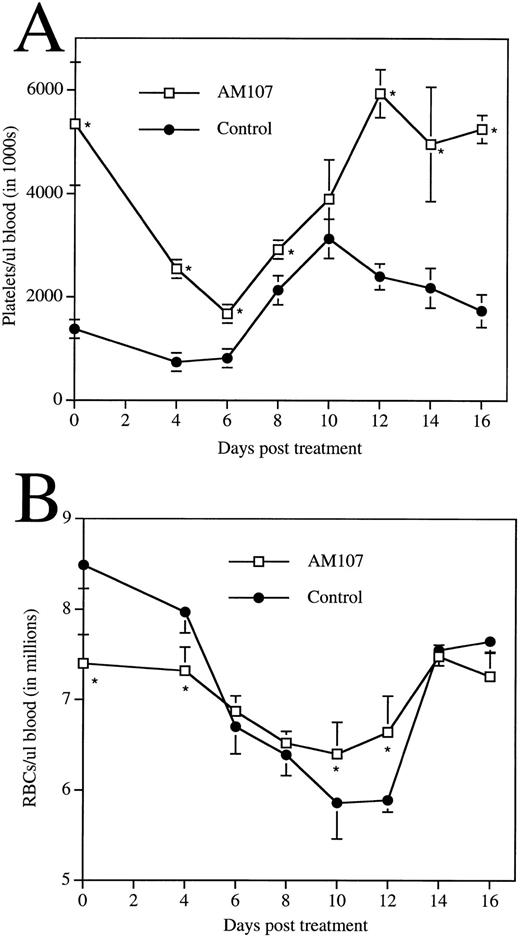
Response of transgenic mice to 5FU treatment. Data are the mean ± SD of 4 animals. (A) Time course of circulating platelet levels following 5FU administration. *P ≤ .007. Day 10, P = .13. (B) Time course of circulating RBC levels following 5FU administration. *P ≤ .02.
Response of transgenic mice to 5FU treatment. Data are the mean ± SD of 4 animals. (A) Time course of circulating platelet levels following 5FU administration. *P ≤ .007. Day 10, P = .13. (B) Time course of circulating RBC levels following 5FU administration. *P ≤ .02.
Another set of transgenic and control mice were administered a single dose of 5FU and then monitored over a 16-day recovery period (Fig 7A). Control mice responded predictably to 5FU treatment, exhibiting a 50% reduction in platelet count by day 6 and then a rebound thrombocytosis on or near day 10. However, AM107 mice exhibited a greater proportional reduction in platelet count (1.6 × 10⁶/μL ± 1.2 × 10⁵/μL), reaching a nadir of about 30% of pretreatment levels. However, this level was still higher than that of untreated control mice. The rate of platelet recovery between day 6 and day 10 was approximately equal to that of control mice. After day 10, control platelet levels began to return to pretreatment levels, but AM107 platelet levels continued to increase until reaching pretreatment levels at day 12. AM107 mice did not exhibit rebound thrombocytosis.
Erythrocyte levels in the two groups were also monitored (Fig 7B). AM107 exhibited the previously noted anemia before treatment. However, the erythrocyte nadir was reduced relative to that in the control group at days 10 and 12 (P ≤ .02). Although the reason for this increased RBC recovery is unclear, it is possible that the increased erythrocyte progenitors (CFU-E) contribute to the reduced RBC nadir.
DISCUSSION
We have demonstrated that liver-directed expression of the human c-mpl ligand cDNA produces biologically active protein that has an expression level–dependent thrombopoietic activity. The increased c-mpl ligand levels cause an increase in the number of MEG-CFC and in the number and size of megakaryocytes and lead to stable circulating platelet levels that are up to four times the normal levels. Additionally, increased numbers of megakaryocytes are seen in the bone marrow, spleen, liver, and lung of these animals. This model demonstrates that long-term (>16 months) stimulation by elevated c-mpl ligand levels is well tolerated. A concern has been raised as to the possibility that there exist limited numbers of megakaryocyte progenitor cells, such that sustained stimulation of the megakaryocyte lineage would deplete the progenitor population, leading to thrombopoietic failure. The sustained high platelet counts in older animals demonstrate that the megakaryocyte progenitor populations remain intact.
The mice in this study did not exhibit myelofibrosis or osteosclerosis. This is in contrast to another study in which bone marrow cells were retrovirally transduced with a murine c-mpl ligand gene and then transplanted into irradiated recipients.16 The investigators postulated that the observed pathology was due to increased levels of platelet-derived factors. Because platelet levels are similar in both models, we believe that such an explanation cannot fully explain their phenotype. The differences between the two models may be explained by the nature of the retrovirally targeted gene, which would be expected to be expressed in multiple bone marrow cell types including progenitors, whereas both the transgene used in these studies and the endogenous gene are expressed in the liver. Alternatively, more subtle differences in the experiments such as the strain of mice or the use of human versus murine c-mpl ligand could account for the different phenotypes.
Recent reports17,18 have demonstrated that in vitro treatment with c-mpl ligand augments the sensitivity of platelets to aggregating agents. These findings necessarily raise the concern that the therapeutic potential of c-mpl ligand might be compromised if biologically active doses of c-mpl ligand were to sensitize platelets in vivo and potentially increase the risk of thrombosis. However, platelets isolated from AM107 transgenic mice were indistinguishable from platelets isolated from the nontransgenic littermates. No sensitization of platelets to ex vivo aggregating agents was observed. A 40% reduction in the lymphocyte marker CD11a was also observed on platelets from AM107 mice. The significance of this observation is not clear; however, similar decreases in the level of this marker have been observed in mice that have received exogenous rHuMGDF (J.G., unpublished data, August 1995). We also observed a 7% increase in the measured MPV of transgenic mice relative to controls. Other reports indicate that c-mpl ligand can cause either an increase or a decrease in MPV depending on the dose or administration regimen.8,19 20
Also noted in the transgenic mice was a slight but significant decrease in circulating erythrocyte number. This anemia is observed in vivo, despite a threefold increase in the number of CFU-E. Equivalent increases in CFU-E in response to c-mpl ligand administration have been reported previously.21 However, these studies did not observe any change in RBC levels. The stable and noninvasive nature of transgenic c-mpl ligand overexpression may uncover effects on erythrocytes that might not be observed in more invasive studies that require repeated injection and bleeding. It is important to point out that assays to determine CFU-E numbers are performed in vitro in the presence of exogenously added erythropoietin, a cytokine that may influence the fate of progenitor cells during the course of the CFU-E assay. We postulate that in vivo, the high levels of human c-mpl ligand are able to drive the bipotential progenitor cells down the megakaryocyte lineage at the expense of the erythroid lineage, resulting in anemia.
Following characterization of the steady-state condition of animals overexpressing human c-mpl ligand, we next investigated the response to thrombopoietic insult. Transgenic animals were protected from either APS- or 5FU-induced thrombocytopenia. Evaluation of RBC counts in both models demonstrated that RBC levels, which decreased in control mice, were maintained in transgenic mice. This suggests that in addition to its direct effects on platelet count, c-mpl ligand also leads to maintenance of erythrocyte levels, possibly by decreasing the extent of internal bleeding (in the case of APS treatment) or by enabling faster recovery of erythrocytes due to the increased CFU-E levels (in the case of 5FU administration).
In conclusion, long-term administration of c-mpl ligand via a liver-expressed transgene results in a specific and significant increase of megakaryocyte progenitors, megakaryocytes, and platelets. These platelets appear normal and do not cause significant observable pathology in the mice. Furthermore, long-term administration of c-mpl ligand can provide protection from thrombocytopenia and anemia induced by APS or 5FU. These experiments suggest that c-mpl ligand may be an effective therapy for the treatment of thrombocytopenia.
Address reprint requests to Murray O. Robinson, PhD, Amgen Inc, MS 14-1-B, Thousand Oaks, CA 91320.


This feature is available to Subscribers Only
Sign In or Create an Account Close Modal