Abstract
Developmental switching of hemoglobins (Hbs) occurs in most vertebrates, yet the cellular and molecular basis for this process remains elusive. The zebrafish is a new genetic and developmental system that can be used to study embryogenesis, and mutants with a variety of defects in hematopoiesis have recently been derived. To initiate our studies on Hb switching in this organism, we have characterized the globins expressed in the adult. Reversed-phase high performance liquid chromatography and mass spectrometric analyses of adult peripheral blood hemolysates showed that there are three major α globins and two β globins in circulating erythroid cells. In addition, we have isolated and characterized zebrafish adult α- and β-globin cDNA clones that encode some of these globins. High levels of α- and β-globin gene expression were detected in adult erythroid cells, whereas embryonic erythroid cells expressed little, if any, of these RNAs. We have also shown that the α- and β-globin genes are tightly linked on the same chromosome and are arrayed in a 3′-5′ to 5′-3′ configuration, respectively. The characterization of these genes and regulatory elements in this globin locus will provide insight into the process of globin gene transcription. With these reagents, future studies of Hb switching in zebrafish mutants with defective hematopoiesis will be possible.
VERTEBRATE HEMATOPOIESIS is characterized by developmentally regulated alterations in globin gene expression as the site of blood formation changes.1 In humans, primitive blood islands of the yolk sac express embryonic-specific globins (such as ζ and ε), whereas definitive erythroid cells in the fetal liver and bone marrow predominantly express α globin with γ and β chains, respectively. Developmental switching is regulated at two levels. First, gene transcription is activated by cell-specific and stage-specific transcription factors acting through proximal cisregulatory sites and the locus control regions (LCRs). Second, the embryo forms primitive and definitive hematopoietic cell populations at different stages of development.2 3 These regulatory mechanisms appear to be conserved throughout vertebrate evolution, although, in teleosts, control of hemoglobin (Hb) switching at the transcriptional level has not yet been shown.
Lampreys express only one globin chain and assemble Hb tetramers.4 Subsequently, during the evolution of fish, globin duplication is believed to have given rise to the α- and β-globin complex. In Xenopus, the α and β globins are linked on the same chromosome, whereas, in higher vertebrates, the α- and β-globin loci are found on distinct chromosomes.1 In most species studied to date, transcription proceeds in the same direction (5′ to 3′ orientation) for the globin genes in a given locus. The globin genes typically consist of three exons and two introns1 and contain a classical promoter with TATA and CAAT boxes, as well as CACCC and GATA sequence motifs. Globin gene expression is regulated by LCRs,5-9 which are DNAse-I–hypersensitive and confer position-independent, copy-number–dependent, high-level expression of reporter genes in either erythroid cell lines or in erythroid cells of transgenic mice. Recent observations have suggested that each subregion of the LCR has unique characteristics for developmental expression.10 An LCR has been shown in chickens, mice, sheep, and humans.5-9
Although adult globin proteins have been characterized in some teleosts, globin gene expression and switching have not been studied extensively. Nevertheless, globin switching in fish has been predicted to occur based on differences in the characteristics of primitive and definitive erythroid cells11,12 and on differences between larval and adult globin genes in lampreys.4 Finally, the results of studies using polyclonal antisera generated to adult and larval teleost blood show a switching event that correlates with the onset of erythropoiesis in the pronephros.11-14
The zebrafish is a powerful new developmental genetic system for analysis of early events in organogenesis. The initial site of hematopoiesis in the zebrafish (and most teleosts) is the intermediate cell mass of Oellacher (ICM), which is established by 23 hours after fertilization and expresses globin,15 the ICM is the functional equivalent of the yolk sac in most other vertebrates16-18 and expresses the transcription factors GATA-1 and GATA-2.15 Embryonic hematopoiesis proceeds through day 10 of development, after which definitive hematopoiesis is initiated in the pronephros; maturation of pronephric progenitors to erythroblasts occurs by day 12. In the adult, the mesonephric kidney is the major site of hematopoiesis.
Here, we have characterized the globins expressed in the adult zebrafish. The isolation of these globin genes will allow future study of Hb switching in the zebrafish, particularly in mutants that affect hematopoiesis. Analysis of genomic clones for these globins shows that the α and β globins are linked on the same chromosome, as are the Xenopus globin loci, but in a 3′-5′ to 5′-3′ configuration, respectively. Studies of transcriptional regulation of the globin genes present in this unusual locus may provide important clues to the early evolutionary programs that lead to globin switching.
MATERIALS AND METHODS
Animals.Adult zebrafish (an inbred AB strain obtained from E. Sullivan [Harvard University, Cambridge, MA] and wild-type from Ekkwill Waterlife Resources [Gibsonton, FL]) were maintained under standard conditions at 28°C.19 Embryos were derived from matings of adult fish and staged according to Westerfield.19
Cells.Blood cells were obtained from adult zebrafish by intracardiac puncture with a 10-μL glass microhematocrit tube (Curtin Matheson Scientific, Houston, TX). The blood cells were washed once in 0.9× phosphate-buffered saline (PBS; Dulbecco's 10×; Life Technologies, Inc, Gaithersburg, MD) and subjected to RNA preparation. Embryonic blood cells were collected by immersing the embryo in 0.9× PBS and cutting across the tail with a sharp scalpel (no. 15, Bard-Parker; Becton Dickinson AcuteCare, Franklin Lakes, NJ), allowing blood cells to pool in the PBS and collecting them into a drawn glass pipette by capillary action. About 3,000 embryonic red blood cells (RBCs) could be obtained per embryo in this manner.
RNA preparation.Total cellular RNA was prepared by guanidinium isothiocyanate extraction.20 Adult blood (10 μL) yielded about 2 μg and blood from 100 embryos yielded about 2 μg of total cellular RNA.
Cloning of a zebrafish adult α-globin cDNA.Plaques (500,000) from a zebrafish retina cDNA library (prepared from AB and Ekwill zebrafish by J.R. in the Uni-ZAP cloning vector [Stratagene, La Jolla, CA]) were screened with a visual pigment gene (red opsin) under high stringency conditions at 6× SSC (1× SSC = 0.15 mol/L sodium chloride, 0.015 mol/L sodium citrate; pH, 7.0). One cDNA was noted to be a fusion clone that included the visual pigment homologue and another cDNA. This additional cDNA was subcloned into the EcoRI and Xho I site of the Bluescript vector (Stratagene) and subjected to dideoxynucleotide sequence analysis using the Sequenase Version 2.0 kit (US Biochemicals, Cleveland, OH) following standard protocols.21 A search of the basic local alignment search tool (BLAST) database22 showed that the cDNA encoded a full-length α globin. We refer to this globin as αA1 (α globin, Adult, gene 1).
Cloning of a genomic DNA clone for the adult α globin.Filters bearing 600,000 plaques from an amplified zebrafish genomic DNA library (kindly provided by Dr M. Kieran, Children's Hospital, Boston, MA) were screened for hybridization with the full-length α-globin cDNA. Filters were hybridized following standard protocols21 under high stringency at 6× SSC and were washed to 0.25× SSC. Four hybridizing plaques were isolated, and DNA was prepared using standard techniques.21 Digestion of each independent phage DNA with several restriction enzymes show similar patterns, and one phage (designated 2-1) was used for further analysis and subcloning. Southern blot analysis,21 using the full-length α-globin cDNA as probe, determined which restriction fragments contained the α-globin gene. A 2.1-kb Pst I fragment from one phage (designated 2-1) hybridized strongly and was subcloned into Bluescript (Stratagene). The fragment was sequenced, as described above, using synthetic oligonucleotide primers. The sequence was analyzed with the BLAST program22 for similarities to other genes.
Isolation of β-globin cDNAs.We isolated an adult β-globin cDNA as part of a random sequencing project of cDNAs from an adult zebrafish kidney cDNA γZAP II (Stratagene) library (kindly provided by Drs J. Rast and G. Litman, University of South Florida, St Petersburg, FL). 100 random cDNAs were sequenced, and one (clone 27) was determined to encode β-globin based on BLAST analysis.22 This β-globin cDNA is referred to as βA1 (β globin, Adult, gene 1).
The sequence of one end of the 2.1-kb Pst I fragment from phage 2-1 showed homology to other fish β globins (based on BLAST analysis). Filters bearing 150 plaques from a zebrafish spleen cDNA library (kindly provided by Drs J. Rast and G. Littman) were hybridized with the Pst I fragment as probe under high stringency conditions (as described above). Numerous plaques hybridized to the probe, and four were isolated for subcloning. Each phage was subjected to polymerase chain reaction (PCR) amplification (94°C for 1 minute, 55°C for 1 minute, and 72°C for 1 minute; 25 cycles) with the primers directed to phage arms (5′-GGTGGCGACGACTCCTGGAGCCCG-3′ and 5′-TTGACACCAGACCAACTGGTAATG-3′). The products were subcloned into the pCR II vector following the protocol provided with the TA Cloning kit (Invitrogen Corp, San Diego, CA). Sequence of three cDNA clones show identity to the αA1 -globin sequence, and one phage was very similar to the sequence of the β-globin gene on the Pst I fragment; this β globin (called βA2 ) appears to represent a transcript from another highly homologous β-globin gene.
Reverse-transcription PCR (RT-PCR) analysis.RNA samples were analyzed by RT-PCR.23 First-strand cDNA was prepared from 1.5 μg of total RNA, using oligo (dT)12-18 (Collaborative Research, Lexington, MA) as primer, and Moloney murine leukemia virus (M-MLV reverse transcriptase (Life Technologies, Inc). The reaction conditions (for a 40-μL reaction volume) are as follows: 50 mmol/L Tris-HCL (pH, 8.3); 75 mmol/L KCl; 3 mmol/L MgCl2 ; 1 mmol/L each deoxyguanosine triphosphate (dGTP), deoxycytidine triphosphate (dCTP), deoxyadenosine triphosphate (dATP), and deoxythymidine triphosphate (dTTP); GeneAmp deoxynucleotide triphosphates (Perkin Elmer-Cetus, Norwalk, CT); 10 mmol/L dithiothreitol; 80 U rRNasin Ribonuclease Inhibitor (Promega, Madison, WI); and 400 U M-MLV reverse transcriptase for 60 minutes at 50°C. A reaction with water replacing the RNA was included as the negative control.
One tenth of the RT product was used in PCR analysis. Amplifications were performed using primers designed from the sequences obtained (see below). The reaction conditions (for a 50-μL reaction volume) are as follows: 10 mmol/L Tris-HCl (pH, 8.3); 50 mmol/L KCl; 1.5 mmol/L MgCl2 ; 0.2 mmol/L each dGTP, dCTP, dATP, and dTTP; 200 ng of each primer; and 2.5 U Taq DNA polymerase (Boehringer Mannheim, Mannheim, Germany). A small amount of [α-32P]dCTP was included as a tracer. Reactions were performed in a DNA Thermal Cycler (Perkin Elmer-Cetus). Thirty PCR cycles (denaturation at 94°C for 1 minute, primer annealing at 55°C for 1 minute, and primer extension at 72°C for 1 minute) were performed to detect expression of the specific genes. Expression of the constitutively expressed zebrafish EF-1α was also examined to compare quality and amount of RNA in the reactions.
One fourth of the PCR sample was electrophoresed on a 5% polyacrylamide gel, and products were detected using a PhosphoImager (Molecular Dynamics, Sunnyvale, CA).
The following primers were used in the PCR analysis (F, forward; R, reverse): for α-globin, 5′-CAAGGCTGTTGTTAGGC-3′ (F ) and 5′-GCACAGTGTTGTTGTCAG-3′ (R) (the primer pair amplifies cDNA fragment of length 447 bp, corresponding to nucleotides 60 to 507 of the cDNA sequence); for β-globin, 5′-GGCCTGTGGGGAAAGCTC-3′ (F ) and 5′-GTTGTCGGGATCCACATGCAG-3′ (R) (the primer pair amplifies cDNA fragment of length 269 bp, corresponding to nucleotides 62 to 331 of the cDNA sequence; these primers amplify both the zebrafish β globins, βA1 and βA2 [see Results]); and for EF-1α, 5′-CGGTGACAACATGCTGGAGG-3′ (F ) and 5′-ACCAGTCTCCACACGACCCA-3′ (R) (the primer pair amplifies cDNA fragment of length 220 bp, corresponding to nucleotides 651 to 870 of the cDNA sequence [GenBank L23807]).
Hb electrophoresis.Hb electrophoresis was performed as described previously for the mouse.24 Whole blood from four adult zebrafish was incubated for 15 minutes at room temperature in an equal volume of 0.067 mol/L cystamine/0.33% ammonium hydroxide/0.5 mmol/L dithiothreitol. The sample was loaded onto a Titan III-H cellulose acetate plate (Helena Laboratories, Beaumont, TX), and individual Hb species were resolved by electrophoresis in 0.018 mol/L Tris/0.1 mol/L boric acid/2 mmol/L EDTA (free acid; pH, 8.4) over 1 hour (300 V). The plate was stained with 1% Ponceau S in 5% trichloroacetic acid, washed repeatedly in 5% acetic acid, and photographed under indirect light.
High performance liquid chromatography (HPLC) and electrospray mass spectrometry of globin chains and proteolytic peptides.Hemolysates were prepared by washing RBCs with saline (3×) and freezing the RBCs. On thawing, 2 vol of water was added; the sample was centrifuged in an Eppendorf centrifuge at 16,000g for 15 minutes in the cold cabinet (temperature, 5°C), and supernatant was collected. Automated analytical reversed-phase HPLC of hemolysates was performed as described previously25 using a Spectra Physics HPLC system (Thermo Separation Products, Fremont, CA). The elution gradient was based on a method of Shelton et al26 but modified to accommodate higher hydrophobicity of the zebrafish versus human globins; it consisted of two linear steps: from 42% A to 36% A in 45 minutes and then to 25.6% A in 65 minutes, where A was 20% acetonitrile/0.1% trifluoroacetic acid (TFA) and B was 60% acetonitrile/0.1% TFA. The mass spectrometric techniques used for intact globin and tryptic peptides analyses were described in detail in a review article.27 A triple quadrupole VG BioQ electrospray mass spectrometer (Micromass, Altrincham, UK) interfaced with a Michrom narrow-bore HPLC system (Michrom BioResources, Auburn, CA) was used. Mass spectrometer was controlled, and the data were analyzed using a MassLynx 2.1 software; intact protein spectra were deconvoluted to a real molecular mass using a MaxEnt software28 (all software from Micromass). Cone voltage ramp (25 V to 75 V) was used for acquisition of electrospray mass spectra of intact globins within a 500 to 1500 mass-to-charge (m/z) range; the collision-induced dissociation (CID) experiments were performed at a constant cone voltage of 60 V. The conditions of proteolysis of globins and mass spectrometric analysis of tryptic peptides were as described before. Before HPLC/electrospray ionization mass spectrometry (ESMS) analysis, proteolytic peptide mixtures were on-line desalted on a peptide cartridge (Michrom BioResources).
RESULTS
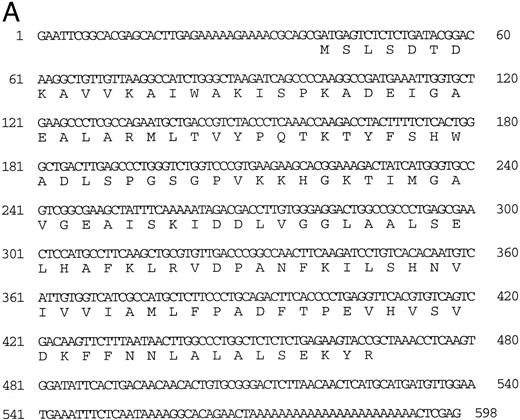
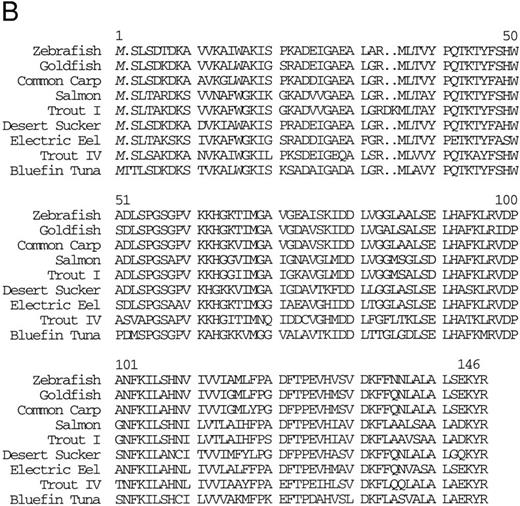
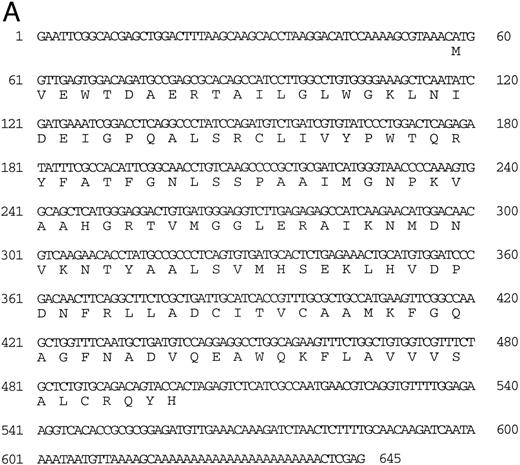
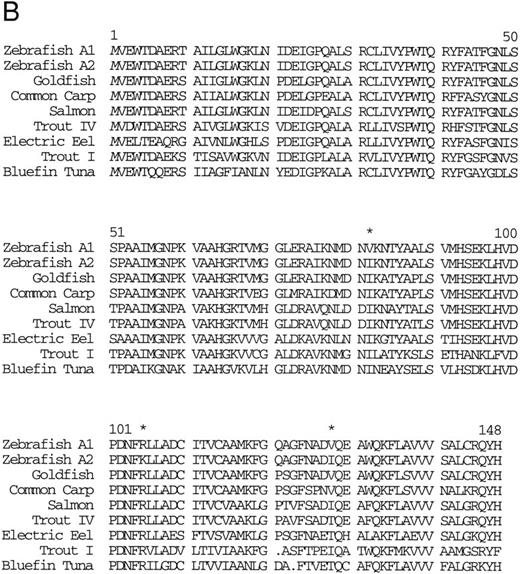
Isolation of a zebrafish α-globin cDNA.Screening of a zebrafish retina cDNA library for visual pigment cDNAs identified a single phage clone that contained two fused cDNAs encoding a visual pigment protein and an unrelated cDNA. The unrelated cDNA was subcloned between the EcoRI and Xho I sites of Bluescript KSII− (Strategene, CA) and was subjected to dideoxynucleotide sequencing.21 Searching of GenBank databases (BLAST)22 showed that the cDNA encoded an α-globin (Fig 1A). We refer to this globin as αA1 . Close homology to globins in other fish species was observed (Fig 1B).
(A) Nucleotide sequence of the zebrafish adult αA1 -globin cDNA. The amino acid sequence is listed underneath. (B) Comparison of the predicted amino acid sequence of adult α globins of zebrafish and other fish species (obtained from Genbank). The initiator methionine is placed in italics, because the sequenced polypeptides do not include this methionine. Our studies show that the zebrafish α globins do contain the N-terminal methionine, but the β globins do not.
(A) Nucleotide sequence of the zebrafish adult αA1 -globin cDNA. The amino acid sequence is listed underneath. (B) Comparison of the predicted amino acid sequence of adult α globins of zebrafish and other fish species (obtained from Genbank). The initiator methionine is placed in italics, because the sequenced polypeptides do not include this methionine. Our studies show that the zebrafish α globins do contain the N-terminal methionine, but the β globins do not.
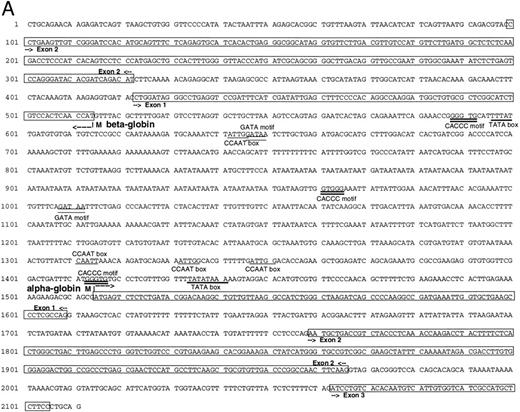
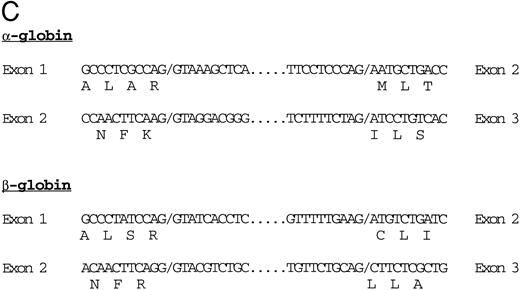
Isolation of a zebrafish α-globin genomic DNA phage clone.To characterize the α-globin gene, the αA1 cDNA was used as a probe to screen a zebrafish genomic DNA library. A total of 500,000 independent phage were screened, and four independent phage clones were isolated. Restriction enzyme digestion of DNA prepared from the phage showed that three of these clones were identical. A fourth clone showed a distinct pattern of fragments from the restriction enzyme digestion. Southern blot analysis was performed on DNA prepared from one of the three identical clones (designated 2-1) using the αA1 cDNA probe. A hybridizing 2.1-kb Pst I fragment was subcloned and contained the αA1 promoter, as well as exons 1 and 2 and part of exon 3 (Fig 2A). Sequence analysis of the entire fragment showed that it also contained sequences encoding a β-globin gene. The direction of transcription of the α- and β-globin genes, predicted by intron-exon structure, was surprisingly in a 3′-5′ to 5′-3′ configuration (Fig 2B). Each promoter contained cis elements including TATA and CAAT boxes (underlined in the figure). GATA and CACCC sites in the α-globin and β-globin promoters (marked with double lines; exons are boxed) are also present. The first and second introns for the α-globin are 150 and 95 nucleotides in length, respectively. The first intron for the β-globin gene, as determined by comparison with the cDNA sequence (see below), is 100 nucleotides in length. An additional βA1 -globin gene fragment, including intron 2 (which is 98 nucleotides in length), was isolated by PCR with primers derived from exon 2 and 3. The intron-exon boundaries are presented in Fig 2C.
(A) Genomic sequence of the 2.1-kb Pst I fragment. The initiation codon for each globin is marked with an “M” and an arrow pointing towards the direction of transcription. The exons are boxed and labeled. CCAAT and TATA boxes are underlined (CCAAT with thin and TATA with thick lines). GATA and CACCC motifs are marked with double lines (GATA with thin and CACCC with thick lines). (B) 3′-5′ to 5′-3′ configuration of the globin genes. Arrows indicate the initiation site and direction of transcription for each globin. Black boxes represent the exons (Pst I fragment does not contain the 3′ end of exon 3 of the α globin and exon 3 of the β globin). The 1009 bp of intervening sequences separate the two genes. (C) Intron-exon boundaries in the adult αA1 - and βA1 -globin genes.
(A) Genomic sequence of the 2.1-kb Pst I fragment. The initiation codon for each globin is marked with an “M” and an arrow pointing towards the direction of transcription. The exons are boxed and labeled. CCAAT and TATA boxes are underlined (CCAAT with thin and TATA with thick lines). GATA and CACCC motifs are marked with double lines (GATA with thin and CACCC with thick lines). (B) 3′-5′ to 5′-3′ configuration of the globin genes. Arrows indicate the initiation site and direction of transcription for each globin. Black boxes represent the exons (Pst I fragment does not contain the 3′ end of exon 3 of the α globin and exon 3 of the β globin). The 1009 bp of intervening sequences separate the two genes. (C) Intron-exon boundaries in the adult αA1 - and βA1 -globin genes.
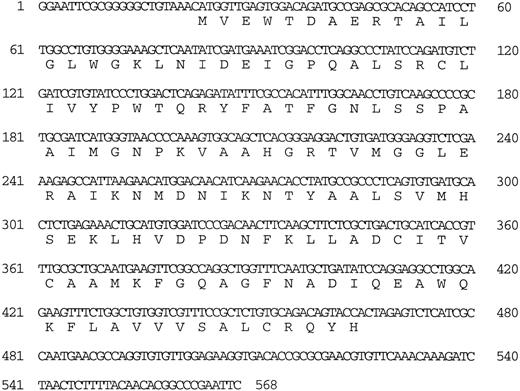
Isolation of a β-globin cDNA.A random sequencing project of 100 cDNA clones from an adult kidney cDNA library yielded one cDNA (designated 27) that encodes a β-globin (called βA1 ) which is identical in sequence to the exons of the β-globin gene in the 2.1-kb Pst I fragment of phage 2-1 (Fig 3A). These cDNA sequences were used to determine the intron-exon boundaries of the βA1 gene (Fig 2). Sequence comparisons (using the BLAST program)22 with other fish globins showed close homology (Fig 3B).
(A) Nucleotide sequence of the zebrafish adult βA1 -globin cDNA. The amino acid sequence is listed underneath. (B) Comparison of the predicted amino acid sequence of the zebrafish adult β globins with β-globin sequences of other fish species. An asterisk (*) is used to designate the positions at which the amino acid sequences of zebrafish βA1 and βA2 globins differ (see Fig 5).
(A) Nucleotide sequence of the zebrafish adult βA1 -globin cDNA. The amino acid sequence is listed underneath. (B) Comparison of the predicted amino acid sequence of the zebrafish adult β globins with β-globin sequences of other fish species. An asterisk (*) is used to designate the positions at which the amino acid sequences of zebrafish βA1 and βA2 globins differ (see Fig 5).
Other globins.The globins expressed in adult zebrafish have previously been studied by electrophoresis29 (although these results are published only in abstract form without figures). To confirm these results, adult zebrafish peripheral blood was subjected to Hb electrophoresis. Two strong bands and one weaker band were evident (Fig 4), which suggested that other adult globin genes are expressed in adult zebrafish in addition to the α- and β-globin genes that we have isolated. To obtain other globin cDNAs, 150 plaques from a zebrafish spleen cDNA library were screened with the Pst I fragment of phage 2-1, and four clones were isolated and sequenced. The sequence of three cDNA clones matched the previously isolated adult α-globin cDNA. The fourth clone was shown to encode a β globin (Fig 5). This β-globin (called βA2 ) was 96% identical to β-globin A, and the predicted amino acid sequences indicated 3 differences between the two globins (Fig 3B). The amino acid at position 105 is arginine in βA1 globin and lysine in βA2 -globin B. It is possible that this difference could account for distinct migration patterns on Hb electrophoresis, but, based on the similarity of charge, it is unlikely. Thus, the other bands may represent tetramers between other α-globin and β-globin chains. Southern analysis of phage 2-1 DNA showed hybridization of the α- and β-globin cDNAs to bands distinct from the α- and β-globin genes studied here (data not shown). In addition, we have isolated a weak hybridizing globin cDNA that is expressed at a low level in the adult and in the embryo (data not shown). Thus, it appears that multiple α and β-globins are expressed in the adult zebrafish.
Hb electrophoresis of adult zebrafish blood. Two major and one minor band are detected.
Hb electrophoresis of adult zebrafish blood. Two major and one minor band are detected.
Nucleotide and amino acid sequence of the βA2 -globin cDNA.
Nucleotide and amino acid sequence of the βA2 -globin cDNA.
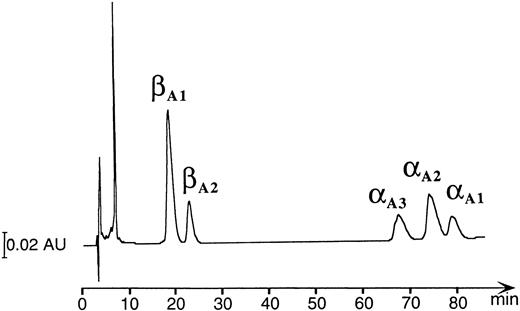
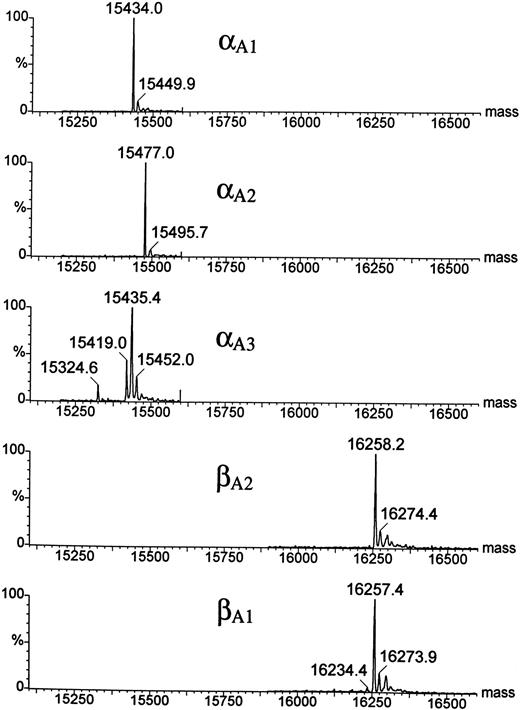
HPLC and mass spectrophotometric analysis of adult Hbs in the zebrafish.A combination of chromatographic and mass spectrometric techniques was further used to characterize the adult Hbs of the zebrafish. Reversed-phase HPLC of a mixture of globins derived from a number of wild-type adult zebrafish showed the presence of five HPLC peaks grouped in two distinct sets of low and high hydrophobicity (two and three peaks, respectively; see Fig 6). The same HPLC pattern was further observed in Hb samples obtained from individual families (data not shown). The relative ratio between amount of protein within each group was close to 1:1, suggesting that each set of HPLC peaks contained exclusively one type of globin (either α or β). The HPLC fractions were examined by ESMS, a technique that allows for measurement of molecular masses (Mr ) of biomolecules with high accuracy (up to 0.01%; Fig 7).30 Each of the first two HPLC peaks contained a single protein species with an average molecular mass of 16257.4 Daltons and 16258.2 Daltons (in first and second peak, respectively). These molecular masses vary from those expected for known zebrafish β globins βA1 and βB2 (Mr = 16389.1) by −131 Daltons. The mass decrement of 131 Daltons can be rationalized by an elimination of one methionine from the protein sequence. We hypothesize that zebrafish β globins undergo a removal of the N-terminal methionine, a common processing of a nascent protein chain in eukaryotes,31-33 and, thus, the desmethionyl βA1 and βB2 constitute the fast-eluting HPLC peaks. The three remaining HPLC peaks contained species whose molecular masses were close to the mass expected for the known α globin (Mr = 15437.0). Therefore, we putatively categorized the late-eluting species as adult zebrafish α globins. Their respective average molecular masses measured 15435.4, 15477.0, and 15434.0 Daltons and were subsequently assigned as αA3 , αA2 , and αA1 , respectively. It was noted that, whereas the αA2 and αA1 fractions looked pure and homogeneous in mass spectrometric analysis, the αA3 peak showed heterogeneity and contained at least two minor components (15324.6 and 15419.0 Daltons) in addition to the major species of 15435.4 Daltons. The molecular mass of the αA1 fraction showed a 3-Dalton decrement when compared with the value predicted for the known αA1 sequence. This mass difference slightly exceeds the method error of ±1.5 Daltons typically observed for a 15-kD protein. At this point of analysis, we have not been able to establish whether a discrepancy in molecular mass is caused by an error in mass measurement or whether it reflects a real and yet noncharacterized alteration in protein structure. In conclusion, reversed-phase HPLC and ESMS of adult zebrafish globins showed the presence of two β and at least three α globins.
Reversed-phase HPLC of the hemolysate derived from a number of wild-type adult zebrafish (detection at 220 nm). The peak eluting at ∼8 minutes contains heme molecules.
Reversed-phase HPLC of the hemolysate derived from a number of wild-type adult zebrafish (detection at 220 nm). The peak eluting at ∼8 minutes contains heme molecules.
Electrospray ionization mass spectra of the zebrafish globins deconvoluted to real mass scale by MaxEnt software. Before ESMS analysis, globins were isolated by reversed-phase HPLC (Fig 6). Mass spectra of the HPLC fractions are shown in order of their elution; the bottom panel shows the mass spectrum of the least hydrophobic globin βA1 . Average molecular masses calculated for βA1 , βA2 , and αA1 globins on the basis of their known sequences are 16257.8, 16257.8, and 15437.0 Daltons, respectively.
Electrospray ionization mass spectra of the zebrafish globins deconvoluted to real mass scale by MaxEnt software. Before ESMS analysis, globins were isolated by reversed-phase HPLC (Fig 6). Mass spectra of the HPLC fractions are shown in order of their elution; the bottom panel shows the mass spectrum of the least hydrophobic globin βA1 . Average molecular masses calculated for βA1 , βA2 , and αA1 globins on the basis of their known sequences are 16257.8, 16257.8, and 15437.0 Daltons, respectively.
Final confirmation of putative identities of zebrafish Hb components required further analysis, and it was performed on proteins isolated by reversed-phase HPLC. We attempted to verify that proteins eluting in the fast- and slow-HPLC peaks were indeed zebrafish α- and β-globin–related, respectively. In addition, we wished to establish which of the HPLC peaks contained the species consistent with the known sequences of the βA1 , βA2 , and αA1 globins. Two analytical approaches were used, mass spectrometric sequencing of intact globins by means of CID in the gas phase34 and peptide mapping. Although mass spectrometric sequencing of intact proteins is still in its early developmental stage, it already offers a great potential in evaluating differences between the very similar and generally known sequences. When intact protein (in a form of the multiply charged precursor ions) is subjected to collisions in the gas phase, some of the peptide bonds undergo cleavages, and protein fragments (product ions) encompassing various parts of the protein sequence are generated. Agreement between the measured and calculated molecular masses of the product ions points to the correspondence between their amino acid constitution and protein sequence. Unequivocal identification of a product ion requires that its charge state is independently established. However, even when a direct assessment of the ion charge states is not possible, a reliable assignment of product ions is still feasible provided that the following conditions are met: (1) more than one charge state is observed for a given fragment and/or (2) a series of fragments that differ by a single amino acid residue is observed. Interpretation of the protein CID data described below is based exclusively on analysis of the product ions that fulfilled at least one of the two criteria defined above.
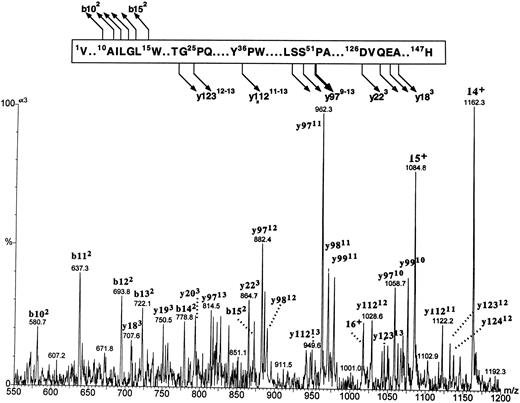
Fragmentation patterns of both putative β globins were identical (spectrum of βA1 is shown in Fig 8). The major fragmentation pathway involved cleavages at the N-terminal side of the 51Pro; it is of interest that the same site in human β globin was previously found to be the most susceptible to CID.35 A series of intense multiply charged y ions (a nomenclature of multiply charged product ions follows the conventions proposed by Roepstroff and Fohlman36 and Biemann et al37 for the singly charged product) corresponding to the zebrafish β-globin amino acid residues 49Ser-147His, 50Ser-147His, and 51Pro-147His documented an agreement between the observed molecular masses and a constitution of the βA1 and βA2 globins within the sequence 49Ser–C-terminus. Less intense cleavages were generated at several other sites, including the N- and C-terminal parts of the molecule, and proved to be of major diagnostic importance. A series of doubly charged b ions encompassing amino acid sequences 1Val-10Ala through 1Val-15Trp proved that there was no initiator methionine at the N-termini of zebrafish β globins. A series of triply charged y ions encompassing C-terminal sequences originating at 126Asp and 128Gln through 130Ala (y223 and y203-y183, respectively) indicated that β globin eluting in the first HPLC peak carried 127Val (within y223) characteristic for the βA1 globin. The y223 ion diagnostic for the βA1 globin was not observed in the spectrum derived from the putative counterpart; however, the low intensity of this ion series in the βA2 spectrum failed to allow positive assignment of the more hydrophobic β globin as carrying 127Ile. Thus, on the basis of protein CID data, two fast-eluting HPLC peaks were shown to carry zebrafish β globins, with the βA1 species being the less hydrophobic of the two.
The figure shows the partial sequence of the βA1 globin and the postulated sites and products of cleavages generated by CID in the gas phase. Below, a portion of the electrospray ionization mass spectrum of the βA1 globin acquired under the conditions that induce partial protein fragmentation in the gas phase is shown. The spectrum shows multiply charged precursor molecular ions and product ions. The precursor ions represent intact protein and are marked with a number of positive charges that they carry (ie, 16+, 15+, 14+). Product ions are derived from protein fragments produced in the course of CID. They are annotated with letters (b and y for ions encompassing the N- and C-termini of the molecule, respectively), followed by numbers representing positions within the sequence where the cleavages occur (numbering starts from the N- and C-terminus for the b and y ions, respectively). The number of positive charges that each product ion carries is given in superscript. Note that intensities of the ions within the m/z range of 550 to 875 are magnified 3 times.
The figure shows the partial sequence of the βA1 globin and the postulated sites and products of cleavages generated by CID in the gas phase. Below, a portion of the electrospray ionization mass spectrum of the βA1 globin acquired under the conditions that induce partial protein fragmentation in the gas phase is shown. The spectrum shows multiply charged precursor molecular ions and product ions. The precursor ions represent intact protein and are marked with a number of positive charges that they carry (ie, 16+, 15+, 14+). Product ions are derived from protein fragments produced in the course of CID. They are annotated with letters (b and y for ions encompassing the N- and C-termini of the molecule, respectively), followed by numbers representing positions within the sequence where the cleavages occur (numbering starts from the N- and C-terminus for the b and y ions, respectively). The number of positive charges that each product ion carries is given in superscript. Note that intensities of the ions within the m/z range of 550 to 875 are magnified 3 times.
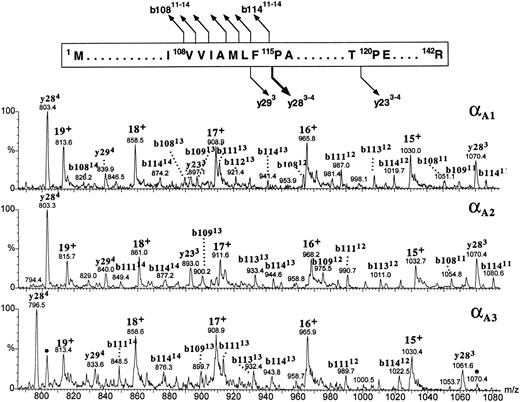
All three α globins seemed to have followed the same fragmentation pathway in the gas phase (Fig 9). All the intense product ions were derived from the cleavages at the N-terminal site of the 115Pro; both the b-type ions covering the N-terminal sequence 1Met-108Val through 1Met-114Phe and the y-type ions encompassing the C-terminal part of the globin sequence 115Pro-142Arg were clearly seen. In human α globin, the product ions derived from the fragmentations at the same proline residue are also very abundant,38 39 although they are accompanied by the ions generated at other cleavage sites whose counterparts we did not observe in the zebrafish α-globin spectra. It was the αA1 globin (eluting in the slowest HPLC peak) whose multiply charged product ions b108-b114 and y28 were consistent with the known sequence of zebrafish α globin (Fig 9, top panel). The b-type ions derived from the αA1 fraction showed a decrement in mass of 3.0 ± 1.6 Daltons (n = 23), whereas the y-type ions were measured accurately (mass difference between the observed and predicted values for y ions +0.5 ± 0.2 Daltons; n = 5). This result is consistent with the discrepancy in molecular mass of the intact globin noticed previously (Fig 7). Full characterization of the αA1 protein is being currently performed to verify a possible variation in protein sequence. On the basis of its fragmentation spectrum, the αA2 globin whose intact molecular mass was 43 Daltons higher than that of αA1 globin was inferred to carry the mutation(s) within its first 108 amino acid residues because all the observed b-type ions had molecular masses higher than those of their αA1 counterparts by 43 ± 1.6 Daltons, whereas the y-type ions derived from the C-terminal part of the molecule measured exactly as did their αA1 counterparts (Fig 9, middle panel). The product ions derived from the αA3 globin could be explained as belonging to the b108-b114 and y28 categories provided that differences between the sequences of αA1 and αA3 chains were localized within the first 108 and the last 27 amino acid residues and resulted in a mass increment of 29.7 ± 2.3 Daltons and a mass decrement of 26.9 ± 0.4 Daltons, respectively. In the αA3 spectrum, in addition to the major fragment ions described above, we have noted the presence of the relatively low intensity ions (marked with dots in the bottom panel of Fig 9) whose molecular masses corresponded to the y284 and y283 species observed in the spectrum derived from the αA1 globin. Their appearance could be explained by assuming that a heterogeneity observed in the intact αA3 -globin fraction (Fig 2) was caused by the presence of the minor species related to, or derived from, the zebrafish α chain whose last 28 amino acid residues shared a sequence with the αA1 globin. Thus in conclusion, partial sequencing of the intact zebrafish α globins by CID in the source of electrospray mass spectrometer showed that the most hydrophobic of the three α globins had fragmentation characteristics consistent with the known α-globin sequence shown in Fig 1A. In addition, the differences between the αA1 , αA2 , and αA3 chains were mapped to specific regions of the α-globin molecule.
The figure shows the partial sequence of the αA1 globin and the postulated sites and products of cleavages generated by CID in the gas phase. Below, portions of the CID electrospray ionization mass spectra of the zebrafish adult α globins are shown. Identities of the product ions generated from the αA1 globin (upper panel) are based on correspondence between the measured and predicted m/z values for the series of y- and b-type ions observed in the spectrum. Tentative assignment of product ions observed in the spectra of αA2 and αA3 globins (middle and bottom panels, respectively) is based on the premise that all zebrafish α chains fragment in the gas phase as shown at the top of the figure. This assumption is reinforced by agreement between the molecular masses of the αA2 and αA3 globins measured for intact molecules (Fig 7) and calculated from the m/z values of the putative b- and y-fragment ions observed in the CID spectra. Ions marked with dots in the bottom panel are believed to be derived from the minor component of the αA3 -globin fraction and might indicate the presence of an additional α-type globin in adult zebrafish blood. Consult legend to Fig 8 for nomenclature used for peak annotation in the CID spectra.
The figure shows the partial sequence of the αA1 globin and the postulated sites and products of cleavages generated by CID in the gas phase. Below, portions of the CID electrospray ionization mass spectra of the zebrafish adult α globins are shown. Identities of the product ions generated from the αA1 globin (upper panel) are based on correspondence between the measured and predicted m/z values for the series of y- and b-type ions observed in the spectrum. Tentative assignment of product ions observed in the spectra of αA2 and αA3 globins (middle and bottom panels, respectively) is based on the premise that all zebrafish α chains fragment in the gas phase as shown at the top of the figure. This assumption is reinforced by agreement between the molecular masses of the αA2 and αA3 globins measured for intact molecules (Fig 7) and calculated from the m/z values of the putative b- and y-fragment ions observed in the CID spectra. Ions marked with dots in the bottom panel are believed to be derived from the minor component of the αA3 -globin fraction and might indicate the presence of an additional α-type globin in adult zebrafish blood. Consult legend to Fig 8 for nomenclature used for peak annotation in the CID spectra.
Peptide mapping of the β and α zebrafish proteins was further performed. HPLC-isolated globins were alkylated with iodoacetamide and proteolyzed with TPCK-trypsin, and the resulting mixtures of proteolytic peptides were analyzed by LC/ESMS. The peptides were designated as corresponding to the known α- and β-globin sequences when their measured average molecular masses matched the ones expected on the basis of the amino acid constitution. An identity of the βA1 globin was confirmed by finding the tryptic peptides encompassing the whole expected sequence (data not shown). Unequivocal identification of the protein eluting in the second HPLC peak as the βA2 globin was made on detection of the tryptic peptides T11 and T13 whose masses were consistent with the presence of 104Lys and 127Ile, respectively (data not shown). The preliminary analysis of tryptic peptides derived from three HPLC peaks carrying the α globins allowed us to confirm more than 60% of the sequence of the αA1 globin. It was also shown that the αA2 globin carried a difference within the tryptic peptide T7 (42Thr — 58Lys) resulting in a 14-Dalton increment in molecular mass of this fragment when compared with that of the corresponding αA1 peptide. Given that intact αA2 globin carries 43-Dalton mass increment over the αA1 , their respective sequences must vary in at least two different positions of the protein chain. In conclusion, the identities of both zebrafish β globins were confirmed, and their mobilities in reversed-phase HPLC were unequivocally established. It was also shown that the most hydrophobic of all detected α globins corresponded to the already cloned zebrafish α globin. Two other α globins αA2 and αA3 were shown to differ from the αA1 by at least two amino acid substitutions.
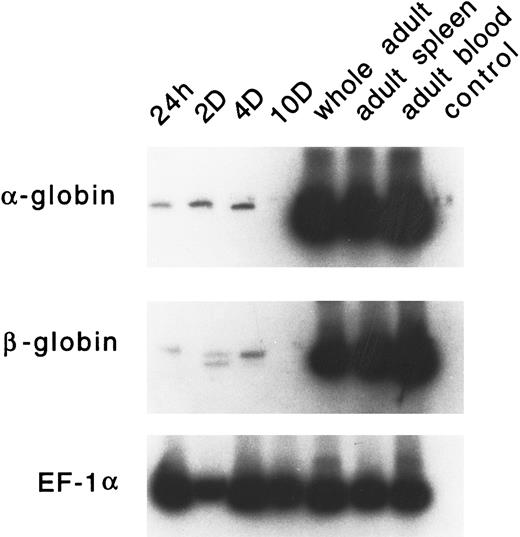
Developmental expression of adult α and β globins.PCR primers were designed for zebrafish α-globin, β-globin (both βA1 and βA2 ), and EF-1α. RT-PCR analysis was performed on RNA samples derived from embryonic RBCs (24 hours, 2 days, 4 days, and 10 days), whole adult, adult spleen, and adult peripheral blood cells. As shown in Fig 10, very low levels of α- or β-globin RNA are expressed in embryonic erythrocytes. The level of these globins is often variable; occasionally, no signal is detected (as seen in the day-10 lane). The expression of the adult α or β globins is not detected in day-1 or day-2 embryos by in situ hybridization (data not shown). High levels of expression of each of these globins was observed in adult erythrocytes and the adult spleen.
RT-PCR analysis of expression of the adult α- and β-globin mRNA in zebrafish embryonic blood at 24 hours, 2 days, 4 days, and 10 days; in a whole adult zebrafish; in a zebrafish adult spleen; and in zebrafish adult blood. EF1-α is used as a control for RNA levels. A reaction with water (lane 4) is used as a negative control.
RT-PCR analysis of expression of the adult α- and β-globin mRNA in zebrafish embryonic blood at 24 hours, 2 days, 4 days, and 10 days; in a whole adult zebrafish; in a zebrafish adult spleen; and in zebrafish adult blood. EF1-α is used as a control for RNA levels. A reaction with water (lane 4) is used as a negative control.
DISCUSSION
Using a variety of molecular biological, chromatographic, and mass spectrometric techniques, we have shown the expression of three major α globins and two major β globins in the adult zebrafish. We have isolated cDNAs that encodes one of these α globins and both of the β globins. Studies are in progress to isolate cDNAs encoding the remaining globins. The sensitivity of the chromatographic and mass spectrometric techniques25 39 will be ideal for determining alterations in globin expression during development and in zebrafish hematopoietic mutants.
Together with those of prior studies, our results show that teleosts have distinct primitive and definitive erythrocyte lineages that express different globins.11-14 Hb switching has been shown for the globins of the lampreys,4 suggesting that the switch mechanism existed in the primordial globin gene locus before duplication that generated α- and β-globin loci. In zebrafish, primitive globins are initially expressed in the intermediate cell mass of Oellacher (ICM; A. Brownlie and L.I. Zon, unpublished data). Although the precise timing of Hb switching remains to be determined, definitive globins are thought to initiate transcription after pronephric hematopoiesis initiates. In adulthood, these globins are expressed in the circulating erythrocytes, mesonephric kidney, and spleen. More careful analysis of gene expression will determine the precise timing of the larval-adult switch in the zebrafish. Thus, in all vertebrate species studied, as the site of hematopoiesis changes during development, globin expression also switches.
The organization of α- and β-globin genes in the zebrafish is unusual compared with the loci of other vertebrates. A similar globin locus structure has recently also been described in the salmon (with a 3′-5′ to 5′-3′ configuration).40 In salmon, the Bohr and non-Bohr globins are linearly arrayed in the same locus (T. McMorrow and F. Gannon, personal communication, June 1994). Because there are three major α globins and two major β globins expressed in the adult, and we have only described the αA1 - and the βA1 -globin gene here, other globin genes must exist. Southern blot analysis of the 2-1 phage clone suggests that the other two α-globin genes and one β-globin gene are present in this clone. We are in the process of isolating and characterizing these genes. The position of the embryonic globins in the locus remains to be determined. In the Xenopus, the embryonic globins flank the adult globins.41 Because the transcriptional units in zebrafish are in the opposite orientation, an inversion event during the evolution of teleosts may have positioned the embryonic globins together or intermixed them with adult globins such as that which occurs in chickens.42 Based on restriction-enzyme digestion patterns, one of the isolated zebrafish genomic DNA clones is distinct and includes another globin that is expressed at a low level in the embryo and the adult (F.Y. Chan and L.I. Zon, unpublished observations). More recently, we have isolated the major embryonic α- and β-globin cDNAs (A. Brownlie and L. Zon, unpublished data). The major embryonic and adult zebrafish globin genes map to the same zebrafish linkage group and are detected on a 550-kb Mlu II fragment (B. Paw, A. Brownlie, L.I. Zon, data not shown). A more detailed analysis of the structure of the globin locus can now be performed in the zebrafish.
The unusual structure of the teleost globin locus raises several points regarding gene transcription. The cyprinids (zebrafish and carp) have the smallest globin genes of any vertebrate isolated to date.43 The introns are small in size, and there is only kb of intervening sequences between the adult αA1 and βA1 globins. It is possible that other globins, embryonic and/or adult, are arrayed as tandem repeats. There is 9 kb of intervening sequences between the Xenopus αA and βA genes, which contains DNAse-I–hypersensitive sites44 that are likely to contain regulatory elements required for appropriate globin expression. We have not yet tested for DNase I hypersensitivity (or LCR elements) in the zebrafish locus. Our RT-PCR analysis shows that the α- and β-globin genes are coordinately expressed. It is possible that the two globin promoters in the 3′-5′ to 5′-3′ configuration would share common cis-elements or enhancer elements in the intervening sequences. Definition of the LCR elements of the zebrafish globin loci and the sequences that cis-regulate in the intervening sequence will lead to intriguing models of the genesis of Hb switching during vertebrate evolution.
ACKNOWLEDGMENT
We thank M. Kieran for providing the genomic DNA library, J. Rast and G. Littman for the spleen cDNA library, T. Thompson for the sample of adult blood RNA, and B. Paw for the adult spleen RNA. We thank B. Detrich for reading this manuscript and T. Gorr and A. Riggs (The University of Texas at Austin) for analyzing our sequences and family lineups. We thank C.H.L. Shackleton for his support in mass spectrometric studies. The cDNAs have been deposited in Genbank under accession no. U50379, U50380, and U50381. The Pst-I fragment of genomic DNA is accession no. U50382.
Supported by National Institutes of Health (NIH) Grants No. 1P50 DK 49216 and 5RO1 HL48801. L.I.Z. is an assistant investigator of the Howard Hughes Medical Institute. H.E.W. and B.-C.L. are supported through the NIH Northern California Comprehensive Sickle Cell Center Grant No. HL20985. The VG BioQ mass spectrometer was purchased from a grant of the NIH Shared Instrumentation Program (RR06505; C.H.L. Shackleton, PI).
Address reprint requests to Leonard I. Zon, MD, Division of Hematology/Oncology, Children's Hospital, 300 Longwood Ave, Enders 650, Boston, MA 02115.



This feature is available to Subscribers Only
Sign In or Create an Account Close Modal