Abstract
UT-7 is a human megakaryoblastic leukemia cell line with absolute dependence on interleukin-3, granulocyte-macrophage colony-stimulating factor (GM-CSF ), or erythropoietin (EPO) for growth and survival. We isolated a novel subline, UT-7/GM after long-term culture of UT-7 with GM-CSF. The hemoglobin concentration and γ-globin and EPO-receptor mRNA levels were significantly higher in EPO-treated UT-7/GM cells than in untreated cells. In contrast, the platelet factor 4 and glycoprotein IIb mRNA levels were much higher in thrombopoietin (TPO)-treated UT-7/GM cells than in untreated cells. Some TPO-treated cells had morphologically mature megakaryocytic characteristics such as a developed demarcation membrane in the cytoplasm and multilobular nuclei. These findings indicate that UT-7/GM is a bipotential cell line that can be induced to differentiate into erythroid and megakaryocytic lineages by EPO and TPO, respectively. Moreover, a minority of UT-7/GM cells acquired a high hemoglobin concentration by treatment with TPO, suggesting that TPO in part induced the erythroid differentiation of the UT-7/GM cells. Interestingly, GM-CSF inhibited the EPO- or TPO-induced erythroid differentiation and the TPO-induced megakaryocytic differentiation of UT-7/GM cells. These results support the hypothesis that cytokines influence the programming of gene expression required for lineage commitment or differentiation.
THROMBOPOIETIN (TPO) PROTEIN has an erythropoietin (EPO) domain with homology to EPO and a unique second domain with potential N-linked glycosylation sites.1 Genomic analysis of TPO has shown that the TPO second domain is similar to the EPO 3′ noncoding sequence, suggesting that the two genes have evolved from a common ancestral sequence by duplication.1 Thus, the proliferation and maturation of megakaryocyte and erythroid precursors are regulated by the structurally and ontogenically related cytokines, TPO and EPO, respectively.1,2 In addition, the transcription factors, GATA-1 and the 45-kD subunit of NF-E2 (NF-E2 p45), which were originally thought to be erythroid-specific, are also expressed in cells of the megakaryocytic lineage.3,4 These findings strongly suggest that erythroid and megakaryocytic cells have a common progenitor.5 This hypothesis is supported by the findings that the majority of human megakaryoblastic or erythroid leukemia cell lines share common properties.6 Thus, the megakaryocyte and erythroid lineages appear to be closely related in ontogeny. Although numerous studies have been done with erythropoiesis and megakaryopoiesis, little is known about the mechanism of the commitment of the common progenitor cells to erythroid versus megakaryocytic lineage. To elucidate this mechanism, it is important to establish a bipotential cell line, which can differentiate into erythroid and megakaryocytic lineages by EPO and TPO, respectively.
We describe here the establishment and characterization of a novel subline of UT-7, a human megakaryoblastic leukemia cell line with absolute dependence on interleukin-3 (IL-3), granulocyte-macrophage colony-stimulating factor (GM-CSF ), or EPO for growth and survival.7 We observed that this subline, UT-7/GM, can differentiate into erythroid cells having a high concentration of hemoglobin by treatment with EPO. In contrast, TPO-treated UT-7/GM cells expressed platelet factor 4 (PF-4) and platelet glycoprotein (GP) IIb, which are specific for megakaryocytic lineage, at the mRNA levels. Thus, UT-7/GM is an erythroid/megakaryocytic bipotential cell line, and it may be a useful model for analyzing the mechanism by which the erythroid versus megakaryocytic differentiation is decided in the common progenitor cells.
MATERIALS AND METHODS
Hematopoietic growth factors and reagents.Recombinant human TPO, IL-3, and stem cell factor (SCF ) were provided by the Kirin Brewery Co, Ltd (Gumma, Japan). Recombinant human EPO was a gift from the Life Science Research Institute of Snow Brand Milk Company (Tochigi, Japan). Recombinant human GM-CSF was provided by Sumitomo Pharmaceutical Company (Osaka, Japan). Recombinant human IL-6 was a gift from Ajinomoto Co Ltd (Tokyo, Japan). A human EPO receptor (EPOR) cDNA was cloned from UT-7.8 Human PF-4 and GPIIb cDNAs were gifts from Dr M Poncz (Children's Hospital of Philadelphia, PA) and Dr Y. Sakata (Jichi Medical School, Tochigi, Japan), respectively. Polyclonal antibody against human EPOR was a gift from Dr O. Miura (Tokyo Medical and Dental University, Tokyo, Japan). A human ribosomal genomic DNA and a human γ-globin cDNA were provided by the Japanese Cancer Research Resources Bank (Tokyo, Japan). A monoclonal antibody (MoAb) raised against phosphotyrosine (anti-P-Tyr) (4G10) and antisera against JAK2 were purchased from Upstate Biotechnology, Inc (Lake Placid, NY). MoAbs P2 (CD41; specific for platelet GPIIb/IIIa) and D2.10 (specific for glycophorin A [GPA]) were purchased from Immunotech (Marseilles, France).
Cell culture and isolation of the subline UT-7/GM.The UT-7 cell line was established from bone marrow (BM) cells obtained from a patient with acute megakaryocytic leukemia.7 UT-7/GM, a novel subline of UT-7, was isolated after long-term culture of UT-7 with GM-CSF and maintained in liquid culture with Iscove's modified Dulbecco's medium (IMDM; GIBCO Laboratories, Grand Island, NY) containing 10% fetal calf serum (FCS; Hyclone Laboratories, Logan, UT) and 1 ng of GM-CSF/mL. UT-7/EPO and UT-7/TPO were continuously maintained in IMDM containing 10% FCS with 1 U of EPO/mL and 10 ng of TPO/mL, respectively.9 10
Colorimetric MTT assay for cell proliferation.Cell growth was also examined by a colorimetric assay according to Mosmann11 with some modification. Briefly, cells were incubated at a density of 1 × 10⁴/0.1 mL in 96-well plates in IMDM containing 5% FCS in the absence or presence of various concentrations of EPO, GM-CSF, IL-3, TPO, IL-6, or SCF. After 72 hours of culture at 37°C, 20 μL of sterilized 5 mg/mL MTT [3-(4.5-dimethylthiazol-2-yl)-2.5-diphenyltetrazolium bromide] (Sigma Chemical Co, St Louis, MO) was added to each well. Following a 2-hour incubation at 37°C, 100 μL of 10% sodium dodecyl sulfate (SDS) was added to each well to dissolve the dark-blue crystal product. The optical density (OD) was measured at a wavelength of 595 nm using a microplate reader (model 3550; Bio Rad, Richmond, CA).
Morphological study.A light microscopy examination was performed on May-Grünwald-Giemsa–stained cytospin preparations. Ultrastructural studies were performed according to standard procedures. In brief, UT-7/GM cells were fixed in 2.5% glutaraldehyde in phosphate buffered saline (PBS) for 20 minutes at 4°C, postfixed with osmium tetroxide, dehydrated, and embedded. Ultrastructural platelet peroxidase activity (PPO) was detected by a conventional method.12
Dianisidine staining.Hemoglobin concentrations were examined by incubating cells in serum-free IMDM medium containing 0.2% 3,3′-dimethoxybenzidine, fast blue B (dianisidine; Sigma), 0.3% acetic acid, and 0.3% H2O2 for 30 minutes at room temperature.13
RNA extraction and Northern blotting.Total RNA was isolated from cells according to the method of Chomczynski and Sacchi.14 RNA was resolved by electrophoresis on agarose formaldehyde gels, transferred to nylon membranes (Zeta-probe; Bio Rad) in 10× standard sodium citrate (SSC) and hybridized to human cDNA fragments for EPOR, γ-globin, PF-4 or GPIIb, and human ribosomal DNA probe as a standard control. These fragments were labeled with 32P-αCTP by random-priming. After an overnight incubation at 43°C in the presence of 50% formamide, blots were washed three times with 2× SSC, 0.5× SSC, 0.1× SSC, plus 0.1% SDS for 15 minutes each. The membranes were autoradiographed using Kodak XAR-5 film (Eastman Kodak, Rochester, NY) with an intensifying screen at −70°C.
Preparation of cell lysates, immunoprecipitation, and Western blotting.UT-7/GM cells were starved of growth factor for 24 hours. After stimulation with cytokines at 37°C for 5 minutes, cells were lysed on ice in lysis buffer composed of 20 mmol/L Tris (pH 7.4), 137 mmol/L NaCl, 10% glycerol, 1% NP-40, 1 mmol/L phenylmethylsulfonylfluoride (PMSF ), 15 mg/mL aprotinin, and 2 mmol/L sodium orthovanadate. After 30 minutes of incubation on ice, insoluble materials were removed by centrifugation at 15,000g for 10 minutes. The supernatants were immunoprecipitated with EPOR, c-Mpl, or JAK2 polyclonal antibody coated to Protein G Sepharose (Pharmacia Biotech AB, Uppsala, Sweden) for 4 hours at 4°C in an Eppendorf shaker. Immunoprecipitates were collected by a brief centrifugation and washed three times with 1 mL of lysis buffer. The immunoprecipitated proteins were boiled for 5 minutes in SDS-polyacrylamide gel electrophoresis (SDS-PAGE) sample buffer. After a brief centrifugation, the supernatants were resolved by SDS-PAGE then electroblotted onto a nitrocellulose membrane. The blots were blocked with 3% low-fat milk in PBS for 30 minutes at room temperature, then incubated with the appropriate concentration of primary antibodies, including anti-P-Tyr MoAb 4G10, overnight at 4°C. After washing with PBS containing Tween 20 (1:2,000), the blots were probed with a 1:1,000 dilution of goat antimouse or goat antirabbit horseradish peroxidase-conjugated second antibodies for 90 minutes at room temperature. After a second wash, the blots were incubated with an enhanced chemiluminescence substrate (Amersham, Arlington Heights, IL) and exposed to Hyperfilm ECL (Amersham) to visualize immunoreactive bands. In some experiments, the blots were stripped with 62.5 mmol/L Tris-HCl, pH 6.8, 2% SDS, 100 mmol/L β-mercaptoethanol at 50°C for 30 minutes washed, blocked, and reprobed.
Colony assay.The colony assay was performed according to a modification of the method of Fauser and Messner.15 The UT-7/GM cells were suspended in a medium containing 0.9% methylcellulose (Dow Chemical, Midland, MI), 30% FCS, 1% bovine serum albumin (BSA, Sigma), and 1 ng GM-CSF/mL. Aliquots of culture medium (1 mL) containing 500 cells were cultured in 35-mm nontissue culture dishes (Falcon, Oxnard, CA) at 37°C in a 5% CO2 humidified atmosphere for 10 days, then single colony was picked up under an inverted microscope and transferred to the liquid culture medium.
Analysis of cell surface markers by immunofluorescence.Cell-surface antigens were detected by immunofluorescence staining with P2 or D2.10 MoAb. In brief, UT-7/GM cells or their subclones were incubated for 30 minutes at 4°C with the appropriately diluted antibody. After washing, the cells were incubated with fluorescein-labeled second antibody for 30 minutes at 4°C. After a second washing, signals were analyzed using a Becton Dickinson Flow Cytometer (FACScan; Becton Dickinson, Mountain View, CA), using 10,000 cells for each sample.
Cell-cycle analysis.Cell-cycle analysis was performed by staining DNA with propidium iodide in preparation for flow cytometry with the FACScan/CellFIT system (Becton Dickinson, San Jose, CA).
RESULTS
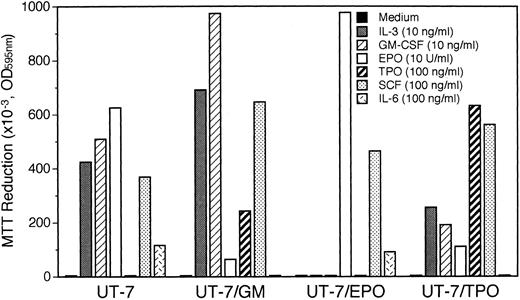
Establishment of UT-7/GM cell line.UT-7 was originally established from the BM cells obtained from a patient with acute megakaryoblastic leukemia.7 We have maintained UT-7 with 1 ng of GM-CSF/mL. About 2 years after we obtained the UT-7 cells, we found that UT-7 acquired high growth capacity in response to GM-CSF. We picked up a single colony from a methylcellulose semisolid medium and transferred it to the liquid culture medium containing 1 ng GM-CSF/mL. The cells soon began to grow and were maintained for more than 1 year without any marked changes in morphology and developmental features. We designated the novel subline as UT-7/GM. Figure 1 shows the profiles of proliferative response to various cytokines. UT-7/GM responded to GM-CSF, IL-3, SCF, and to a lesser degree, to TPO, but not to IL-6. Although the original UT-7 cells can proliferate in response to EPO very well,7 the UT-7/GM cells responded slightly to EPO, indicating that the UT-7/GM cells differed from UT-7 cells in the responsiveness to several cytokines including EPO, TPO, and IL-6.
Profiles of proliferative responses of UT-7/GM cells to various cytokines. Proliferative responses of UT-7/GM cells to cytokines were analyzed by the MTT assay (see Materials and Methods). Cells were plated at a density of 104/well in IMDM supplemented with 5% FCS and cultured with TPO (100 ng/mL), IL-3 (10 ng/mL), GM-CSF (10 ng/mL), EPO (10 U/mL), SCF (100 ng/mL), or IL-6 (100 ng/mL). MTT reduction was measured after 3 days of culture. The values represent the mean ± SD from triplicate cultures.
Profiles of proliferative responses of UT-7/GM cells to various cytokines. Proliferative responses of UT-7/GM cells to cytokines were analyzed by the MTT assay (see Materials and Methods). Cells were plated at a density of 104/well in IMDM supplemented with 5% FCS and cultured with TPO (100 ng/mL), IL-3 (10 ng/mL), GM-CSF (10 ng/mL), EPO (10 U/mL), SCF (100 ng/mL), or IL-6 (100 ng/mL). MTT reduction was measured after 3 days of culture. The values represent the mean ± SD from triplicate cultures.
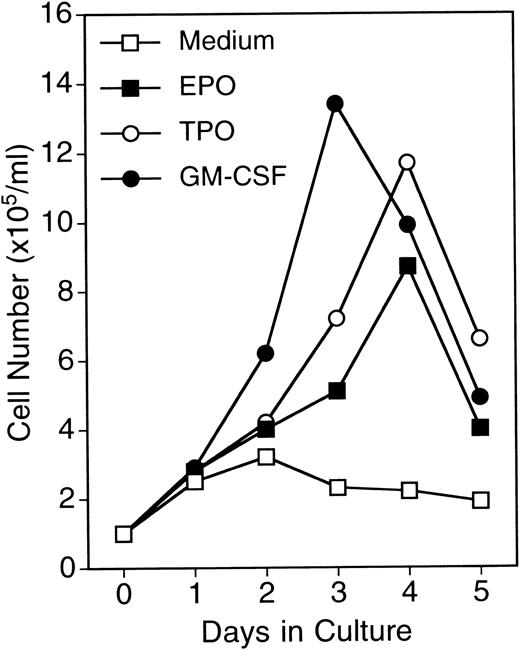
The UT-7 cell line has a saturation density of 5 × 10⁵ mL and doubling time of 36 hours in a log phase.7 In contrast, in the presence of GM-CSF (10 ng/mL), the UT-7/GM cells had a saturation density of more than 1 × 10⁶/mL without a decrease in cell viability and a doubling time of 24 hours in log growth phase10 (Fig 2). The growth activity of GM-CSF, EPO, or TPO toward UT-7/GM cells in liquid culture was almost the same as the data from the MTT assay (Figs 1 and 2). When GM-CSF was removed from the culture, however, the cells died completely within a few days. This indicates that UT-7/GM also has absolute dependence on GM-CSF for growth and survival, as did the original UT-7.7
Growth curves of UT-7/GM cells in suspension culture. UT-7/GM cells were cultured in tissue culture flasks with GM-CSF (10 ng/mL), EPO (10 U/mL), TPO (100 ng/mL), or their combinations. Viable cell numbers were assessed by trypan blue dye exclusion.
Growth curves of UT-7/GM cells in suspension culture. UT-7/GM cells were cultured in tissue culture flasks with GM-CSF (10 ng/mL), EPO (10 U/mL), TPO (100 ng/mL), or their combinations. Viable cell numbers were assessed by trypan blue dye exclusion.
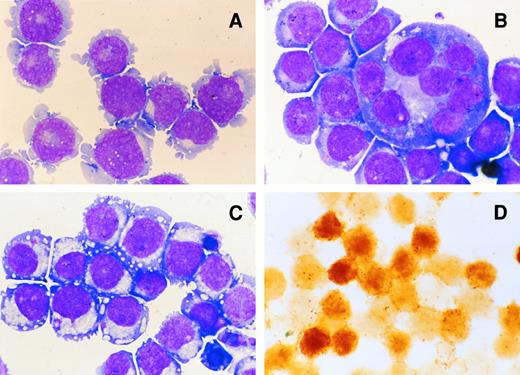
Figure 3A shows the morphological characteristics of UT-7/GM. The cytospin smear contained cells with a prominent nucleolus in the nucleus and cytoplasmic blebs.
Morphological characteristics of UT-7/GM cells in liquid culture. Cytospin smears of May-Giemsa–stained UT-7/GM cells cultured with GM-CSF (A; original magnification × 400), TPO (B; original magnification × 400), or EPO (C; original magnification × 400), and dianisidine-stained UT-7/GM cells shown in C (D; original magnification × 250). UT-7/GM cells were cultured with GM-CSF (10 ng/mL), TPO (100 ng/mL), or EPO (10 U/mL). One month later, the cells were obtained for the preparation of cytospin smears.
Morphological characteristics of UT-7/GM cells in liquid culture. Cytospin smears of May-Giemsa–stained UT-7/GM cells cultured with GM-CSF (A; original magnification × 400), TPO (B; original magnification × 400), or EPO (C; original magnification × 400), and dianisidine-stained UT-7/GM cells shown in C (D; original magnification × 250). UT-7/GM cells were cultured with GM-CSF (10 ng/mL), TPO (100 ng/mL), or EPO (10 U/mL). One month later, the cells were obtained for the preparation of cytospin smears.
Electron microscopic photographs of UT-7/GM cells cultured under various conditions. UT-7/GM cells were cultured with EPO (10 U/mL) or TPO (100 ng/mL). One month later, the cells were obtained for the analysis. (A) A representative UT-7/GM cell cultured with EPO. The cytoplasm of the cell is darker than the nucleus, implying the presence of hemoglobin. Insert shows higher magnification of atypical theta granules (arrow). Counterstaining was performed with lead citrate and uranyl acetate. Scale marker indicates 2 μm. (B) A representative UT-7/GM cell cultured with TPO. A multinucleated cell having developed demarcation membrane systems is shown. (C) Detection of PPO activity in a cell cultured with TPO. PPO activity is observed in nuclear envelope and rough endoplasmic reticulum of a large binuclear cell. Scale marker indicates 2 μm.
Electron microscopic photographs of UT-7/GM cells cultured under various conditions. UT-7/GM cells were cultured with EPO (10 U/mL) or TPO (100 ng/mL). One month later, the cells were obtained for the analysis. (A) A representative UT-7/GM cell cultured with EPO. The cytoplasm of the cell is darker than the nucleus, implying the presence of hemoglobin. Insert shows higher magnification of atypical theta granules (arrow). Counterstaining was performed with lead citrate and uranyl acetate. Scale marker indicates 2 μm. (B) A representative UT-7/GM cell cultured with TPO. A multinucleated cell having developed demarcation membrane systems is shown. (C) Detection of PPO activity in a cell cultured with TPO. PPO activity is observed in nuclear envelope and rough endoplasmic reticulum of a large binuclear cell. Scale marker indicates 2 μm.
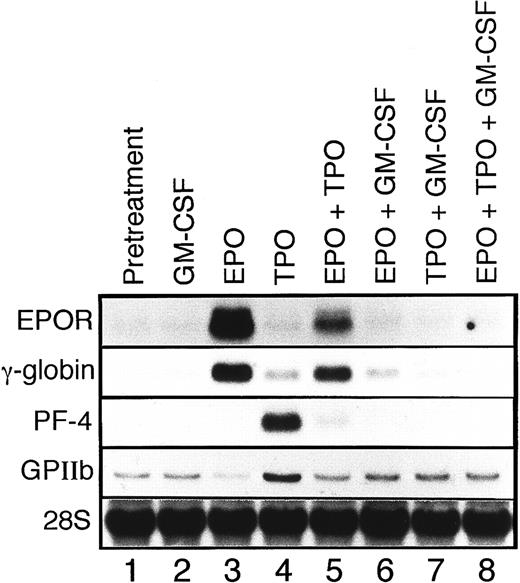
EPO induces erythroid differentiation of UT-7/GM cells.When the UT-7/GM cells were cultured with EPO instead of GM-CSF, we noted that the cell pellet had turned reddish. This observation suggested that the UT-7/GM cells had differentiated into erythroid cells having a high concentration of hemoglobin in the presence of EPO. To confirm this possibility, we stained the cells with dianisidine to detect hemoglobin synthesis. As shown in Fig 3D, when the cells were treated with EPO for 2 weeks, the majority of the cells were positive for dianisidine staining. Dianisidine-positive cells increased from zero to more than 90% within 2 weeks. The cytospin smear contained cells having pale spots in the perinuclear areas and some cells became condensed. Electron microscopic analysis revealed that, in addition to developed Golgi apparatus, a theta granule16 was detected (Fig 4A). The cytoplasm of the cell was darker than the nucleus, implying the presence of hemoglobin (Fig 4A). To further characterize the EPO-treated UT-7/GM cells, we examined the expression of EPOR and γ-globin mRNAs by Northern blot analysis. The level of EPOR and γ-globin mRNAs clearly increased after the treatment with EPO for 4 weeks (Fig 5). These observations confirmed the hypothesis that UT-7/GM cells became mature erythroid-like cells in the presence of EPO.
Northern blot analysis of megakaryocyte or erythroid maturation-associated genes. UT-7/GM cells were cultured in tissue culture flasks with GM-CSF (10 ng/mL), EPO (10 U/mL), TPO (100 ng/mL), or their combinations. One month later, the cells were obtained and prepared for isolation of total cellular RNA. The expression of EPOR, γ-globin, PF-4, and GPIIb mRNAs was examined by Northern blotting. The membrane was rehybridized with 32P-labeled human ribosomal DNA probe to show the amount of RNA loaded.
Northern blot analysis of megakaryocyte or erythroid maturation-associated genes. UT-7/GM cells were cultured in tissue culture flasks with GM-CSF (10 ng/mL), EPO (10 U/mL), TPO (100 ng/mL), or their combinations. One month later, the cells were obtained and prepared for isolation of total cellular RNA. The expression of EPOR, γ-globin, PF-4, and GPIIb mRNAs was examined by Northern blotting. The membrane was rehybridized with 32P-labeled human ribosomal DNA probe to show the amount of RNA loaded.
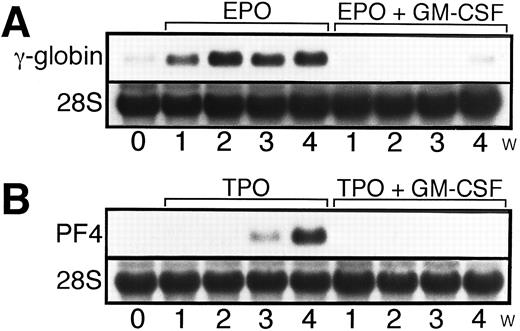
Time course of hemoglobin synthesis induced by EPO.To obtain the further information about hemoglobin synthesis induced by EPO, we harvested the cells cultured for the indicated times and stained them with dianisidine. As shown in Fig 6, dianisidine-positive cells were detected in 1 week, and more than 90% of the cells became positive for dianisidine staining within 2 weeks. This was confirmed by Northern blot analysis. In accordance with the data on dianisidine staining, the γ-globin mRNA level clearly elevated in 1 week and the level peaked in 2 weeks as shown in Fig 7A.
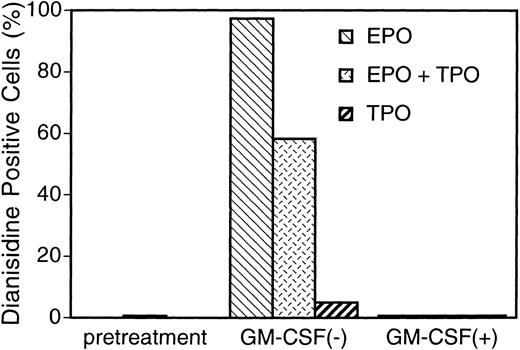
Increase in hemoglobin synthesis by EPO and TPO, and suppression by GM-CSF in UT-7/GM cells. UT-7/GM cells were cultured in tissue culture flasks with GM-CSF (10 ng/mL), EPO (10 U/mL), TPO (100 ng/mL), or their combinations. Two weeks later, the cells cultured under various conditions were obtained and stained with dianisidine as described in Materials and Methods.
Increase in hemoglobin synthesis by EPO and TPO, and suppression by GM-CSF in UT-7/GM cells. UT-7/GM cells were cultured in tissue culture flasks with GM-CSF (10 ng/mL), EPO (10 U/mL), TPO (100 ng/mL), or their combinations. Two weeks later, the cells cultured under various conditions were obtained and stained with dianisidine as described in Materials and Methods.
Time course of expression of megakaryocyte or erythroid maturation-associated genes after treatment of UT-7/GM cells with EPO, TPO, or a combination with GM-CSF. UT-7/GM cells were cultured in tissue culture flasks with EPO (10 U/mL), EPO (10 U/mL) plus GM-CSF (10 ng/mL), TPO (100 ng/mL), and TPO (100 ng/mL) plus GM-CSF (10 ng/mL) for the times indicated. The cells were then harvested and prepared for isolation of total cellular RNA. The expression of γ-globin (A) and PF-4 (B) mRNAs was examined by Northern blotting. The membrane was rehybridized with 32P-labeled human ribosomal DNA probe to show the amount of RNA loaded.
Time course of expression of megakaryocyte or erythroid maturation-associated genes after treatment of UT-7/GM cells with EPO, TPO, or a combination with GM-CSF. UT-7/GM cells were cultured in tissue culture flasks with EPO (10 U/mL), EPO (10 U/mL) plus GM-CSF (10 ng/mL), TPO (100 ng/mL), and TPO (100 ng/mL) plus GM-CSF (10 ng/mL) for the times indicated. The cells were then harvested and prepared for isolation of total cellular RNA. The expression of γ-globin (A) and PF-4 (B) mRNAs was examined by Northern blotting. The membrane was rehybridized with 32P-labeled human ribosomal DNA probe to show the amount of RNA loaded.
TPO induces megakaryocytic differentiation of UT-7/GM cells.When the UT-7/GM cells were cultured with TPO alone, some cells became bigger than before. As expected, the cytospin smear of TPO-treated UT-7/GM cells contained cells similar to mature megakaryocytes with multilobular nuclei (Fig 3B). The electron microscopic analysis revealed that large cells have a developed demarcation membrane in the cytoplasm and that most of the cells had positive platelet peroxidase activity (Fig 4B and 4C). This finding suggested that some of them differentiated into more mature megakaryocytic cells in the presence of TPO. To investigate whether TPO indeed induced megakaryocytic differentiation of UT-7/GM cells, we checked the expression of GPIIb and PF-4 mRNAs by Northern blot analysis. As shown in Fig 5, PF-4 mRNA was clearly detected in 4 weeks, and the intensity of GPIIb mRNA band definitely increased. Moreover, the time course study demonstrated that PF-4 mRNA was slightly detected in 2 weeks and clearly detected in 3 weeks (Fig 7B). These observations suggested that TPO induced megakaryocytic differentiation of UT-7/GM cells.
TPO slightly induces erythroid differentiation of UT-7/GM cells.Recently it has been reported that TPO has erythroid burst-promoting activity (BPA) in vitro and promotes the recovery of red blood cells from anticancer drug-induced BM suppression.17 18 These observations prompted us to examine whether or not TPO induces erythroid differentiation of UT-7/GM. As shown in Fig 6, more than 5% of the cells were positive for the dianisidine staining after culturing with TPO for 2 weeks. In parallel with this finding, the level of γ-globin mRNA increased slightly in the cells harvested after culturing with TPO for 4 weeks (Fig 5). These observations suggested that TPO partly induced erythroid differentiation of UT-7/GM cells, although this activity was much weaker than EPO.
EPO- or TPO-induced erythroid differentiation of UT-7/GM is completely suppressed in the presence of GM-CSF.We found that the cell pellets never became reddish in the presence of GM-CSF, even if the cells were cultured in the presence of EPO. This observation suggested that GM-CSF inhibited the EPO-induced erythroid differentiation of UT-7/GM cells. To confirm this possibility, we performed the dianisidine staining and Northern blot analysis with erythroid-specific genes, EPOR and γ-globin cDNAs. As shown in Fig 5, the mRNA expression of these genes was completely suppressed by GM-CSF even in the presence of EPO. This suppression was observed during the observation period (0 to 4 weeks) (Fig 7). This was also confirmed by the finding that dianisidine-positive cells could not be observed even in the presence of EPO when the culture medium contained GM-CSF. We examined whether or not the TPO-induced erythroid differentiation of UT-7/GM cells was also inhibited by GM-CSF. Dianisidine-positive cells could not be observed in the culture medium containing both TPO and GM-CSF (Fig 6).
TPO-induced megakaryocytic differentiation of UT-7/GM is also suppressed in the presence of GM-CSF.As shown in Fig 7, PF-4 mRNA was detected in the cells treated with TPO alone, but it was not detected in the cells treated with both GM-CSF and TPO during the observation period (0 to 4 weeks). These findings indicate that the TPO-induced megakaryocytic differentiation of UT-7/GM cells was also inhibited in the presence of GM-CSF.
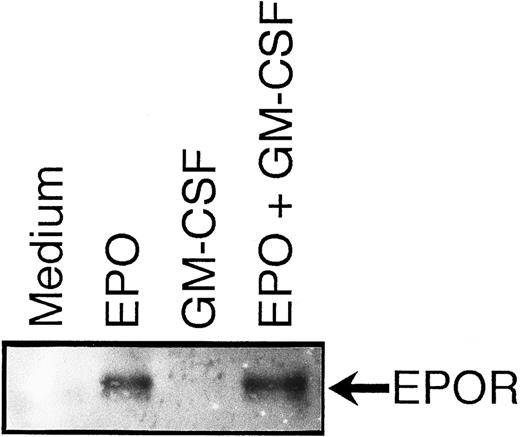
Suppression by GM-CSF of EPO-induced erythroid differentiation occurs downstream of the EPO receptor.To clarify the mechanism by which GM-CSF blocks the EPO-induced erythroid differentiation, we examined whether GM-CSF inhibited EPO-induced tyrosine phosphorylation of EPOR. Growth-factor–starved UT-7/GM cells were pretreated with GM-CSF and then stimulated with EPO. EPO induced tyrosine phosphorylation of EPOR even in the presence of GM-CSF (Fig 8). This finding suggests that the suppression by GM-CSF of EPO-induced erythroid differentiation occurs downstream of the EPO receptor.
Suppression by GM-CSF of EPO-induced erythroid differentiation occurs downstream of the EPO receptor. GM-CSF was removed from UT-7/GM cells overnight. The cells were pretreated with medium alone (lanes 1 and 2) or GM-CSF (10 ng/mL; lanes 3 and 4) for 5 minutes and then stimulated with medium alone (lanes 1 and 3) or EPO (10 U/mL; lanes 2 and 4) for 5 minutes before solubilization. Cell lysates were immunoprecipitated with agarose-conjugated anti-EPOR antibody. Immunoprecipitates were eluted with buffer containing SDS and resolved by 7.5% SDS-PAGE. Proteins were transferred onto a nitrocellulose membrane and blotted with anti-P-Tyr MoAb (4G10).
Suppression by GM-CSF of EPO-induced erythroid differentiation occurs downstream of the EPO receptor. GM-CSF was removed from UT-7/GM cells overnight. The cells were pretreated with medium alone (lanes 1 and 2) or GM-CSF (10 ng/mL; lanes 3 and 4) for 5 minutes and then stimulated with medium alone (lanes 1 and 3) or EPO (10 U/mL; lanes 2 and 4) for 5 minutes before solubilization. Cell lysates were immunoprecipitated with agarose-conjugated anti-EPOR antibody. Immunoprecipitates were eluted with buffer containing SDS and resolved by 7.5% SDS-PAGE. Proteins were transferred onto a nitrocellulose membrane and blotted with anti-P-Tyr MoAb (4G10).
The effects of TPO or EPO alone, or their combination with GM-CSF on the tyrosine phosphorylation of JAK2 in UT-7/GM cells.To determine the relationship between JAK2 activation and erythroid or megakaryocytic differentiation, we examined the effects of TPO or EPO alone, and their combination with GM-CSF on the tyrosine phosphorylation of JAK2 in UT-7/GM cells. In accordance with published results from other laboratories, EPO, TPO, and GM-CSF alone induced the tyrosine phosphorylation of JAK2 (Fig 9). Additive, but neither synergistic nor antagonistic, effects were evident among these cytokines in JAK2 tyrosine phosphorylation.
Induction of tyrosine phosphorylation of JAK2 after stimulation of UT-7/GM cells with GM-CSF, EPO, TPO, or their combinations. GM-CSF was removed from UT-7/GM cells overnight. The cells were then stimulated with medium alone, TPO (100 ng/mL), EPO (10 U/mL), GM-CSF (10 ng/mL), or their combinations for 5 minutes before solubilization. Cell lysates were immunoprecipitated with Protein G Sepharose-conjugated anti-JAK2 serum. Immunoprecipitates were eluted with buffer containing SDS and resolved by 7.5% SDS-PAGE. Proteins were transferred onto a nitrocellulose membrane. (A) Immunoblotting with anti-P-Tyr antibody (4G10). (B) Immunoblotting with anti-JAK2 serum. The blot was reprobed with anti-JAK2 serum to confirm equal loading of the samples. (C) Densitometric analysis of tyrosine phosphorylated JAK2 proteins. (D) The effects of EPO, TPO, GM-CSF, or their combinations on the proliferation of UT-7/GM cells. Proliferative responses of UT-7/GM cells to cytokines were analyzed by the MTT assay (see Materials and Methods). Cells were plated at a density of 104/well in IMDM supplemented with 5% FCS and cultured with TPO (100 ng/mL), GM-CSF (10 ng/mL), EPO (10 U/mL), or their combinations. MTT reduction was measured after 3 days of culture. The values represent the mean ± SD from triplicate cultures.
Induction of tyrosine phosphorylation of JAK2 after stimulation of UT-7/GM cells with GM-CSF, EPO, TPO, or their combinations. GM-CSF was removed from UT-7/GM cells overnight. The cells were then stimulated with medium alone, TPO (100 ng/mL), EPO (10 U/mL), GM-CSF (10 ng/mL), or their combinations for 5 minutes before solubilization. Cell lysates were immunoprecipitated with Protein G Sepharose-conjugated anti-JAK2 serum. Immunoprecipitates were eluted with buffer containing SDS and resolved by 7.5% SDS-PAGE. Proteins were transferred onto a nitrocellulose membrane. (A) Immunoblotting with anti-P-Tyr antibody (4G10). (B) Immunoblotting with anti-JAK2 serum. The blot was reprobed with anti-JAK2 serum to confirm equal loading of the samples. (C) Densitometric analysis of tyrosine phosphorylated JAK2 proteins. (D) The effects of EPO, TPO, GM-CSF, or their combinations on the proliferation of UT-7/GM cells. Proliferative responses of UT-7/GM cells to cytokines were analyzed by the MTT assay (see Materials and Methods). Cells were plated at a density of 104/well in IMDM supplemented with 5% FCS and cultured with TPO (100 ng/mL), GM-CSF (10 ng/mL), EPO (10 U/mL), or their combinations. MTT reduction was measured after 3 days of culture. The values represent the mean ± SD from triplicate cultures.
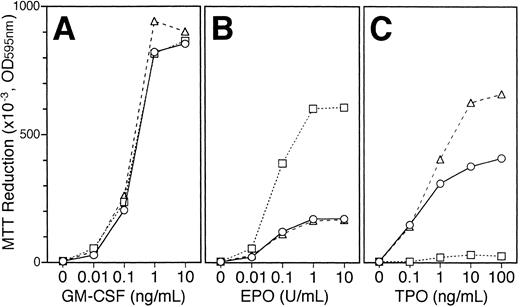
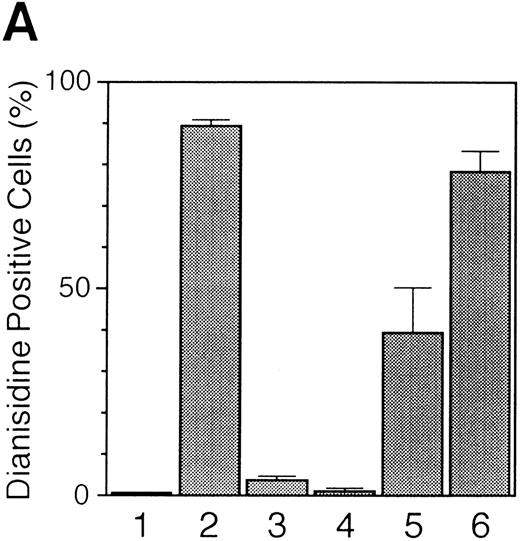
Changes in responsiveness to EPO or TPO in the UT-7/GM cells maintained with TPO or EPO.We examined the changes in the responsiveness of UT-7/GM cells to EPO or TPO after culturing UT-7/GM with EPO (10 U/mL) or TPO (100 ng/mL). As shown in Fig 10, when UT-7/GM cells were continuously cultured with TPO for 4 weeks, they gained higher sensitivity to TPO but responded slightly to EPO. When UT-7/GM cells were continuously cultured with EPO, they increased in sensitivity to EPO but completely lost responsiveness to TPO. However, the cells exposed to EPO for 4 weeks still proliferated in response to GM-CSF to the same extent as untreated UT-7/GM cells (Fig 10). When the EPO-treated cells were again cultured with GM-CSF alone, the majority of the cells turned negative for dianisidine staining in 1 week (Fig 11A lane 3). When the cells were again exposed to EPO for 2 weeks, most of the cells were positive for dianisidine staining (Fig 11A, lane 6). These kinetics were consistent with those of γ-globin transcripts (Fig 11B). In addition, the response profiles of EPO-treated cells to EPO and TPO after 2 weeks of reexposure to GM-CSF were similar to those of the parent UT-7/GM cells (data not shown). Taken together with the evidence that there was no difference in sensitivity to GM-CSF between the parent UT-7/GM and EPO-treated UT-7/GM cells (Fig 10), our observations suggested that the EPO-induced erythroid differentiation of UT-7/GM cells was a reversible change.
Changes in responsiveness to EPO or TPO in the UT-7/GM cells maintained with TPO or EPO. UT-7/GM cells were cultured with TPO (100 ng/mL), or EPO (10 U/mL). One month later, the cells were obtained and plated at a density of 104/well in IMDM supplemented with 5% FCS, and cultured with increasing concentrations of GM-CSF (A; 0.01 to 10 ng/mL), EPO (B; 0.01 to 10 U/mL) or TPO (C; 0.1 to 100 ng/mL). MTT reduction was measured after 3 days of culture. The values represent the mean ± SD from triplicate cultures. UT-7/GM cells, ○; UT-7/GM cells cultured with EPO for 1 month, □; UT-7/GM cells cultured with TPO for 1 month, ▵.
Changes in responsiveness to EPO or TPO in the UT-7/GM cells maintained with TPO or EPO. UT-7/GM cells were cultured with TPO (100 ng/mL), or EPO (10 U/mL). One month later, the cells were obtained and plated at a density of 104/well in IMDM supplemented with 5% FCS, and cultured with increasing concentrations of GM-CSF (A; 0.01 to 10 ng/mL), EPO (B; 0.01 to 10 U/mL) or TPO (C; 0.1 to 100 ng/mL). MTT reduction was measured after 3 days of culture. The values represent the mean ± SD from triplicate cultures. UT-7/GM cells, ○; UT-7/GM cells cultured with EPO for 1 month, □; UT-7/GM cells cultured with TPO for 1 month, ▵.
Reversible changes in the EPO-induced erythroid differentiation. UT-7/GM cells (lanes 1 and 7) were exposed to EPO (10 U/mL) for 4 weeks (lanes 2 and 8) and sequentially cultured with GM-CSF (10 ng/mL) alone for 1 week (lane 3) or 2 weeks (lanes 4 and 9). Then, the cells were obtained and prepared for the detection of hemoglobin synthesis, and the rest were sequentially cultured with EPO (10 U/mL) alone for 1 week (lane 5) or 2 weeks (lanes 6 and 10) and harvested. (A) Dianisidine-staining. (B) Northern blot analysis of γ-globin gene. The membrane was rehybridized with 32P-labeled β-actin cDNA probe to show the amount of RNA loaded.
Reversible changes in the EPO-induced erythroid differentiation. UT-7/GM cells (lanes 1 and 7) were exposed to EPO (10 U/mL) for 4 weeks (lanes 2 and 8) and sequentially cultured with GM-CSF (10 ng/mL) alone for 1 week (lane 3) or 2 weeks (lanes 4 and 9). Then, the cells were obtained and prepared for the detection of hemoglobin synthesis, and the rest were sequentially cultured with EPO (10 U/mL) alone for 1 week (lane 5) or 2 weeks (lanes 6 and 10) and harvested. (A) Dianisidine-staining. (B) Northern blot analysis of γ-globin gene. The membrane was rehybridized with 32P-labeled β-actin cDNA probe to show the amount of RNA loaded.
The effects of IL-3, SCF alone, or their combination with EPO, TPO, or GM-CSF on the erythroid differentiation of UT-7/GM.Because both IL-3 and SCF play an important role in erythropoiesis,19 20 we examined the effect of these cytokines on the erythroid differentiation of UT-7/GM cells. As shown in Table 1, about 10% of the cells treated with IL-3 or SCF alone were positive for dianisidine staining. This promoting activity of SCF was almost the same as that of IL-3 (11.0% v 7.7%). However, these activities were completely suppressed by GM-CSF, suggesting that GM-CSF acts predominantly over IL-3 and SCF on the erythroid differentiation of UT-7/GM cells. Unlike GM-CSF, both IL-3 and SCF partially but not completely inhibit the EPO-induced erythroid differentiation. We examined whether SCF, IL-3, and TPO induced erythroid differentiation of UT-7/GM cells mediated through the activation of EPOR. EPOR was tyrosine phosphorylated by EPO but not SCF, IL-3, or TPO (data not shown).
Effect of IL-3 and SCF on Hemoglobin Synthesis in UT-7/GM Cells
| Cytokines . | Dianisidine-Positive Cells (%) . |
|---|---|
| EPO | 93.0 ± 1.0 |
| TPO | 7.5 ± 0.6 |
| GM-CSF | 0 |
| GM-CSF + EPO | 0 |
| GM-CSF + TPO | 0 |
| GM-CSF + IL-3 | 0 |
| GM-CSF + SCF | 0 |
| IL-3 | 7.7 ± 0.6 |
| IL-3 + EPO | 24.3 ± 1.5 |
| IL-3 + TPO | 5.7 ± 0.6 |
| SCF | 11.0 ± 1.0 |
| SCF + EPO | 46.0 ± 1.7 |
| SCF + TPO | 9.0 ± 2.7 |
UT-7/GM cells were cultured in tissue culture flasks with EPO (10 U/mL), TPO (100 ng/mL), GM-CSF (10 ng/mL), IL-3 (10 ng/mL), SCF (100 ng/mL), or their combinations. Two weeks later, the cells were harvested and prepared for dianidisine staining. Dianidisine-positive cells were counted. The data are mean ± SD from triplicate cultures.
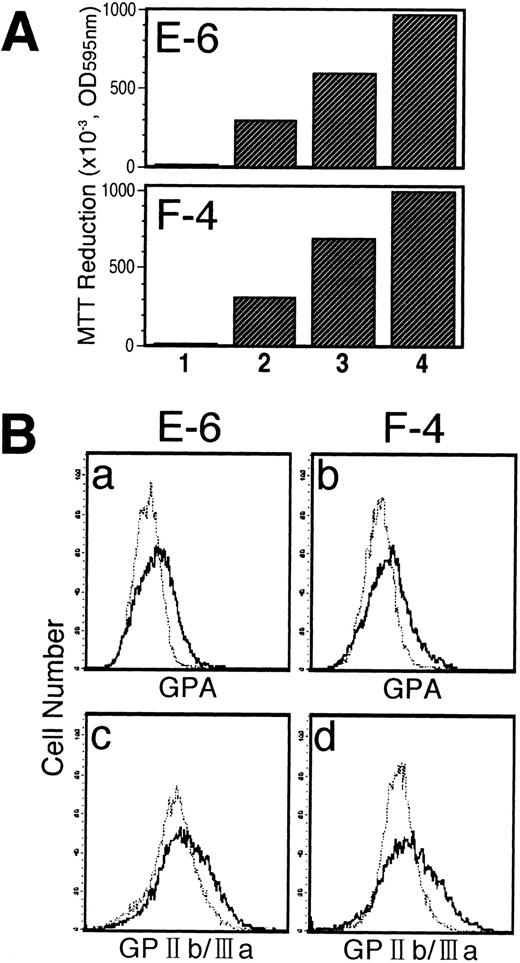
UT-7/GM subclones also have the same properties as the parent UT-7/GM.We observed that EPO or TPO alone could maintain the growth of UT-7/GM cells for at least 4 weeks, finally leading to the cells having mature erythroid or megakaryocytic features. It is possible that EPO selectively stimulated the growth of dianisidine-positive UT-7/GM cells during the observation period. However, it is also possible that TPO specifically promoted the growth of the UT-7/GM cells expressing PF 4 mRNA. Thus, our observations may be explained by clonal expansion. To exclude this possibility, we resubcloned UT-7/GM cells and randomly selected two clones (E-6 and F-4) and compared them with the parent UT-7/GM. As expected, there were no significant differences among them in responsiveness to GM-CSF, EPO, and TPO (Fig 12A). In addition, short-term exposure (7 days) to EPO and TPO enhanced the expression of GPA (specific for erythroid lineage) and GPIIb/IIIa (specific for megakaryocytic lineage) antigens, respectively, on the cell surface of the two clones (E-6 and F-4) (Fig 12B). More than 30% of the cells became dianisidine-positive after 7 days of exposure to EPO in both clones (data not shown). The “decision” of differentiation toward erythroid or megakaryocytic lineage thus occurred in 1 week. Considering that the EPO-induced erythroid differentiation of UT/GM cells is a reversible change (Fig 11), our observations would exclude the possibility that clonal expansion occurred during the treatment with these cytokines.
Characterization of UT-7/GM subclones. (A) Growth profiles of UT-7/GM subclones to several cytokines. UT-7/GM cells were subcloned by picking up a single colony formed in the semisolid culture containing methylcellulose medium. Each colony was expanded in liquid suspension culture in the presence of GM-CSF (1 ng/mL). Proliferative responses of UT-7/GM subclones (E-6 and F-4) to cytokines were analyzed by the MTT assay (see Materials and Methods). Cells were plated at a density of 104/well in IMDM supplemented with 5% FCS and cultured with medium alone (lane 1), EPO (10 U/mL; lane 2), TPO (100 ng/mL; lane 3), or GM-CSF (10 ng/mL; lane 4). MTT reduction was measured after 3 days of culture. The values represent the mean ± SD from triplicate cultures. (B) The effect of EPO or TPO on the erythroid or megakaryocytic differentiation of E-6 (a and c) and F-4 (b and d). After complete removal of GM-CSF from the conditioned media, EPO (10 U/mL; a and b) or TPO (100 ng/mL; c and d) was added to the liquid culture. One week later, the cells were obtained and prepared for analysis of cell-surface markers (GPA & GPIIb/IIIa) by immunofluorescence. Thin line, treatment with GM-CSF; thick line, treatment with EPO or TPO.
Characterization of UT-7/GM subclones. (A) Growth profiles of UT-7/GM subclones to several cytokines. UT-7/GM cells were subcloned by picking up a single colony formed in the semisolid culture containing methylcellulose medium. Each colony was expanded in liquid suspension culture in the presence of GM-CSF (1 ng/mL). Proliferative responses of UT-7/GM subclones (E-6 and F-4) to cytokines were analyzed by the MTT assay (see Materials and Methods). Cells were plated at a density of 104/well in IMDM supplemented with 5% FCS and cultured with medium alone (lane 1), EPO (10 U/mL; lane 2), TPO (100 ng/mL; lane 3), or GM-CSF (10 ng/mL; lane 4). MTT reduction was measured after 3 days of culture. The values represent the mean ± SD from triplicate cultures. (B) The effect of EPO or TPO on the erythroid or megakaryocytic differentiation of E-6 (a and c) and F-4 (b and d). After complete removal of GM-CSF from the conditioned media, EPO (10 U/mL; a and b) or TPO (100 ng/mL; c and d) was added to the liquid culture. One week later, the cells were obtained and prepared for analysis of cell-surface markers (GPA & GPIIb/IIIa) by immunofluorescence. Thin line, treatment with GM-CSF; thick line, treatment with EPO or TPO.
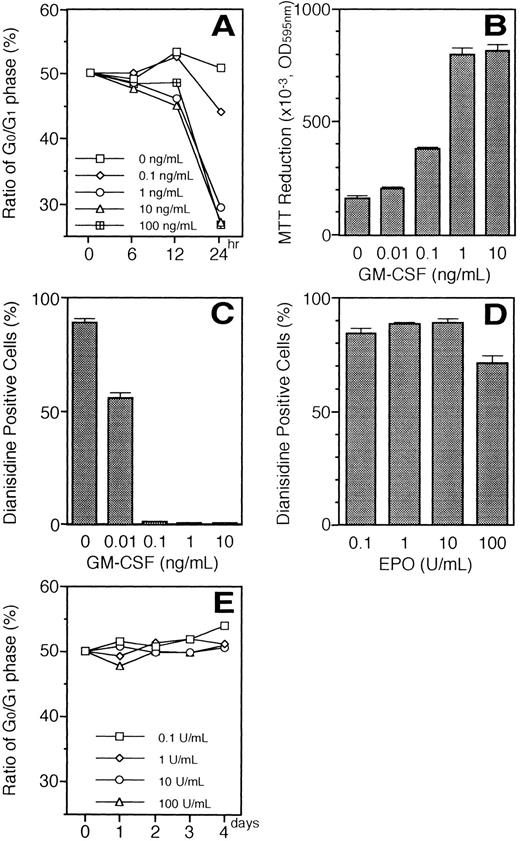
Relationship between EPO-induced erythroid differentiation and the cell cycle.We examined whether or not EPO induces G1 prolongation in UT-7/GM cells because G1 prolongation is thought to be a trigger of erythroid differentiation.21 22 Because the cell viability of UT-7/GM was rapidly decreased after 2 days of growth-factor deprivation, we decided to use the cells harvested after 24 hours of starvation for the cell-cycle analysis. The ratio of the cells in the G0/G1 phase was unchanged 24 hours after the addition of EPO (10 U/mL). In contrast, even in the presence of 10 U EPO/mL, GM-CSF reduced the ratio of the G0/G1 phase and subsequently promoted the cell proliferation of UT-7/GM cells in a dose-dependent manner (Fig 13A and B). The minimum level of ratio of the G0/G1 phase and the maximal cell growth were obtained in the presence of 1 ng/mL of GM-CSF, at which concentration none of the cells became dianisidine-positive (Fig 13C). These findings indicate that GM-CSF shortened the EPO-induced G1 prolongation of UT-7/GM cells, resulting in the inhibition of the EPO-induced erythroid differentiation. A high dose of EPO (100 U/mL) significantly reduced the percentage of the dianidisine-positive cells (Fig 13D). However, the ratio of the cells in the G0/G1 phase did not change even after 4 days of exposure to 100 U EPO/mL (Fig 13E). The effect of a low dose of EPO (0.01 U/mL) on hemoglobin synthesis could not be determined because the UT-7/GM cells could not be maintained in EPO sufficiently long enough to observe synthesis.
(A) Percentage of cells in the G0 and G1 phases after stimulation with the increasing concentrations of GM-CSF (0.1 to 100 ng/mL) in the presence of 10 U/mL of EPO. Growth factor-deprived UT-7/GM cells were cultured under various conditions and obtained for the analysis of the cell cycle. (B) Effect of the increasing concentration of GM-CSF on the proliferation of UT-7/GM cells in the presence of a constant concentration of EPO. Cell proliferation of UT-7/GM was analyzed by MTT assay (see Materials and Methods). Cells were plated at a density of 104/well in IMDM supplemented with 5% FCS and cultured with increasing concentrations of GM-CSF (0.01 to 10 ng/mL) in the presence of 10 U/mL of EPO. MTT reduction was measured after 3 days of culture. The values represent the mean ± SD from triplicate cultures. (C) Suppression by GM-CSF of EPO-induced erythroid differentiation in a dose-dependent manner. UT-7/GM cells were cultured with increasing concentrations of GM-CSF (0.01 to 10 ng/mL) in the presence of 10 U/mL of EPO. Two weeks later, the cells were obtained and stained with dianisidine as described in Materials and Methods. (D) Percentage of dianisidine-positive cells after stimulation with increasing concentrations of EPO. Cells were cultured with increasing concentrations of EPO (0.1 to 100 U/mL). Two weeks later, the cells were obtained and stained with dianidisine. (E) Percentage of cells in the G0 and G1 phases after stimulation with increasing concentrations of EPO. Growth-factor–deprived cells were cultured with increasing concentrations of EPO (0.1 to 100 U/mL) for the indicated periods and then harvested for the analysis of the cell cycle.
(A) Percentage of cells in the G0 and G1 phases after stimulation with the increasing concentrations of GM-CSF (0.1 to 100 ng/mL) in the presence of 10 U/mL of EPO. Growth factor-deprived UT-7/GM cells were cultured under various conditions and obtained for the analysis of the cell cycle. (B) Effect of the increasing concentration of GM-CSF on the proliferation of UT-7/GM cells in the presence of a constant concentration of EPO. Cell proliferation of UT-7/GM was analyzed by MTT assay (see Materials and Methods). Cells were plated at a density of 104/well in IMDM supplemented with 5% FCS and cultured with increasing concentrations of GM-CSF (0.01 to 10 ng/mL) in the presence of 10 U/mL of EPO. MTT reduction was measured after 3 days of culture. The values represent the mean ± SD from triplicate cultures. (C) Suppression by GM-CSF of EPO-induced erythroid differentiation in a dose-dependent manner. UT-7/GM cells were cultured with increasing concentrations of GM-CSF (0.01 to 10 ng/mL) in the presence of 10 U/mL of EPO. Two weeks later, the cells were obtained and stained with dianisidine as described in Materials and Methods. (D) Percentage of dianisidine-positive cells after stimulation with increasing concentrations of EPO. Cells were cultured with increasing concentrations of EPO (0.1 to 100 U/mL). Two weeks later, the cells were obtained and stained with dianidisine. (E) Percentage of cells in the G0 and G1 phases after stimulation with increasing concentrations of EPO. Growth-factor–deprived cells were cultured with increasing concentrations of EPO (0.1 to 100 U/mL) for the indicated periods and then harvested for the analysis of the cell cycle.
DISCUSSION
In this paper we report the establishment and characterization of a novel UT-7 subline, UT-7/GM. To our knowledge, UT-7/GM is the first cell line to have the capacity to differentiate into erythroid and megakaryocytic lineages by treatment with EPO and TPO, respectively. To date, several human megakaryo/erythroid leukemia cell lines have been established and characterized.6,23 Among them, K562 and HEL cells can differentiate into megakaryocytic cells by phorbol myristate acetate (PMA),24-26 and into erythroid cells by treatment with sodium butyrate or hemin.27 28 Based on these observations, these two cell lines have been used as representative models for the studies of megakaryocytic or erythroid differentiation. However, because PMA, sodium butyrate, and hemin are chemical agents and not physiological regulators, their actions on these cell lines may not always mimic normal erythropoiesis or megakaryopoiesis. Therefore, UT-7/GM could provide a more natural model for the study of differentiation and maturation of erythroid/megakaryocyte progenitor cells.
We established the UT-7 cell line and its derivatives, UT-7/EPO and UT-7/TPO.7,9 10 UT-7/EPO was derived directly from UT-7 and its growth is absolutely dependent on EPO but not on GM-CSF (Fig 1). In contrast, EPO-treated UT-7/GM has an acquired high sensitivity to EPO but can still be maintained by GM-CSF alone. Although UT-7/TPO was originally derived from UT-7/GM, the response profiles of UT-7/TPO to cytokines are different from those of TPO-treated UT-7/GM (Figs 1 and 10). Thus, EPO- and TPO-treated UT-7/GM cells have growth profiles different from those of UT-7/EPO and UT-7/TPO cells, respectively.
Because the proliferation and maturation of megakaryocyte and erythroid precursors are regulated by the structurally and ontogenically related cytokines TPO and EPO, respectively,1,2 it is not surprising that TPO slightly induced the increase in dianisidine-positive cells. Indeed, the administration of TPO to mice after chemotherapy and total body irradiation not only promoted recovery from chemotherapy-induced thrombocytopenia, but also relieved anemia.18 In addition, TPO had BPA in vitro.17 Very recently, it was reported that TPO directly acted on pure erythroid progenitor cells expressing CD41 and TPO receptor.29 Taken together, these results strongly indicate that TPO has a direct effect on erythroid differentiation, although the molecular mechanism by which the TPO signal for erythroid differentiation transduces to the nucleus remains to be determined. However, when both TPO and EPO were added to the culture, the EPO-induced erythroid differentiation of UT-7/GM cells was partially suppressed. This finding suggested that TPO antagonistically acts on EPO in the erythroid differentiation of UT-7/GM cells. One possibility is that TPO blocked the binding of EPO to EPOR. However, this is unlikely because the competition did not occur between the binding of EPO and TPO on the surface of Mo-7e and TF-1 cells30 Although speculative at present, it may occur downstream of the signal transduction or at the transcriptional level. The UT-7/GM would provide a useful model for investigating these unresolved problems.
In accordance with published results from other laboratories,31,32 we found that the EPO-induced erythroid differentiation was completely inhibited by the addition of GM-CSF, although the tyrosine phosphorylation of EPOR was induced by EPO itself even in the presence of GM-CSF, as shown in Fig 8. This observation indicates that GM-CSF blocks the EPO-induced erythroid differentiation signal at the postreceptor level. This hypothesis is consistent with the recent report that this dominant effect of GM-CSF over EPO is not a consequence of a downregulation of EPO receptors, but more likely occurs at the signal transduction or transcriptional level.33 Taken together, these findings lead us to argue that cytokines actively influence the programming of gene expression involved in the commitment or differentiation in UT-7/GM cells.
Because the sensitivity of UT-7/GM cells to EPO is much lower than that to GM-CSF, G1 prolongation or G1 arrest may have transiently occurred by the replacement of GM-CSF with EPO. This hypothesis is supported by the present finding that there was a definitive time lag in the cell proliferation in the presence of EPO, as shown in Fig 2. If so, this hypothesis provides an explanation for the observation that the UT-7/GM cells had differentiated into the cells with mature erythroid properties, because G1 prolongation or G1 arrest is thought to be a trigger of erythroid differentiation.21,22 To confirm this notion, we examined the effects of GM-CSF and EPO on the entry into the cell cycle of UT-7/GM cells. The addition of EPO to growth-factor–deprived UT-7/GM cells caused a prolongation of the G1 of the cell cycle during the observation periods. In contrast, GM-CSF inhibited the EPO-induced G1 prolongation in a dose-dependent manner. These kinetics were consistent with those of the suppression by GM-CSF of EPO-induced erythroid differentiation. In addition, EPO induced the increase in the ratio of dianidisine-positive cells in a dose-dependent manner up to 10 U/mL without decrease in the percentage of the cells in the G1 phase (Fig 13). Taken together, our data support the hypothesis proposed by Carroll et al21 that induction of erythroid differentiation by EPO requires a G1 prolongation of the cell cycle. In addition, GM-CSF shortened the G1 prolongation even in the presence of EPO, presumably mediated through the activation of genes leading to the entry into the cell cycle. As a result, GM-CSF would inhibit the EPO-induced erythroid differentiation and promote the cell proliferation.
It is interesting that 100 U/mL of EPO, 100 times the maximal concentration required for cell growth of UT-7/GM cells, slightly but significantly reduced the number of hemoglobin-positive cells. However, the shortening of G1 prolongation did not occur during the observation period, up to 4 days (data not shown). This is in contrast with the previous report that a high dose of EPO favored mitogenesis at the expense of erythroid differentiation.21 This discrepancy may be due to the different cell lines used for these experiments.
Individual cytokine receptors are linked to specific members of the JAK tyrosine kinase family.34 For example, GM-CSF, EPO, and TPO can commonly activate JAK2 tyrosine kinase.35 As expected, these cytokines induced tyrosine phosphorylation of JAK2 in UT-7/GM cells (Fig 9A and C). Moreover, additive effects on JAK2 activation were observed between GM-CSF and the other cytokines. Considering that GM-CSF completely inhibits the EPO or TPO signal for the differentiation of UT-7/GM cells into mature cells, it is unlikely that JAK2 activation is directly involved in EPO-induced erythroid and TPO-induced megakaryocytic differentiation. Rather, JAK2 activation may be closely associated with the cell growth, because the intensity of tyrosine phosphorylation of JAK2 generally correlated with the growth activity of the cytokines toward UT-7/GM cells, as shown in Fig 9D.
It is noteworthy that the effect of IL-3 differed from that of GM-CSF in the induction of erythroid differentiation of UT-7/GM cells, because the receptors for IL-3 and GM-CSF share a common β chain and have common pathways downstream of the cell-surface receptors.36 37 These results suggest that there are unidentified and distinct pathways in signal transduction systems between GM-CSF and IL-3.
We found that SCF also induced erythroid differentiation of the UT-7/GM cells. Recently, Wu et al38 reported that SCF may act on erythroid progenitor cells through the interaction of SCFR, encoded by c-kit, and EPOR.38 However, SCF did not induce the tyrosine phosphorylation of EPOR in UT-7/GM cells (data not shown), presumably because EPORs were present at low levels on these cells.10 It is also interesting that SCF partially but not completely inhibited the EPO-induced erythroid differentiation of UT-7/GM cells, although SCF itself had a positive effect on it. This finding is consistent with the previous report that SCF retarded the EPO-induced erythroid differentiation of normal progenitor cells.39 Thus, UT-7/GM cells may be a useful model for clarifying the molecular mechanisms of SCF action on erythropoiesis.
Because neither IL-3 nor TPO could induce tyrosine phosphorylation of EPOR in the UT-7/GM cells, it is possible that there is a distinct pathway independent of the activation of EPOR in the IL-3 and TPO signal transduction systems for erythroid differentiation. However, we cannot completely exclude the possibility that the signals of IL-3 and TPO for erythroid differentiation also transduce to the nucleus through the interaction of EPOR and the receptors for IL-3 and TPO, because the tyrosine phosphorylation of EPOR is not always required for EPO-induced erythroid differentiation in a murine cell line.40 In addition, because of the low levels of EPORs on UT-7/GM cells,10 it may be difficult to detect the tyrosine-phosphorylated EPOR induced by IL-3 or TPO, as it is for the SCF signalling pathway.
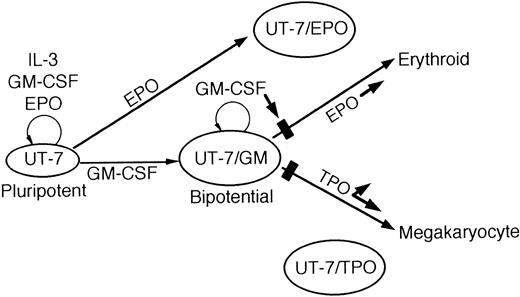
In summary, we report here the establishment and characterization of UT-7/GM, a novel subline of UT-7. Unlike other human leukemia cell lines, UT-7/GM has the capacity to differentiate into erythroid and megakaryocytic lineages by treatment with EPO and TPO, respectively. Because the megakaryocyte and erythroid lineages appear to be closely related in ontogeny, this unique cell line may serve as a useful model for elucidating the mechanism of the commitment of the common progenitor cells to erythroid versus megakaryocytic lineage, in combination with other sublines,7,9 10 as illustrated in Fig 14.
A schematic illustration of the growth and differentiation of UT-7 and its sublines.
A schematic illustration of the growth and differentiation of UT-7 and its sublines.
ACKNOWLEDGMENT
We thank Tomoko Ando for technical assistance and Motoko Yoshida for the manuscript preparation.
Supported in part by Grants-in-Aid for Cancer Research and Scientific Research from the Ministry of Education, Science and Culture of Japan, and by a grant from the Yamanouchi Foundation for Research on Metabolic Disorders.
Address reprint requests to Norio Komatsu, MD, PhD, Division of Hematology, Department of Medicine, Jichi Medical School, Minamikawachi-machi, Tochigi-ken 329-04, Japan.




This feature is available to Subscribers Only
Sign In or Create an Account Close Modal