Abstract
Chronic myelomonocytic leukemia (CMML) is a rare hematopoietic malignancy of childhood. To define the clinical and hematologic characteristics of the disease, we performed a retrospective analysis of 110 children given the diagnosis CMML irrespective of karyotype. Median age at diagnosis was 1.8 years. Neurofibromatosis type 1 was known in 14% and other clinical abnormalities in 7% of the children. At presentation, the medium white blood count was 35 × 109/L, with a median monocyte count of 7 × 10⁹/L. Karyotypic abnormalities in bone marrow cells were noted in 36% of the patients, whereas 26% of the children had monosomy 7. Children with monosomy 7 did not differ from those with normal karyotype with respect to their clinical presentation. However, they did display some characteristic hematologic features. Of 110 children, 38 received an allogeneic bone marrow transplant (BMT). The probability of survival at 10 years was 0.39 (standard error [SE] = 0.10) for the BMT group and 0.06 (SE = 0.4) for the 72 patients of the non-BMT group. Platelet count, age, and hemoglobin F at diagnosis were the main predicting factors for the length of survival in the non-BMT group. There is a strong need for a broad agreement on nomenclature in children with myelodysplastic syndromes (MDS). We propose here to use the French-American-British classification for MDS in childhood.
MYELODYSPLASTIC syndromes (MDS) in childhood are rare and account for less than 10% of all hematologic malignancies.1 The classification of MDS in childhood has been the subject of some controversy. Although some investigators have argued that childhood MDS can be classified in the same subgroups of the French-American-British (FAB) nomenclature as adult cases,1-3 others pointed out that this system is rarely used in practice.4 Instead, children with MDS are subdivided as having more adult-type MDS or as suffering from a disorder with myeloproliferative features primarily observed in infancy and early childhood. The latter is characterized by prominent hepatosplenomegaly, frequent skin involvement, leukocytosis, monocytosis, and presence of immature precursors in peripheral blood (PB). This disorder has been referred to as chronic myelomonocytic leukemia (CMML)2,3,5,6 or juvenile chronic myelogenous leukemia (JCML).7-10
Since the first reports of a missing C chromosome in children with myeloproliferative disorders,11,12 childhood monosomy 7 has been defined as a separate entity.13,14 Monosomy 7 is the most common cytogenetic abnormality in childhood myeloid disorder and can be encountered in virtually all subtypes of MDS and acute myelogenous leukemia (AML).4,15 Although monosomy 7 is not associated with characteristic hematologic or clinical features, young children with monosomy 7 have a disease resembling CMML. This disorder has been referred to as infantile monosomy 7 syndrome.16 Although children with CMML often display strikingly elevated hemoglobin F (Hb F ) levels, this is not commonly seen in patients with monosomy 7.2
It has been recognized that there is a broad overlap in the clinical presentation of children with CMML and monosomy 7 syndrome of infancy. Both disorders show a male predominance and an association with neurofibromatosis type 1 (NF1).16-20 Mutations for the Nras and Kras genes have been described in CMML and monosomy 7 syndrome with similar frequency.21-24 In vitro, both disorders display an excessive proliferation of myeloid progenitor cells.25-28 The clinical and biologic similarities suggest that CMML and monosomy 7 syndrome are spectrums of the same disease. To better describe this entity, we analyzed the clinical and hematologic findings of 110 children given the diagnosis CMML irrespective of karyotype.
MATERIALS AND METHODS
The data of 110 children diagnosed with CMML under the age of 16 years in Austria (n = 7), Denmark (n = 14), Germany (n = 57), Italy (n = 23), and The Netherlands (n = 9) were analyzed. Diagnoses and clinical and hematologic data of all patients entered had been reviewed nationally by the leukemia study groups. All patients were classified as suffering from CMML according to the FAB criteria29 modified to accept 5% or more blasts on PB differential count.30 In addition, all children displayed at least two of the following criteria: Hb F elevated for age, the presence of immature granulocytic precursors in PB, white blood cell count (WBC) greater than 10 × 109/L, and chromosomal abnormality. Because of different national review structures, accrual times varied between nations. The overall accrual time was September 1, 1975, to December 31, 1994. The date of analysis was August 1, 1996. Data on 27 patients included in this series have been previously reported.1 30-40
Because of the retrospective nature of the study, several patients had missing data for some of the parameters studied (Table 1). The WBC had been corrected for the presence of nucleated red blood cells. PB and bone marrow (BM) differential counts reported with the inclusion of unclassifiable cells had to be excluded from the analysis. Therefore, the differential count of PB and BM was evaluable for 100 and 92 of the 110 children, respectively (Table 1). All patients without evaluable differential counts had biopsies of BM or lymph nodes or autopsy reports indicative of the diagnosis CMML. Myelopoiesis (MP) in the BM was defined as the percentage of granulocytes plus monocytes plus blasts. Granulopoiesis (GP) was defined as the percentage of granulocytes. Normal ranges for the mean corpuscular volume (MCV) of red blood cells according to age were modified from Dallman and Siimes.41 Values for the serum concentrations of lactate dehydrogenase (LDH) and Igs were analyzed according to the age-adjusted normal ranges.42
Number of Patients With Evaluable Data
| Parameter . | No. of . | Parameter . | No. of . |
|---|---|---|---|
| . | Patients . | . | Patients . |
| PB | |||
| WBC | 110 | Spleen size in cm | 106 |
| Differential count | 100 | Liver size in cm | 105 |
| Platelets* | 106 | Karyotype | 98 |
| Hb* | 107 | LDH† | 82 |
| MCV | 79 | Ig G† | 81 |
| Reticulocytes | 60 | IgM† | 79 |
| Hb F | 91 | IgA† | 79 |
| BM | |||
| Cell content | 100 | Antinuclear antibodies† | 29 |
| Megakaryocytes | 89 | Direct Coombs test | 22 |
| Differential count | 92 | Lysozyme† | 29 |
Untransfused.
Serum concentration.
Chromosomal analyses of BM cells were performed by standard techniques by the national reference laboratories or by the local treatment center. Patients were entered irrespective of the chromosomal aberration of the malignant clone, thus including patients with monosomy 7. A patient with Klinefelter syndrome without additional chromosomal abnormalities in BM cells was evaluated within the group of children with normal BM karyotype.
Two patients were lost to follow-up at 9.6 and 2.5 years. They were censored at the time of their withdrawal. Survival was calculated from the date of diagnosis to the date of death or last follow-up. The significance of observed differences in proportions was tested using the χ2 statistic and, when appropriate for small sample size, Fisher’s exact test. The Kaplan-Meier method was used to estimate survival rates with comparisons based on the two-sided log-rank test.43 Standard errors were calculated using Greenwoods formula. Prognostic factors for the length of survival were analyzed for patients without BM transplantation (BMT) using Cox regression and the method of recursive partition.44,45 The choice of variables tested was based on our own results and other investigations.6,16 The recursive partition was performed according to the method used by Trueworthy et al.46 Quantitative variables were categorized using the cutpoint with results in the highest risk ratio in univariate Cox regression. This classification was repeated for each subgroup. The variable chosen for partition was the one with the largest risk ratio meeting the criteria of a P value less than 1% or 5% for initially categorial variables. Partitioning was restricted to splits that resulted in subgroups with a minimum of 10 patients. Loglinear model and Spearman's rank correlation were used to analyze correlations between prognostic factors.
RESULTS
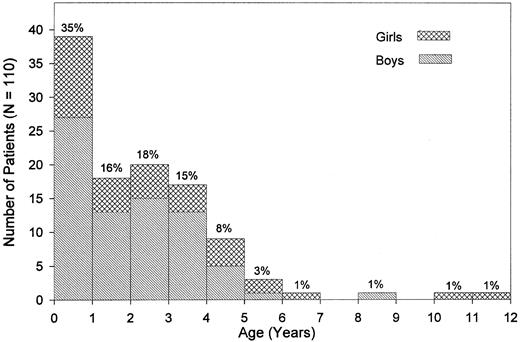
Clinical presentation.The median age at diagnosis was 1.8 years (range, 0.1 to 11.4 years; Fig 1). Nine percent of the patients had been diagnosed by the age of 4 months, whereas 4.5% were 5 years old or older. There was a male predominance with a male:female ratio of 2.1:1 and a similar age distribution for both sexes. Pallor, fever, infection, skin bleeding, and cough were the most commonly presented symptoms (Table 2), whereas abdominal pain was seen in 7%, bone pain and diarrhea in less than 4% of patients. Splenomegaly at the time of diagnosis was noted in all but 2 children. Median sizes for spleen and liver were 6 cm and 4 cm below the costal margin, respectively. Lymphadenopathy was noted in 76% of the children, and a macular-papular skin rash in 36% of the patients (Table 2). Of other presenting features, chloroma was noted in 2 children; diabetes insipidus and facial palsy due to local leukemic infiltration in one child each. The median interval between the onset of symptoms and the time of diagnosis was 1.9 months (range, 0 to 23.0 months). Eight of the 110 children (7.3%) had clinical abnormalities such as hypertelorism, hydrocephalus, cyanotic heart disease, pedal polidactyly (2 children), mental retardation, Klinefelter syndrome, and pyloric stenosis.
Age at diagnosis and sex. Percentages given are based on the study population of 110 patients.
Age at diagnosis and sex. Percentages given are based on the study population of 110 patients.
Symptoms and Signs at Diagnosis
| . | % of . | . | % of . |
|---|---|---|---|
| . | Patients . | . | Patients . |
| Pallor | 64 | Splenomegaly | 97 |
| Fever | 54 | Hepatomegaly | 97 |
| Infection | 45 | Lymphadenopathy | 76 |
| Bleeding | 46 | Skin rash | 36 |
| Cough | 40 | Café au lait spots | 14 |
| Malaise | 35 | Xanthoma | 6 |
Hematologic data.At diagnosis, the median WBC was 35 × 109/L (Table 3). Whereas 7% of the children had a leukocytosis of more than 100 × 109/L, 67% had an initial WBC less than 50 × 109/L (Table 4). In 15% of the patients, the WBC was less than 15 × 109/L at diagnosis and in 4.5% less than 10 × 109/L. The latter 5 children presented with 15% to 69% monocytes on differential blood count, an absolute monocyte count of 1.1 to 3.6 × 10⁹/L, and monosomy 7. The comparison of clinical and hematologic data of patients with a WBC less than 15 × 109/L to all others, or only to those with a WBC more than 50 × 109/L, showed no significant differences except for a higher percentage of mature neutrophils in PB and a more pronounced BM myeloid hyperplasia in patients with a higher WBC.
Hematologic Data at Diagnosis
| Parameter . | Median . | Range . |
|---|---|---|
| PB | ||
| WBC (109/L) | 35.0 | 5.1-259.4 |
| Blasts (%) | 1.3 | 0.0-24.0 |
| Immature granulocytes (%) | 6.0 | 0.0-51.5 |
| Eosinophils (%) | 1.0 | 0.0-24.0 |
| Basophils (%) | 1.0 | 0.0-15.0 |
| Monocytes (%) | 16.0 | 3.2-69.4 |
| Monocytes (109/L) | 7.0 | 1.1-60.8 |
| Platelets (109/L) | 45 | 3-496 |
| Hemoglobin (g/100 mL) | 9.2 | 3.5-12.7 |
| MCV (fL) | 83.0 | 65-118 |
| Reticulocytes (%) | 2.2 | 0.0-12.4 |
| Erythroblasts (/100 WBC) | 1.0 | 0.0-64.0 |
| BM | ||
| MP:EP | 3.6 | 0.1-94.0 |
| GP:EP | 3.1 | 0.1-83.0 |
| Blasts (%) | 4.0 | 0.0-20.0 |
| Immature granulocytes (%) | 21.8 | 1.0-54.0 |
| Eosinophils (%) | 3.0 | 0.0-33.0 |
| Basophils (%) | 0.0 | 0.0-9.0 |
| Monocytes (%) | 5.6 | 0.0-30.0 |
Immature granulocytes are promyelocytes, myelocytes, and metamyelocytes.
WBC, Platelets, and Hb at Diagnosis
| . | Range . | % of Patients . |
|---|---|---|
| WBC (×109/L) | 3.5-25 | 29 |
| 25-50 | 38 | |
| 50-75 | 17 | |
| 75-100 | 8 | |
| 100-150 | 5 | |
| ≥150 | 2 | |
| Platelets (×109/L) | 3-20 | 17 |
| 20-50 | 40 | |
| 50-100 | 21 | |
| 100-150 | 7 | |
| ≥150 | 16 | |
| Hb (g/100 mL) | 3.5-7 | 16 |
| 7-9 | 33 | |
| 9-11 | 34 | |
| ≥11 | 18 |
The percentage of blasts in PB ranged from 0% in 36% of the patients to 5% or more in 25% of the children. The latter group displayed a significantly higher median blast count in the BM and a higher percentage of immature granulocytes in the PB, but did not differ in any other clinical or hematologic features when compared with children without blasts in the PB. Fourteen percent of the patients lacked circulating promyelocytes, myelocytes, and metamyelocytes. Patients with more than 10% of these immature granulocytic precursors (n = 29) had a significantly higher WBC, with a higher percentage of blasts and nucleated red blood cells when compared with those with less circulating immature granulocytic precursors (n = 71).
Monocytosis at diagnosis was evident in all cases (Table 2); only 14% of the patients had less than 10% monocytes on differential blood count. Patients with an absolute monocyte count of 3 × 10⁹/L or more (n = 76) displayed a higher WBC and a higher percentage of monocytes in the BM, but shared all other clinical and hematologic parameters with the group of patients with a lower absolute monocyte count.
Eosinophilia in PB with more than 5% eosinophils was noted in 8% of the patients. Two children had more than 10% eosinophils; 1 with monosomy 7 (16% eosinophils) and the other with a marker chromosome (25% eosinophils). Basophilia in PB with more than 2% or 5% basophils was seen in 21% and 6% of the patients, respectively. Of the 6 patients with more than 5% basophils, 3 had a normal karyotype, 2 had monosomy 7, and 1 child had a complex cytogenetic abnormality.
Severe thrombocytopenia at diagnosis was observed in 17% of the children (Table 4). The hemoglobin concentration, reticulocyte counts, and the number of nucleated red blood cells per 100 WBC varied over a wide range. Macrocytosis of red blood cells was seen in 19 of 79 children with data (24%). A karyotype was available in 16 of the 19 children, monosomy 7 was seen in 10 patients, trisomy 8 in 1 child, and a normal karoytype in 5 children. Although none of the patients with monosomy 7 had microcytic red blood cells, microcytosis was noted in 13 of the remaining 60 patients (22%).
BM cell content was estimated on aspirates. It was judged increased or normal for age in all specimens. The number of megakaryocytes was reduced in 76% of the patients. Although most patients showed granulocytic hyperplasia, 10 children (11%) displayed a ratio of granulopoiesis to erythropoiesis of less than 1. In 7 children, erythroid precursors accounted for more than half of all BM cells; all 7 children had monosomy 7. Monocytosis in the BM was generally less impressive than in the PB. A BM blast count of more than 10% was noted in 10% of the patients. These children had higher blast counts in the PB and were more likely to have NF1 or monosomy 7 than children with lower blast counts.
NF1.NF1 was known in 15 children (14%). In 3 children, xanthomas were observed without the diagnosis of NF1 having been made. A positive family history for NF1 was known for 7 of the 15 NF1 patients; in each case, the mother was the carrier. Clinical parameters such as median age at diagnosis, liver and spleen size, lymphadenopathy, skin infiltrates, and karyotype did not differ between patients with or without NF1. However, NF1 was more common among children who had been diagnosed after the age of 5 years. Four of these 7 children were known to have NF1, whereas only 11 of the 103 patients diagnosed less than 5 years of age were known to be affected by NF1 (P = .006). Children with NF1 had a higher platelet count (median, 160 × 109/L v 43 × 109/L; P = .016) and a higher percentage of blasts in the BM (median, 8% v 4%; P = .040) than patients without NF1. Of the 12 patients with NF1 and evaluable chromosomal studies, 9 children had a normal karyotype and 3 had monosomy 7.
Chromosomal aberration.Data on the karyotype of BM cells at the time of diagnosis were available in 98 patients. A normal karyotype was reported in 63 children (64.3%), whereas 25 (25.5%) had monosomy 7 and 10 (10.2%) had an aberration other than monosomy 7. Five of the 25 patients with monosomy 7 displayed additional abnormalities. Of the 10 children with a chromosomal abnormality other than monosomy 7, 4 had a 7q− abnormality (Table 5).
List of Patients With Chromosomal Abnormalities Other Than Monosomy 7
| Age . | Karyotype . | Hb F . |
|---|---|---|
| (yr) . | . | (%) . |
| 0.3 | 47,XX,+mar | 11 |
| 0.4 | 46,XY,t(1; 3)(p13; p21),der(7)t(7; 12)(q21; q13)/46,XY | 11 |
| 0.7 | 46,XX,add(7)(q36) | ND |
| 1.0 | 46,XY,t(7; 20)(7pter → 7q11::20q11 → 20qter; 20pter → 20q11:) | 28 |
| 1.0 | 48,XY,+13,+21 | ND |
| 2.2 | 46,XX,add(12)(p13) | 40 |
| 2.6 | 48,XY,+8,+21 | 13 |
| 3.2 | 46,XX,add(7)(q22)[15]/46,XX,[21] | 6 |
| 3.2 | 47,XY,+mar | 3 |
| 3.5 | 47,XY,+8 | 12 |
Abbreviation: ND, not done.
Children with monosomy 7 did not differ from those with normal karyotype with respect to age at diagnosis, sex, liver or spleen size, lymphadenopathy, skin infiltrates, or presence of NF1. However, they did display some characteristic hematologic features (Table 6). Patients with monosomy 7 presented with a lower WBC but a similar absolute monocyte count, as they had a higher percentage of monocytes on differential count. Red blood cells in monosomy 7 patients were more often macrocytic, whereas Hb concentration, reticulocyte count, and nucleated red blood cells per 100 WBC did not differ significantly. Erythropoiesis in the BM was often more pronounced in monosomy 7 patients and the percentage of eosinophils within the BM differential count was increased (Table 6).
Hematologic Data for Patients With Normal Karyotype and Monosomy 7
| . | Normal . | Monosomy 7 . | P Value . |
|---|---|---|---|
| . | Karyotype . | (n = 25) . | . |
| . | (n = 63) . | . | . |
| PB | |||
| WBC (×109/L) | 38.5 | 20.5 | .0116-150 |
| Blasts (%) | 1.1 | 2.1 | .297 |
| Left shift (%) | 6.0 | 6.8 | .771 |
| Mature neutrophils (%) | 36.0 | 18.0 | <.0016-150 |
| Monocytes (%) | 15.2 | 29.8 | .0016-150 |
| Monocytes (×109/L) | 7.0 | 7.3 | .482 |
| Eosinophils (%) | 1.0 | 2.1 | .107 |
| Hemoglobin (g/100 mL) | 8.7 | 9.2 | .839 |
| Reticulocytes (%) | 2.1 | 1.8 | .782 |
| Erythroblasts (/100 WBC) | 0.5 | 1.5 | .094 |
| Macrocytosis (% of patients) | 17.4 | 47.6 | .0166-150 |
| Hb F (%) | 25.3 | 1.0 | <.0016-150 |
| Platelets (×109/L) | 44.0 | 55.5 | .246 |
| BM | |||
| GP:EP | 3.1:1 | 1.7:1 | .0196-150 |
| MP:EP | 3.7:1 | 2.5:1 | .064 |
| Blasts (%) | 4.6 | 5.0 | .304 |
| Monocytes (%) | 4.9 | 8.5 | .0076-150 |
| Eosinophils (%) | 2.0 | 4.0 | .0256-150 |
| Blasts6-151 (%) | 7.0 | 11.8 | .0326-150 |
| Monocytes6-151 (%) | 7.6 | 17.8 | <.0016-150 |
| Eosinophils6-151 (%) | 4.0 | 9.8 | .0076-150 |
Median values are given.
Abbreviations: left shift, promyelocytes and myelocytes and metamyelocytes; mature neutrophils, bands and segmented neutrophils.
Significant.
With regard to myelopoiesis only.
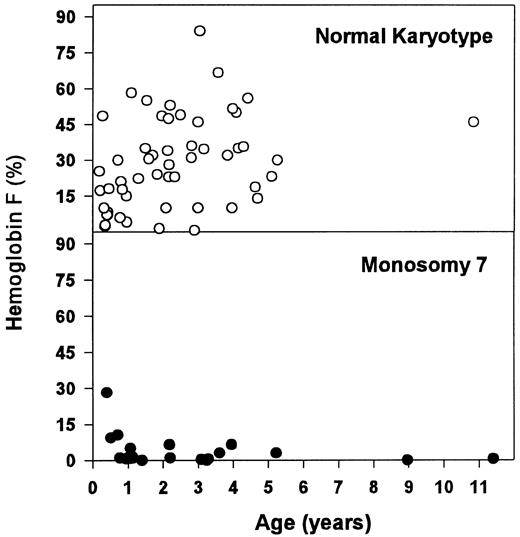
These hematologic differences were most pronounced when looking at the concentration of Hb F (Table 6 and Fig 2). Patients with monosomy 7 had normal or moderately elevated Hb F concentrations. In contrast, there was a wide range for Hb F levels in children with normal karyotype. Within the latter group, patients with an Hb F of more than 15% (n = 39) were older (median, 2.2 v 0.9 years; P = .028) and displayed a higher blast count in the PB (median, 3.0% v 0.0%; P = .021) and in the BM (median, 5.0% v 2.0%; P = .001) when compared with those with a lower Hb F (n = 16).
Concentration of Hb F for patients with normal karyotype and monosomy 7.
Laboratory data.An increase in the serum concentrations of IgG, IgM, or IgA was observed in 53 of 81 patients (65%) with evaluable data. There were no significant correlations of hypergammaglobulinemia with any of the clinical or hematologic features analyzed. Autoantibodies such as antinuclear antibodies or a positive direct Coombs test were noted in 7 of 29 (24%) and 3 of 22 (14%) evaluable patients, respectively. Elevated serum levels of LDH in 56 of 82 patients (68%) correlated with a more pronounced left shift of granulocytes in the PB and signs of ineffective erythropoiesis in the BM. The 21 of 29 patients (72%) with increased serum concentrations of lysozyme did not differ from those with normal serum concentrations with respect to clinical or hematologic characteristics.
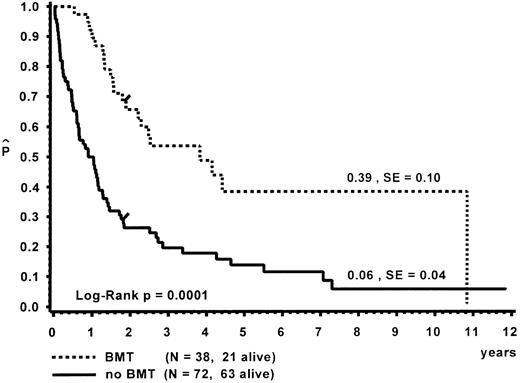
Survival.Of the 110 patients, 38 received an allogeneic BMT, with a median time of 8.5 months (range, 0.3 to 112.7 months) from diagnosis to BMT. The probability of 10-year survival for the BMT group was 0.39 (standard error [SE] = 0.10; Fig 3). A detailed analysis of the outcome after BMT is given separately.47 Seventy-two children did not receive a BMT. At 10 years, the probability of survival for the untransplanted group was 0.06 (SE = 0.04). Distribution of prognostic factors for length of survival was similar in the BMT and non-BMT group. Seven patients survived more than 5 years without BMT (Table 7). One child is alive 11.9 years after diagnosis without evidence of disease. This child had been diagnosed at the age of 5 months with hepatosplenomegaly, a WBC of 57 × 109/L, immature granulocytic and erythroid precursors and 2% blasts on blood differential count, an Hb F of 8%, and a normal karyotype. In vitro culture studies had not been performed. In another patient, monosomy 7 of BM cells had been documented twice within 6 months after diagnosis; a normal karyotype was found 4 and 9 years later.31 This patient had only received a splenectomy and was without evidence of disease at time of the last follow-up at 9.6 years.
Survival of patients with and without BMT. Data are given from the time of diagnosis. The last event in the BMT group is in a child transplanted 9.4 years after diagnosis.
Survival of patients with and without BMT. Data are given from the time of diagnosis. The last event in the BMT group is in a child transplanted 9.4 years after diagnosis.
Characteristics of Patients With a Survival of More Than 5 Years Without BMT
| Age . | Spleen7-150 . | PB . | Blast . | Mono . | Hb F . | BM . | Karyotype . | Length of . | Status . |
|---|---|---|---|---|---|---|---|---|---|
| (yr) . | . | WBC . | (%) . | (×109/L) . | (%) . | Blasts . | . | Survival . | . |
| . | . | (×109/L) . | . | . | . | (%) . | . | (yr) . | . |
| 1.8 | 2 | 22.2 | 0.0 | 2.4 | 11 | 5 | Normal | 5.4 | Alive |
| 1.1 | 0 | 30.0 | 0.0 | 6.0 | 2 | ND | −7 | 5.5 | Dead |
| 0.4 | 3 | 34.8 | 0.0 | 7.0 | 2 | 9 | Normal | 7.1 | Dead |
| 1.4 | 13 | 12.0 | 1.2 | 1.4 | 0 | ND | −7 | 7.3 | Dead |
| 2.2 | 4 | 29.4 | 24.0 | 1.4 | 23 | 5 | Normal | 9.4 | BMT/dead7-151 |
| 3.1 | 8 | 5.1 | 0.0 | 3.5 | 0 | 2 | −7 | 9.6 | LFU7-152 |
| 0.4 | 5 | 56.8 | 2.0 | 8.0 | 8 | 1 | Normal | 11.9 | Alive7-152 |
Abbreviations: Mono, monocytes; ND, no data; −7, monosomy 7; LFU, lost to follow-up.
Spleen size in centimeters below the costal margin.
Transplanted 9.4 years after diagnosis.
Without evidence of disease.
During the course of their disease, most patients received a number of different treatment trials. Intensive chemotherapy according to treatment protocols for AML or acute lymphoblastic leukemia was administered to 31% of the patients who did not proceed to BMT. Survival of the intensively treated group was similar to that of children receiving less intensive treatment (P = .14). The 2 long-term survivors (Table 7) had not received any chemotherapy.
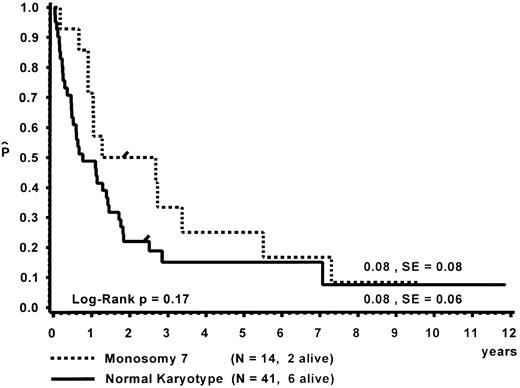
Prognostic factors for length of survival.For the 72 patients without BMT, the prognostic significance of initial clinical and hematologic parameters was studied. In the first step of a classification and regression tree (CART) analysis,46 all quantitative variables that were suspected to have an influence on survival were scanned for a cutpoint, which divided the 72 patients into two subgroups (with a minimum size of 10 patients) with the highest possible risk ratio. The following variables resulted in a significant Cox regression coefficient: platelets (split 33 × 109/L), age (split 4 years), Hb F (split 15%), reticulocytes (split 1.1%), the percentage of blasts in PB (split 4%), and the percentage of blasts in the myeloid BM compartment (split 5%). Qualitative variables with significant P values were clinical abnormalities (excluding NF1) and bleeding. Karyotype (Fig 4) and NF1 did not influence survival significantly. The second and last step of the CART analysis was a classification into the following groups: platelets less than 33 × 109/L, platelets ≥33 × 109/L and Hb F ≥15%, or platelets ≥33 × 109/L and Hb F less than 15%.
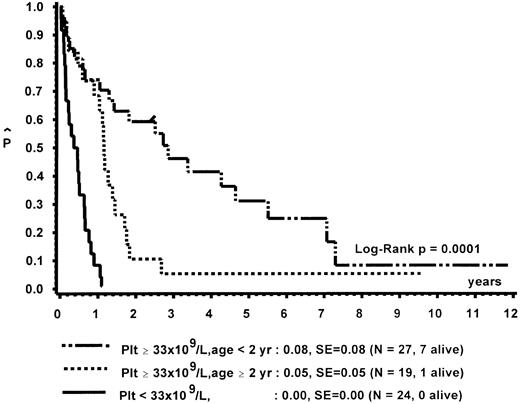
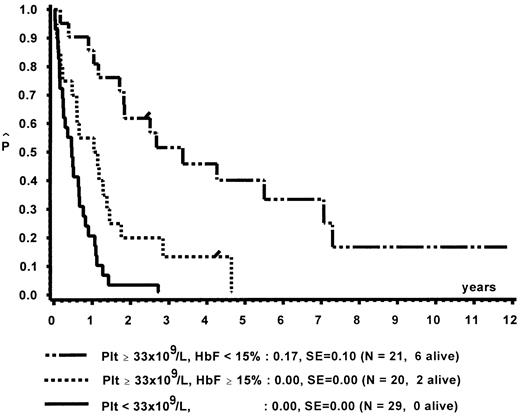
In a forward and stepwise Cox regression analysis, platelets, age, and Hb F (classified according to the splits found in CART analysis) were predictive for survival (Figs 5 and 6). In a loglinear model, there was a correlation of Hb F with age but not with platelet count. These correlations were observed for all patients irrespective of karyotype, as well as for patients with normal karyotype only. Spearman partial-rank correlation yielded similar results.
Survival of patients without BMT according to platelet count and age at diagnosis.
Survival of patients without BMT according to platelet count and age at diagnosis.
Survival of patients without BMT according to platelet count and Hb F at diagnosis.
Survival of patients without BMT according to platelet count and Hb F at diagnosis.
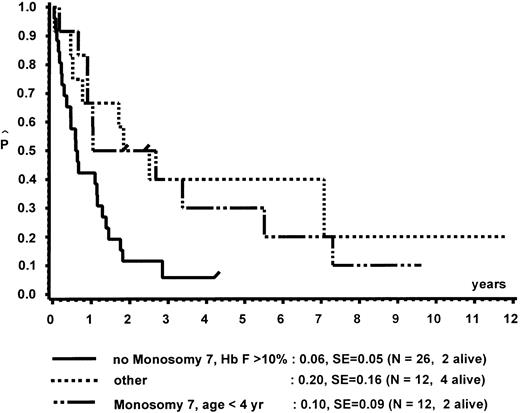
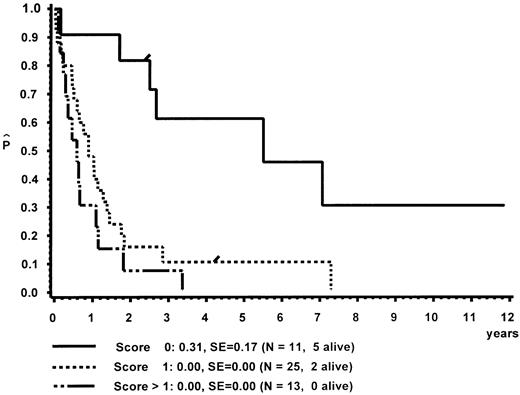
In a different nomenclature of childhood MDS, British investigators have classed children with CMML morphology as JCML, monosomy 7 syndrome of infancy, or CMML.16 JCML was defined by an Hb F of more than 10%, monosomy 7 syndrome of infancy by monosomy 7, and less than 4 years of age. All other patients were classed as CMML. Applying these definitions to our patient population, children with JCML had a significantly shorter survival than children with the monosomy 7 syndrome of infancy or CMML (Fig 7). This difference in survival was explained by the presence of worse prognostic features such as low platelet count and high Hb F levels in patients classed as JCML (data not shown). The same investigators have proposed a new scoring system for pediatric MDS.16 Each of the following factors scored 1 point if present at diagnosis: platelets ≤40 × 109/L, Hb F of more than 10%, and a complex cytogenetic abnormality with two or more structural or numerical events. The survival of the 54 children of our patient population in which the score could be evaluated is depicted in Fig 8. In this cohort, the three groups were primarily defined by platelet count and Hb F and not by the cytogenetic abnormality (data not shown).
Survival of patients without BMT according to the British definition of JCML, monosomy 7 syndrome of infancy, and CMML.
Survival of patients without BMT according to the British definition of JCML, monosomy 7 syndrome of infancy, and CMML.
Survival of patients with CMML without BMT according to a British scoring system for pediatric MDS based on platelet count, Hb F, and cytogenetic aberration.
Survival of patients with CMML without BMT according to a British scoring system for pediatric MDS based on platelet count, Hb F, and cytogenetic aberration.
DISCUSSION
The clinical features of the 110 children with CMML presented here are strikingly similar to those of 38 children published in 1984 by Castro-Malaspina et al6 from the Hôpital St Louis (Paris, France). Hepatosplenomegaly, lymphadenopathy, recurrent infections, and bleeding are the hallmarks of the disease. There was a strong predominance of male sex with a female to male ratio of 1:2.1 in our series compared with 1:1.7 in the French cohort6 and 1:4.8 in a British study of 35 children with CMML morphology.16 The median age at diagnosis was 1.8 years in our patient population and 1.1 years in the British series.16 Although CMML is a disease of very young children, some patients present at an older age. In our population, 7 of the 110 children had been diagnosed after the age of 5 years, which compares to 1 of 38 and 2 of 35 children in the French and British series, respectively.6 16
The association between NF1 and CMML has well been established.17,18 The frequency of NF1 in our cohort was 14%, compared with 8% in the French series,6 and 9% in a British population-based survey of 58 children with CMML.48 Based on our data, the risk for CMML in patients with NF1 is about 350-fold increased compared with patients without NF1.49 The higher frequency of NF1 among older children with CMML (4 of 7 of those diagnosed after 5 years of age) may suggest that NF1 is underdiagnosed in infants due to the paucity of signs and symptoms in very young children. The frequency of NF1 in CMML may be considerably higher than 14%. Xanthomas in children with CMML have been described in the absence of recognized NF1.6,18,50,51 They were noted in 3 patients presented here. The increased risk for leukemia with NF1 is restricted to childhood, because there is no evidence that adults with NF1 are predisposed to hematopoietic malignancy.4 In 7 of the 15 children, an affected parent was known, with the mother being the carrier in every case. An unbalanced gender distribution of affected parents with a maternal transmission in more than 75% of all children with familial NF1 has been reported.20 In children with NF1, loss of the normal NF1 allele from BM results in activation of the ras signaling pathway with aberrant growth of hematopoietic cells.52-54 The association of NF1 with CMML with normal karyotype and monosomy 7 supports the concept of a multistep model of leukemogenesis. The role of monosomy 7 in the pathogenesis of the disease remains to be determined.
Various clinical abnormalities other than NF1 have been observed among patients with CMML.6,16 Similar to what has been described in the French series,6 the frequency among our patient population was 7%. One of our patients was known to have Klinefelter syndrome. Unlike the results for NF1, a recent epidemiologic study did not find an increased incidence of leukemia in men with Klinefelter syndrome.55 The children with clinical abnormalities other than NF1 displayed poor prognostic features and had particularly short survival times (data not shown).
The hematologic picture observed in children with CMML comprises an impressively wide range. With a median WBC of 35 × 109/L, 7% of the children had a WBC greater than 100 × 109/L, with the highest count being 259 × 109/L. In the French study, 16% of the patients presented with a WBC greater than 100 × 109/L and no case exceeded 200 × 109/L.6 On the other hand, 5 of the 110 children analyzed here had a WBC less than 10 × 109/L. Children with the diagnosis CMML/JCML and a presenting WBC less than 10 × 109/L have also been reported by other investigators.16 56 The 5 children with a low WBC presented here were known to have monosomy 7. This finding is consistent with the fact that children with monosomy 7 had a significantly lower median WBC than children with normal karyotype.
According to the FAB criteria, the defining feature of CMML is the presence of monocytosis greater than 1 × 10⁹/L.29 A striking monocytosis with dysplastic cell forms was evident in most patients. In contrast to Philadelphia-positive (Ph+) chronic granulocytic leukemia (CGL), basophilia has not been a feature of adulthood CMML or the more recently defined atypical chronic myeloid leukemia.57 In our series of CMML in childhood, 16% of the children had more than 2% basophils in PB. Despite the fact that 10 of those exhibited more than 5% circulating basophils, karyotype data render it unlikely that a diagnosis of (Ph+) CGL was missed in these patients.
The analysis of children with CMML irrespective of karyotype allowed us to compare clinical and hematologic features of children with monosomy 7, normal karyotype, and other cytogenetic abnormalities. The three groups did not differ with respect to sex distribution, age at diagnosis, presence of NF1, degree of hepatosplenomegaly, skin involvement, or any other presenting sign or symptom studied. However, patients with monosomy 7 did display some characteristic hematologic features. Compared with children with a normal karyotype, they had a lower median WBC with a higher percentage of monocytes, thus displaying a similar absolute monocyte count. Eosinophilia in PB and BM was often present and prominent. BM erythroid hyperplasia was conspicuous. In a third of the patients with monosomy 7, erythroid cells comprised more than half of all BM cells. Although erythroid hyperplasia was primarily seen in children with monosomy 7, this was not exclusive. These clinical observations are consistent with the finding that erythroid cells in CMML may be of clonal origin from a malignant early progenitor cell.58 59
BM erythroid hyperplasia was not correlated with an increased number of circulating erythroblasts or an increased number of reticulocytes, but macrocytosis of red blood cells was correlated with monosomy 7. Although the association of monosomy 7 with a low Hb F and a normal karyotype with an elevated Hb F level has been appreciated, it has rarely been pointed out that this finding is surprising and contrary to what one might expect. Red blood cells in CMML with a normal karyotype or cytogenetic abnormalities other than monosomy 7 may show a marked increase in Hb F and other characteristics of fetal erythropoiesis,60-62 but they are rarely macrocytic. In fact, about one quarter of these children have microcytosis in the absence of a classic laboratory constellation of iron deficiency (data not shown). On the other hand, children with monosomy 7 often have macrocytosis but normal Hb F levels. The puzzling relationship between Hb F, other signs of fetal or disordered erythropoiesis, and the size of red blood cells in CMML remains to be explained.
Monosomy 7 was shown in 25 of the 98 patients with evaluable data. These data are in good agreement with a 24% and 29% frequency of monosomy 7 among 46 and 41 children of an American and British cohort, respectively.4,16 One of the patients with monosomy 7 lost his chromosomal abnormality after splenectomy and could be observed for 11 years without evidence of disease. Similar cases of spontaneous cytogenetic remission have been reported.63,64 Although in 20 of the 25 patients monosomy 7 was the sole abnormality, 5 patients had additional changes. Chromosomal abnormalities other than monosomy 7 were noted in 10 children. They included 4 with a 7q− breakpoint but displayed a broad diversity, as has been reported.6,16,65 Although a number of familial cases with monosomy 7 or other karyotypes are known,4,6 16 there was no pair of siblings included in our patient population.
The survival of children who did not receive BMT was poor, with about half and one quarter of the patients being alive at 1 and 2 years after presentation, respectively. Two of the 72 children are long-term survivors without evidence of disease 9 years after diagnosis. Castro-Malaspina et al6 reported 6 of 38 patients surviving more than 10 years. It is conceivable that the long-term survivor with normal karyotype reported here did not suffer from CMML. Obviously, in vitro studies to identify spontaneous growth or hypersensitivity toward granulocyte-macrophage colony-stimulating factor66-68 had not been performed in this case.
Survival of the 72 patients without BMT was influenced by platelet count, bleeding, age, Hb F, reticulocytes, the percentage of blasts in PB, the percentage of blasts in the myeloid BM compartment, and clinical abnormalities other than NF1. Karyotype did not influence survival significantly. The predictive value of platelet count, bleeding, age, and peripheral blasts has also been reported by the French investigators.6 In contrast to their results, we showed that Hb F was of prognostic value despite its correlation with age. Our data are in agreement with the British analysis identifying platelet count and Hb F as the strongest predictor for the length of survival in children with MDS.16 Although we did not evaluate therapy in detail, we believe that it is unlikely that intensive therapy other than BMT had a significant influence on survival in our patient population with CMML.40
BMT from an HLA-identical donor is the treatment of choice for children with CMML,47 resulting in a probability of survival of 0.39 (SE = 0.10) in the 32 patients analyzed. Because the distribution of risk factors in the BMT and non-BMT group was very similar (data not shown), survival after BMT might be similar, as observed within our BMT group. The timing of the procedure and the role of high-risk unrelated or haploidentical transplants for patients lacking a matched family donor remain to be determined. However, our data indicate that, in patients with a particularly short survival, such as those with a platelet count less than 33 × 109/L at diagnosis, BMT with a matched unrelated or haploidentical donor may be advisable.
In this retrospective study we analyzed all children given the diagnosis CMML, irrespective of karyotype. British investigators have chosen a different approach and defined separate entities based on karyotype and Hb F.16 Applying these criteria on our patient population, we found similar characteristics for the so-defined subgroups, with children given the diagnosis JCML having the shortest survival. However, the distinction of several subgroups of a rare entity such as CMML may contribute more to a confusion of nomenclature than be helpful. In addition, we believe that the term JCML, although established in the English literature, is a particular misnomer. We argue that CMML can be classified according to the FAB criteria, with the exception that one accept more than 5% myeloblasts in the PB.30 Because children with CMML and monosomy 7 cannot be distinguished by their clinical features and share a similar biology, we would prefer not to class them as a separate entity. There is a strong need to reach a broad agreement on nomenclature in pediatric MDS, because large cooperative treatment trials such as in BMT are on the way. We propose here the use of the FAB classification for MDS in childhood. For children with CMML, prognostic factors for the length of survival, such as platelet count, age, and Hb F, will be a helpful guide in reaching clinical decisions regarding timing and donor in BMT.
Address reprint requests to C.M. Niemeyer, MD, Universitäts-Kinderklinik, Mathildenstrasse 1, D-79106 Freiburg im Breisgau, Germany.

This feature is available to Subscribers Only
Sign In or Create an Account Close Modal