Key Points
scRNA-seq analysis of pPCs in patients shows an inflammatory phenotype that correlates with myeloma pathogenesis.
Inflamed pPCs have perturbed interactions with the TME leading to immunoparesis and correlate with decreased survival in MM.
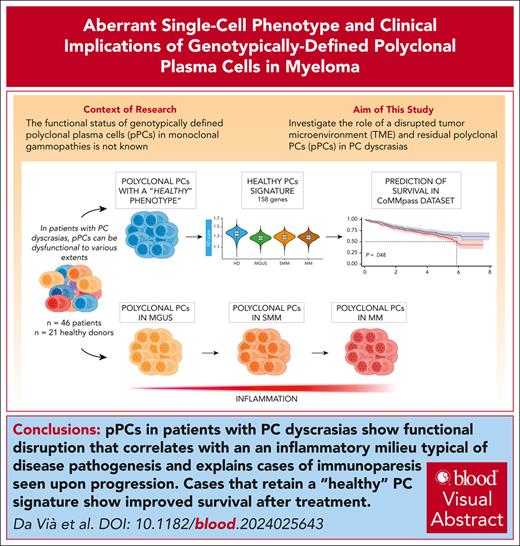
Visual Abstract
Multiple myeloma (MM) is driven by clonal plasma cell (cPC)–intrinsic factors and changes in the tumor microenvironment (TME). To investigate whether residual polyclonal PCs (pPCs) are disrupted, single-cell (sc) RNA sequencing (scRNA-seq) and sc B-cell receptor analysis were applied in a cohort of 46 samples with PC dyscrasias and 21 healthy donors (HDs). Of 234 789 PCs, 64 432 were genotypically identified as pPCs with frequencies decreasing over different disease stages, from 23.66% in monoclonal gammopathy of undetermined significance to 3.23% in MMs (P = .00012). Both cPCs and pPCs had a comparable expression of typical lineage markers (ie, CD38 and CD138), whereas others were more variable (CD27 and ITGB7). Only cPCs overexpressed oncogenes (eg, CCND1/2 and NSD2), but CCND3 was often expressed in pPCs. B-cell maturation antigen was expressed on both pPCs and cPCs, whereas GPRC5D was mostly upregulated in cPCs with implications for on-target, off-tumor activity of targeted immunotherapies. In comparison with HDs, pPCs from patients showed upregulated autophagy and disrupted interaction with TME. Importantly, interferon-related pathways were significantly enriched in pPCs from patients vs HDs (adjusted P < .05) showing an inflamed phenotype affecting genotypically normal PCs. The function of pPCs was consequently affected and correlated with immunoparesis, driven by disrupted cellular interactions with TME. Leveraging our scRNA-seq data, we derived a “healthy PC signature” that could be applied to bulk transcriptomics from the CoMMpass data set and predicted significantly better progression-free survival and overall survival (log-rank P < .05 for both). Our findings show that genotypic sc identification of pPCs in PC dyscrasias has relevant pathogenic and clinical implications.
Introduction
Multiple myeloma (MM) is a plasma cell (PC) neoplasm whose origin is in the germinal center of a secondary follicle.1,2 Initiating somatic events at the genomic level are thought to be translocations of recurrent oncogenes to the immunoglobulin heavy chain locus, or trisomies of several odd-numbered chromosomes.1 Asymptomatic PC expansions can be categorized as monoclonal gammopathy of undetermined significance (MGUS) or smoldering MM (SMM) based on the bone marrow (BM) monoclonal PC percentage.3-5 Evolution from MGUS to SMM and MM is paralleled by the acquisition of secondary somatic genomic events, such as gene mutations, further translocations, and copy-number abnormalities (CNAs).6-8 However, the serial study of MM samples evolved from SMM shows that some cases do not display genomic changes.9,10 Here, transformation to an aggressive clone has likely already happened. However, it is possible that not all clinical progressions are explained by genomics alone: indeed, a disrupted tumor microenvironment (TME) plays a clear pathogenic role in MM development11,12 by providing prosurvival and antiapoptotic stimuli.13-16 Furthermore, surveillance from immune TME cells has the potential to prevent the evolution of asymptomatic stages of PC dyscrasias17 and is disrupted along their progression.11,15,18-20 Strategies to restore anti-MM immune function are a promising treatment approach in relapsed/refractory MM cases, where high-risk genomic lesions are enriched and response to conventional treatments is poor.20-23 Indeed, in the era of novel immunotherapies, the quality of response depends not only on escape mechanisms by tumor cells but also on effector cell function.24-28 Immunoparesis, defined as reduced levels of ≥1 nonclonal immunoglobulin classes, is frequent in PC dyscrasias. Its prevalence increases from MGUS to SMM and MM and has prognostic value.29-31 In MM, immunoparesis can explain the increased susceptibility to infection and is associated with an overall worse prognosis.31,32 Clearly, immunoparesis can only be explained by the disruption of polyclonal PCs (pPCs). However, little is known about the functional properties of pPCs in various stages of PC dyscrasias.
Single-cell RNA sequencing (scRNA-seq) has the potential to dissect the clonal PC (cPC) and pPC populations, and initial studies have found a different transcriptomic signature of the 2 populations.32-34 However, our studies35 and others33,34 have shown that pPCs do not always clearly separate from cPCs in scRNA-seq uniform manifold approximation and projection (UMAP) plots, suggesting that a pure transcriptomic approach may be imperfect to accurately identify pPCs. Newer technologies allowing single-cell B-cell receptor (BCR) genotyping along with transcriptome sequencing of the same single cell are better suited for this task. In this study, we developed an algorithm to unambiguously identify pPCs at the single-cell genotypic level. This allowed us to study their functional properties in MGUS, SMM, and MM stages and in comparison with normal PCs from healthy donors (HDs), showing they have profoundly deranged functions affecting the TME and the production of polyclonal immunoglobulins, which ultimately correlate with disease progression and prognosis.
Materials and methods
A detailed description of all methods is presented in the supplemental Methods, available on the Blood website.
Sample selection
BM aspirates from 46 patients affected by MGUS (n = 7), SMM (n = 16), and MM (n = 23) were obtained at Fondazione IRCCS Ca' Granda Ospedale Maggiore Policlinico, Milan, Italy, according to the International Myeloma Working Group criteria,5 as well as 4 samples from HD. Detailed clinical information for each case is presented in supplemental Table 1.
Sample processing
Mononuclear cells were used with Ficoll-Paque medium (Cytiva, catalog no. 17144002) density gradient centrifugation, and CD138+ BM cells were prepared using the EasySep CD138 Positive Selection Kit II (STEMCELL Technologies, catalog no. 17887A), after erythrocyte lysis (Cytognos, catalog no. CYT-BL), following manufacturer’s instructions.
scRNA 5′ sequencing library construction and sequencing
The Chromium Next GEM Single Cell 5’ v2 protocol (CG000330 Rev E) was applied, and single-cell 5′ RNA-seq libraries were generated following standard manufacturer’s protocols.
BCR Amplification Kit (10x Genomics; PN-2000253) was used for analysis of the hypervariable V(D)J region of the BCR. Generated libraries were sequenced on a NovaSeq6000 platform (Illumina sequencing system) using a 150 bp paired end protocol, targeting ∼100 000 reads per cell and 15 000 reads per cell for 5′ gene expression (GEX) and V(D)J enriched libraries, respectively, according to manufacturer’s recommendations.
CD138+ preprocessing scRNA-seq analysis
The GEX and V(D)J scRNA-seq data were aligned and quantified using the Cell Ranger (version 7.1) pipeline, and the Seurat pipeline (version 4.4.0) was used to analyze expression matrices.
Polyclonal cell selection
PCs scRNA-seq analysis
scRNA-seq analysis was performed using the Seurat pipeline, using the reciprocal principal component analysis method for integration. The integrated Seurat object was scaled, and the batch effect was corrected by Harmony39 (version 1.2.0), before the functional enrichment analysis. To avoid cell clustering confounding factors, immunoglobulin-related genes (genes located in immunoglobulin heavy chain, immunoglobulin light chain λ, or immunoglobulin light chain κ loci) were removed for downstream analyses.11,33,35,40
Single-cell copy-number variation analysis
CNAs were inferred from single-cell GEX data using InferCNV R package41 (version 1.16.0, https://github.com/broadinstitute/inferCNV).
Single-cell HD signature definition and scoring
HD gene signature was defined by a differential GEX analysis (“wilcoxauc” R function) between HDs and MGUS, SMM, and MM, and only genes significantly upregulated in HDs (Benjamini-Hochberg adjusted P < .05; log fold change >0.1) were retained. Then, intersection of deregulated genes within each contrast using the “distinct” mode was calculated (ComplexHeatmap [version 2.18.0]).
Finally, the HD GEX signature was inferred in the multiple myeloma research foundation bulk RNA-seq data set (IA17 release, https://research.themmrf.org). Survival analysis was performed using survival (version 3.5-8) and survminer (version 0.4.9) packages.
CD138− preprocessing scRNA-seq analysis
GEX and V(D)J scRNA-seq data of matched 31 CD138− samples (n = 23 fresh and n = 8 frozen) were preprocessed using the Cell Ranger pipeline (version 7.1).
Cell-cell communication and interaction analysis
Interaction analysis was performed using the MultiNicheNet package (version1.0.3)42 implemented in R (https://github.com/saeyslab/multinichenetr). The analysis includes 31 matched samples, and it was performed integrating CD138+ cells and CD138− cells for the TME. Comparisons were conducted between patients with and without immunoparesis.31
Results
Landscape of pPCs across stages of PC dyscrasias
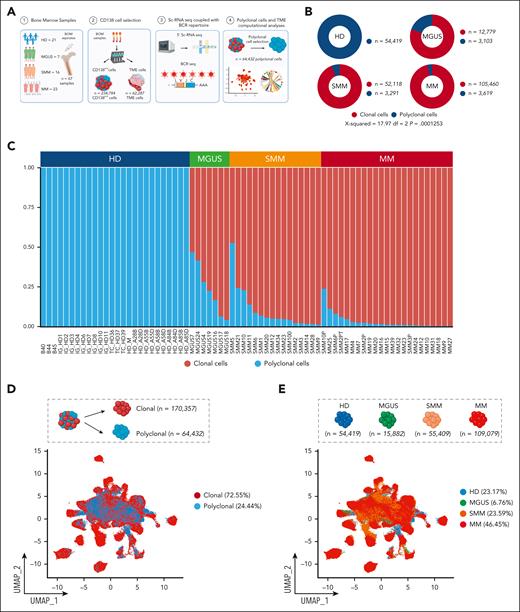
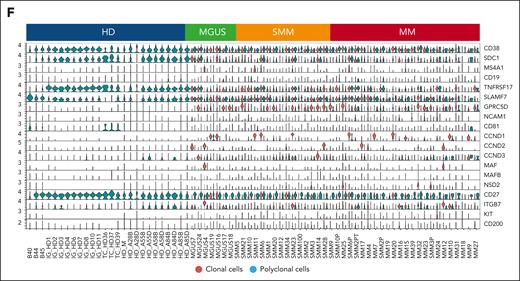
We analyzed CD138-purified samples from 7 patients with MGUS, 16 patients with SMM, and 23 patients with MM. CD138+ samples from HD were sourced locally (n = 4), from collaborators (n = 3), and from publicly available databases (n = 14).33,36 For patients with PC dyscrasias (supplemental Table 1), we developed a workflow (Figure 1A) to leverage single-cell data to genotypically identify cPCs vs pPCs. The polyclonal nature of the latter group was confirmed by the lack of identity and hierarchical relationship of the heavy and light chain BCR sequence with the BCR sequence of cPCs of the same patient (supplemental Table 2). PCs sharing the same light chain or substantial identity with the clonal sequence were excluded from analysis (“Materials and methods”; supplemental Table 2). CNA analysis through InferCNV41 confirmed that pPCs of each individual sample did not share any of the CNAs observed in their cPCs counterparts, in both supervised and unsupervised analyses (supplemental Figures 1-5). After filtering cells, a total of 234 789 PCs (n = 54 419 from HDs, n = 15 882 from MGUS, n = 55 409 from SMM, and n = 109 079 from MM) (Figure 1B) were used for further analysis. Using this approach, 170 357 cells (72.55%) were genotyped as cPCs and 64 432 (27.44%) as pPCs. Overall, the frequency of pPCs was higher for MGUS and decreased in SMM and MM samples. In MGUS, the mean percentage of pPCs was 23.66% (range, 6.34%-46.77%), whereas in SMM it dropped to 10.10% (range, 1.14%-52.69%) and in MM to 3.23% (range, 0.25%-23.65%; P = .00012, χ2 test) (supplemental Table 3). The absolute number of pPCs followed a similar trend, with 3103 (19.53%) in MGUS, 3291 (5.93%) in SMM, and 3619 (3.31%) in MM (Figure 1B-C).
Clonal and polyclonal cells identification in patients affected by PC dyscrasias and HD. (A) Schematic overview of cohort of samples and workflow of the study. (B) Donut charts representing the distribution of polyclonal (blue) and clonal cells (red) in PC dyscrasias and HDs. Numerical values are reported. (C) The proportions of clonal cells (red) and polyclonal cells (blue) in each sample, categorized by clinical state (top). (D) UMAP plot showing all clonal (red) and polyclonal (blue) cells, with numerical values. (E) UMAP representation of the sample space categorized by disease stage. Colors as in panel C. Numerical values and percentages are reported for each category. (F) Violin plots showing distribution of expression of genes commonly upregulated in patients with PC dyscrasias, along with annotations of the clinical classification (top). BM, bone marrow; df, degrees of freedom.
Clonal and polyclonal cells identification in patients affected by PC dyscrasias and HD. (A) Schematic overview of cohort of samples and workflow of the study. (B) Donut charts representing the distribution of polyclonal (blue) and clonal cells (red) in PC dyscrasias and HDs. Numerical values are reported. (C) The proportions of clonal cells (red) and polyclonal cells (blue) in each sample, categorized by clinical state (top). (D) UMAP plot showing all clonal (red) and polyclonal (blue) cells, with numerical values. (E) UMAP representation of the sample space categorized by disease stage. Colors as in panel C. Numerical values and percentages are reported for each category. (F) Violin plots showing distribution of expression of genes commonly upregulated in patients with PC dyscrasias, along with annotations of the clinical classification (top). BM, bone marrow; df, degrees of freedom.
We first analyzed cells in bulk, that is, merging the transcriptome of each single cell in a single “pPC” vs “cPC” sample for all patients with MGUS, SMM, and MM. pPCs were quite similar to cPCs in MGUS, with no differentially expressed genes. In turn, differentially expressed genes were found in SMM and MM as expected (supplemental Figure 6). However, the strength of scRNA-seq is to evaluate the contrasts among thousands of cells per sample without losing each individual signal, therefore retaining the heterogeneity of each sample and each cell within the sample. Performing this analysis, in the UMAP sample space, pPCs from different individuals tended to cluster together. However, there also was a considerable admixture of pPCs and cPCs in the sample space of each patient (Figure 1D; supplemental Figures 7-9A), indicating that transcriptomics alone may fail to accurately dissect every pPC from cPCs. The UMAP distribution of cells by disease stage showed how PCs from MGUS, SMM, and MM were progressively more distant from PC from HD, as expected (Figure 1E; supplemental Figure 9B). When stratified by fluorescence in situ hybridization, PC tended to cluster by cytogenetic group rather than by symptomatic stage (supplemental Figure 10). Next, we looked at canonical PC marker genes. Our analysis confirmed previous observations, such as the frequent loss of CD2733,43,44 in cPCs and their uniform expression of CD38, CD138, and B-cell maturation antigen (BCMA) (TNFRSF17; Figure 1F). As expected, oncogenes such as NSD2, CCND1/2, and MAF were only expressed in cPCs. Interestingly, we found GPRC5D expression to be on average lower in pPCs than in cPCs from the same patients, differently from BCMA (supplemental Figure 11). This might explain the lower risk of infections of anti-GPRC5D T-cell redirecting immunotherapies than anti-BCMA treatments.25 Of note, pPCs frequently expressed markers usually attributed to cPCs, such as IGTB7 and CCND3, and this was true for both pPCs from patients and PCs from HDs (Figure 1F).
pPCs from patients show deregulated expression profiles and an inflammatory phenotype
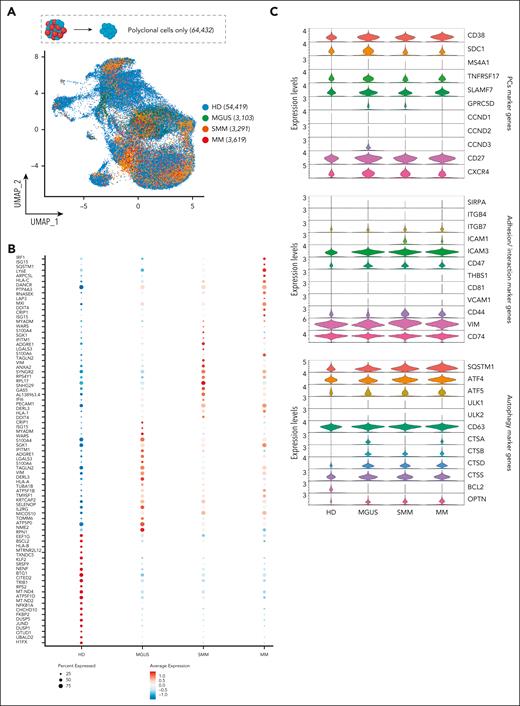
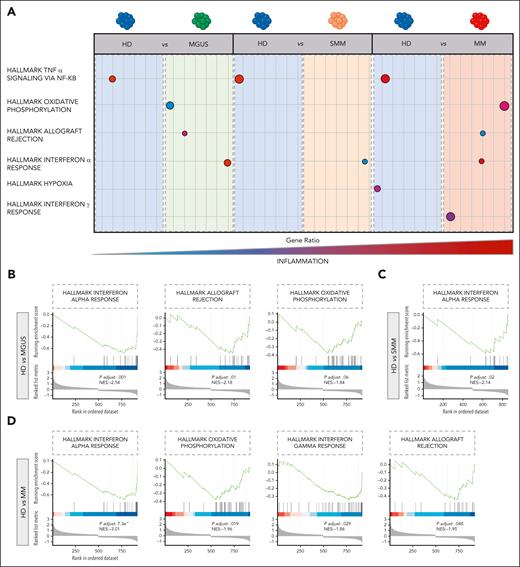
We next restricted our analysis to the phenotype of 64 432 pPCs to determine their transcriptomic heterogeneity. After filtering cells using standard quality controls (supplemental Figure 12A-C), pPCs were replotted along with PCs from HDs: here, we observed a slight divergence of cells from patients and HDs, but overall there was a considerable overlap of cells from all disease stages (Figure 2A). After creating UMAP plots by clusters and by patients (supplemental Figure 13A-B), we next asked what genes are differentially expressed in the different clinical categories. Analysis of differentially expressed genes showed that pPCs from patients had a similar pattern, different from HDs (Figure 2B). The latter group showed overexpression of genes such as DUSP1, BTG1, FKBP2, and NFAKB1A, mainly involved in controlling MAPK signaling, protein folding, and protection against oxidative stress. Conversely, in pPCs from patients, we found upregulation of genes usually associated with inflammation and/or stress conditions (ie, IRF1, ISG15, and IFITM1), the autophagy receptor SQSTM1 and the VIM gene, often upregulated during epithelial to mesenchymal transition (Figure 2B). Canonical PC marker genes were not different between pPCs in patients and HDs. Other genes were instead exclusively expressed in pPCS from patients, such as CTSB, CTSD, and OPTN involved in autophagy. Even more interestingly, we found that only PCs from SMM and MM upregulated the surface integrin ICAM1, implying that interaction with the TME changes for pPCs in more advanced stages (Figure 2C). We performed a differential expression (DE) analysis to look at pathway analyses in all possible 1:1 contrast combinations (Wilcoxon rank sum test, with adjusted P value Benjamini-Hochberg correction): there was an upregulation of inflammatory pathways (hallmark tumor necrosis factor α and interferon alfa [IFN-α] response, hallmark oxidative phosphorylation) in pPCs from patients compared with HDs, as well as comparing pPCs across disease stages with each other, with the most clear-cut differences between MGUS and SMM/MM (Figure 3A; supplemental Figure 14A-C). Statistics are presented in supplemental Table 4. In summary, we showed a climax of increasing inflammatory status in pPCs from HD to MM (Figure 3B-D; supplemental Figure 14A-C).
Polyclonal cell selection and marker genes expression by clinical stages. (A) UMAP of scRNA-seq data of pPCs with colors indicating clinical clusters. Numerical values are reported for each category. (B) Dot plot displaying the top 20 marker genes that distinguish each clinical state. The x-axis lists the clinical category, whereas the y-axis lists gene names. Circle size corresponds to the number of cells in the category expressing the gene of interest, whereas the color shade correlates with the level of expression. (C) Violin plot showing expression pattern of selected PCs, adhesion/interaction, and autophagy marker genes across all the clinical stages.
Polyclonal cell selection and marker genes expression by clinical stages. (A) UMAP of scRNA-seq data of pPCs with colors indicating clinical clusters. Numerical values are reported for each category. (B) Dot plot displaying the top 20 marker genes that distinguish each clinical state. The x-axis lists the clinical category, whereas the y-axis lists gene names. Circle size corresponds to the number of cells in the category expressing the gene of interest, whereas the color shade correlates with the level of expression. (C) Violin plot showing expression pattern of selected PCs, adhesion/interaction, and autophagy marker genes across all the clinical stages.
Transcriptional characterization of pPCs. (A) Cartoon depicting the deregulated expression profiles of pPCs, derived from 1:1 DE analyses by Wilcoxon test. Circle size corresponds to the number of cells in the category expressing the gene of interest, whereas shade correlates with the level of expression. Color code as in Figure 1C. (B-D) Gene set enrichment analysis (GSEA) plots depicting the enrichment of signal pathways based on the hallmark gene set. NES, normalized enrichment score.
Transcriptional characterization of pPCs. (A) Cartoon depicting the deregulated expression profiles of pPCs, derived from 1:1 DE analyses by Wilcoxon test. Circle size corresponds to the number of cells in the category expressing the gene of interest, whereas shade correlates with the level of expression. Color code as in Figure 1C. (B-D) Gene set enrichment analysis (GSEA) plots depicting the enrichment of signal pathways based on the hallmark gene set. NES, normalized enrichment score.
Single-cell transcriptomic correlates of immunoparesis
Production of polyclonal immunoglobulins in patients with PC dyscrasias is impaired to variable extents. Particularly, reduction in the production of uninvolved immunoglobulins is seen as a risk factor for progression in asymptomatic conditions31,45 and as a risk factor for survival and infections in MM, where it also predicts lower response to vaccination.46-49 Our unique data set allowed us to specifically characterize the transcriptional profiles of pPCs in patients with and without immunoparesis, defined as the decrease of ≥1 of the uninvolved immunoglobulin classes.31 Having shown the presence of strongly enriched inflammatory pathways in pathological pPCs, we next sought to define their expression profile in patients with immunoparesis.
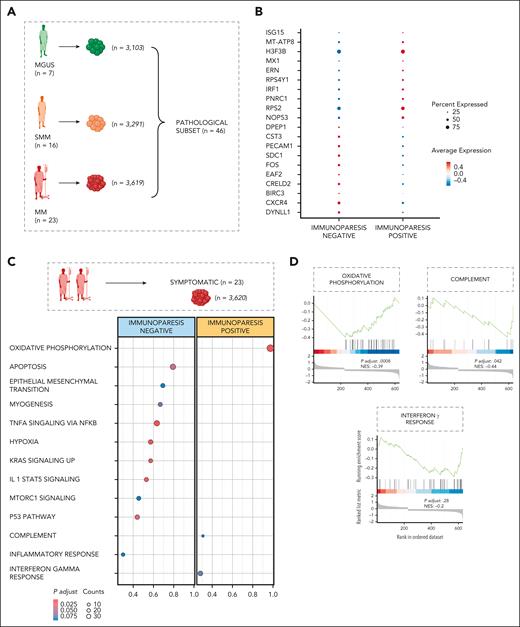
Of 46 patients (n = 10 013 pPCs; Figure 4A), 38 showed immunoparesis. We first observed that pPCs frequency tended to decline in patients showing immunoparesis (supplemental Figure 15A-D), likely explaining at least in part the decreased production of immunoglobulins. Next, we analyzed their GEX profile. The patients without immunoparesis showed the expression of genes related to NF-κB (ie, BIRC3), cell adhesion (ie, CXCR4, SDC1, and PECAM1), autophagy (ie, FOS and CST3), and antiapoptotic pathways (ie, DYNLL1). Compared with pPCs in patients without immunoparesis, pPCs in patients with immunoparesis showed upregulation of genes related to the IFN pathway (ie, IRF1, MX1, and ISG15), unfolded protein response (ERN1), and cell proliferation and apoptosis (ie, H3F3B and NOP53), implying a more deregulated transcriptome (Figure 4B). Then, to explore the functional consequences of GEX deregulation, we performed DE analysis comparing the immunoparesis status within the subset of symptomatic patients (n = 23). Here, in the presence of immunoparesis, pPCs were functionally enriched for IFN-related pathways (hallmark IFN-γ) and oxidative phosphorylation (Figure 4C-D). Statistics are presented in supplemental Table 5. Taken together, our results reveal consistent changes in expression profiles of pPCs in patients with immunoparesis and correlate the presence of a proinflammatory phenotype with decreased immunoglobulin production.
Transcriptomic landscape of immunoparesis. (A) Cartoon showing the pathological subset of patients (MGUS, SMM, and MM), for downstream DE analyses. Color code as shown in Figure 1C. (B) Dot plot of top 10 marker genes that distinguish patients with and without immunoparesis. The x-axis lists the clinical category, whereas the y-axis lists gene names. Circle size corresponds to the number of cells in the category expressing the gene of interest, whereas shade correlates with the level of expression. (C) DE analysis comparing the patients with or without immunoparesis within a symptomatic subset of patients, using Wilcoxon rank sum test, with adjusted P value Benjamini-Hochberg correction. No immunoparesis, blue; immunoparesis, yellow. (D) GSEA on the genes ranked by their contribution to hallmark oxidative phosphorylation, complement and IFN-γ response. NES, normalized enrichment score.
Transcriptomic landscape of immunoparesis. (A) Cartoon showing the pathological subset of patients (MGUS, SMM, and MM), for downstream DE analyses. Color code as shown in Figure 1C. (B) Dot plot of top 10 marker genes that distinguish patients with and without immunoparesis. The x-axis lists the clinical category, whereas the y-axis lists gene names. Circle size corresponds to the number of cells in the category expressing the gene of interest, whereas shade correlates with the level of expression. (C) DE analysis comparing the patients with or without immunoparesis within a symptomatic subset of patients, using Wilcoxon rank sum test, with adjusted P value Benjamini-Hochberg correction. No immunoparesis, blue; immunoparesis, yellow. (D) GSEA on the genes ranked by their contribution to hallmark oxidative phosphorylation, complement and IFN-γ response. NES, normalized enrichment score.
The interactome landscape of immunoparesis in pPCs
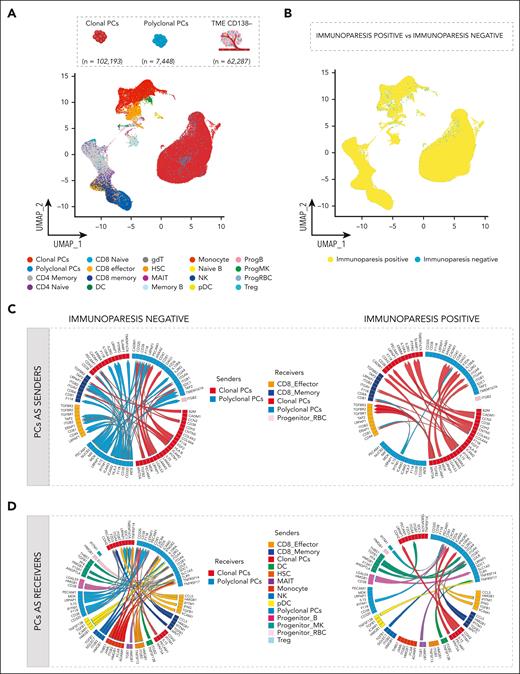
Given that progression and persistence of MM are influenced by the BM TME and functional properties of both cPCs and pPCs are clearly dependent on interactions with the TME, we next investigated the cell-cell interactions between PCs repertoire and TME in the BM. To gain a first insight into the composition of the TME, we performed scRNA-seq of 31 paired CD138+ and CD138− cell fractions within our cohort. In total, we integrated 171 928 cells into a single data set and used the MultiNicheNet pipeline,42 a tool that infers cell-cell interactions based on ligand-receptor expression and on the pathway activation downstream of the ligand in different cell types. Within this dataset, 102 194 cPCs, 7447 pPCs, and 62 287 TME cells were analyzed (supplemental Table 6). The TME and the PCs’ compartment mapped separately in UMAP plots (Figure 5A). Here, we found 148 006 cells from 23 samples (n = 89 037 cPCs, n = 3923 pPCs, and n = 55 046 TME cells) characterized by immunoparesis and 23 922 cells from 8 immunoparesis-negative samples (n = 13 157 cPCs, n = 3524 pPCs, and n = 7241 TME cells; Figure 5B). Splitting the TME data by cell type, 32 966 T cells, 3472 B cells, 15 261 myeloid cells, 6589 natural killer (NK) cells, 1019 dendritic cells, and 2980 hematopoietic stem cells (HSCs) were analyzed and no significant differences were observed in the relative composition of the TME populations between patients with and without immunoparesis (Figure 5B; supplemental Table 6; supplemental Figure 16) with the known exception of a significant depletion of pPCs in patients immunoparesis patients (adjusted P = .004; supplemental Figure 16).
Predicted interactions of PCs with microenvironment. (A) UMAP representation of PCs integrated with TME, colors indicate TME cell types. (B) UMAP plot of PCs integrated with TME colored according to immunoparesis. Color code as shown in Figure 4C. (C-D) Circos plots illustrate ligand-receptor interactions between pPCs (blue), cPCs (red), and TME, according to presence or absence of immunoparesis. Ribbon arrows indicate directionality of communication, from sender to receiver populations, whereas the arrow’s color signifies the specific sender cell type expressing the ligand. PCs were set as senders (C) and as receivers (D). DC, dendritic cells; gdT, γδ T cells; ProgB, B-cell progenitors; ProgMK, megakaryocyte progenitors; Treg, T-regulatory cells.
Predicted interactions of PCs with microenvironment. (A) UMAP representation of PCs integrated with TME, colors indicate TME cell types. (B) UMAP plot of PCs integrated with TME colored according to immunoparesis. Color code as shown in Figure 4C. (C-D) Circos plots illustrate ligand-receptor interactions between pPCs (blue), cPCs (red), and TME, according to presence or absence of immunoparesis. Ribbon arrows indicate directionality of communication, from sender to receiver populations, whereas the arrow’s color signifies the specific sender cell type expressing the ligand. PCs were set as senders (C) and as receivers (D). DC, dendritic cells; gdT, γδ T cells; ProgB, B-cell progenitors; ProgMK, megakaryocyte progenitors; Treg, T-regulatory cells.
To understand disruption of intercellular relationships in this scenario, we first analyzed the immunoparesis-negative setting. Comparing top-ranked ligand-receptor interactions and analyzing the downstream targets, pPCs were predicted to be able to send signals to specific cell compartments such as pPCs, CD8 effector, CD8 memory, and progenitor red blood cells (Figure 5C; supplemental Figure 17A-B). Mining PCs as senders, of relevance were the CD38:PECAM1 (CD31) cell interaction, with a role in regulation of cell migration, and a broad spectrum of interactions mediating cell adhesion involving ICAM2, ICAM3, and ITGB2 (T lymphocytes), already described in promoting cell survival processes.50-54 Furthermore, cPCs and pPCs displayed the ability to receive signals from myeloid (dendritic cells [DCs], HSCs, monocytes, plasmacytoid DCs [pDCs], and megakaryocyte progenitor cells) and lymphoid compartments (CD8 effector, CD8 memory, NK, progenitor B, and mucosal-associated invariant T [MAIT] cells).
In this scenario, immune and inflammatory responses were driven by the specific interaction of THBS-1 in monocytes and megakaryocyte progenitor cells with SDC1 in pPCs and ITGA6 in pPCs and by the signaling of HMGB-1 in HSCs, NK, pDCs, MAIT, CD8 cells, progenitor B cells, and monocytes and SDC1 (in pPCS). In addition, we found CCL5:SDC1 ligand-receptor interactions between T cells and cPCs/pPCs, which are known to be involved in tumor cell migration.55 Looking at the downstream deregulated gene targets, derived by ligand-target correlation, genes implicated in the autophagy axis and in endoplasmic reticulum stress (BNIP3, MT1X, and MT2A)56,57 were upregulated, as well as B-cell survival pathways regulators (ie, CD74 and ITGA658; supplemental Figure 18A-B). These findings highlight an active involvement of pPCs in the proinflammatory TME in immunoparesis-negative cell landscape. However, pPCs in this setting maintain their functional role through autophagy, endoplasmic reticulum stress regulation, and B-cell survival pathway activation.
Conversely, cPCs became the main contributor of TME interactions in the immunoparesis-positive cell landscape, where a significant depletion of pPCs:TME interactions was observed (Figure 5D; supplemental Figure 19A-B). These differences were not simply determined by a depletion of pPCs because the DE analyses are normalized for cell count.
In detail, cPCs and pPCs were characterized by the inflammatory signaling mediated by the IFITM1:CD81 interaction (pPCs:pPCs, pPCs:CD8 effector/memory cells, Treg:pPCs), which is involved in IFN-γ response pathway.59,60 Of note, in this scenario where the interactions between myeloid compartment and pPCs were significantly depleted, DCs and pDCs were found to sustain pPCs survival through BAFF-BCMA axis.61-63
Furthermore, the axis TGFB2:TGFBR1/TGFBR2/TGFBR3 mediated interactions between cPCs and CD8 T cells together with TGFB1:ITGB1 (MAIT and NK with pPCs), suggesting a role of PCs in the immunosuppression of T-cell compartment. Of note, the γ-chain cytokine IL-15 was shown to signal from pPCs in an autocrine manner to pPCs and in a paracrine manner to cPCs by binding the common cytokine receptor γ chain (γc or CD132; encoded by the IL2RG gene) in the immunoparesis-negative setting. Conversely, in patients with immunoparesis, this cytokine signals from cPCs to cPCs and pPCs through the IL15RA receptor.64-67 Only in this latter setting, the downstream signaling involves activation of proinflammatory pathways. Furthermore, downstream target genes related to inflammation and IFN pathways were upregulated (ie, IFI16, IFIT3, and PLSCR1),68 as well as negative regulators of NF-κB pathway such as TNFSF10. Conversely, in this setting genes related to autophagy and B-cell maintenance were downregulated (ie, CSTH, BNIP3, MTX1, and MT2A33,56; supplemental Figure 20A-B). Altogether these data support the presence of a proinflammatory status in patients with immunoparesis, driven by aberrant cellular interactions not found in patients without immunoparesis, likely affecting pPCs survival and function.
Signature analysis allows prediction of survival in independent data sets
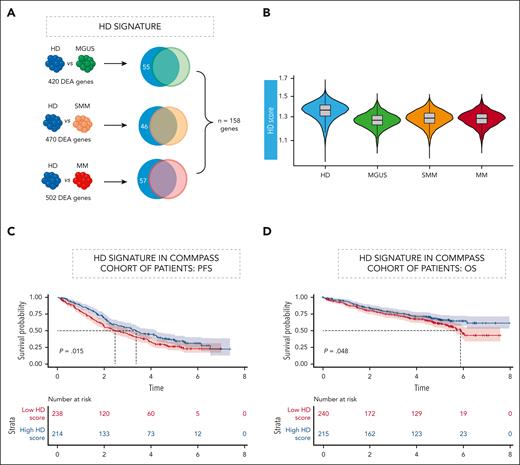
The presence of residual normal PCs has been correlated with prognosis in patients with MM.32,33 Our data show that even pPCs in patients can be profoundly dysregulated and different from normal PCs in HDs. Therefore, our unique data set allowed us to generate a “healthy PC” (hPC) signature through the union of the differentially expressed genes in the 3 contrasts of PCs from HD with pPCs from patients with MGUS, SMM, and MM, respectively. Importantly, our hPC signature corrects for the dysregulated expression of pPCs in patients and incorporates a total of 158 genes (Figure 6A; supplemental Table 7) representing genes truly expressed in hPCs only.
An “hPC” signature analysis allows prediction in independent data sets. (A) HD gene signature defined by a DE analysis between HDs and MGUS, SMM, and MM. For each contrast genes significantly upregulated in HDs (Benjamini-Hochberg adjusted P < .05; log fold change >0.1) were retained. Venn diagram to show the intersection of deregulated genes within each comparison. Color code as shown Figure 1C. (B) Violin plot showing the inference of HD in the cohort of patients. (C-D) Clinical impact of HD signature in CoMMpass RNA-seq data. PFS (C) and OS (D) Kaplan-Meier curves in the cohort of patients. OS, overall survival; PFS, progression-free survival. Time is measured in years.
An “hPC” signature analysis allows prediction in independent data sets. (A) HD gene signature defined by a DE analysis between HDs and MGUS, SMM, and MM. For each contrast genes significantly upregulated in HDs (Benjamini-Hochberg adjusted P < .05; log fold change >0.1) were retained. Venn diagram to show the intersection of deregulated genes within each comparison. Color code as shown Figure 1C. (B) Violin plot showing the inference of HD in the cohort of patients. (C-D) Clinical impact of HD signature in CoMMpass RNA-seq data. PFS (C) and OS (D) Kaplan-Meier curves in the cohort of patients. OS, overall survival; PFS, progression-free survival. Time is measured in years.
Applying the hPC signature in our cohort, a gradient could be observed, with the signature being enriched in HD and progressively less represented in pPCs from MGUS, SMM, and MM cases (Figure 6B).
Finally, we determined whether enrichment for the hPC signature could have a clinical impact within a newly-diagnosed MM population. We hypothesized that in bulk RNA-seq generated from CD138-selected cells part of the signal could be generated by pPCs, and our single-cell derived signature could identify the relevant genes even if expressed in a minority of cells. Therefore, we interrogated the RNA-seq data of CoMMpass69 and ranked patients based on the fractional representation of the hPCs signature. A simple categorical distinction based on the enrichment of the hPCs signature above and below the median clearly separated patients based on their survival. In particular, the median progression-free survival was 3.36 years (95% confidence interval, 2.75-4.23) in patients above the median and 2.47 years (95% confidence interval, 1.99-3.18) in patients below the median (P = .015, log-rank test; Figure 6C). Median overall survival was not reached in patients above the median and was 5.87 years (range, 5.36 to not reached) in patients below the median (P = .048, log-rank test; Figure 6D). Based on these results, we assume that the hPCs signature might represent a surrogate of residual functional “polyclonality” within the BM and has prognostic value.
Discussion
The TME architecture has long been implicated in the initiation and evolution of PC dyscrasias. pPCs are an obvious component of the TME but have been understudied despite a clear biological and clinical relevance. Part of this depends on technical issues. For example, pPCs cannot be separated from cPCs based on isolation with magnetic beads while doing so with flow sorting is complicated and not easily performed by most laboratories. In this scenario, we applied a comprehensive approach including scRNA-seq coupled with BCR genotyping to unambiguously identify and study pPCs.
Using this advanced approach, we provide evidence that pPCs would not necessarily be identified with accuracy based on transcriptomics alone. Indeed, after removing immunoglobulin genes, that is, highly expressed cell-specific genes accounting for a big part of the transcriptomic diversity between PCs, pPCs did not necessarily segregate away from cPCs from the same patient in the UMAP space, suggesting they might be themselves phenotypically aberrant. This is different from previous studies33 and can be explained at least in part by the innovative methodology we employed.
pPCs from patients showed the expected DE of canonical marker genes compared with cPCs. However, we also convincingly show that GPRC5D expression is natively lower in pPCs than in cPCs, a finding that may suggest that anti-GPRC5D bispecific antibodies may relatively spare pPCs and explain the lower prevalence of infections in such patients contrary to anti-BCMA antibodies.70
Moreover, our data reveal a profoundly dysregulated transcriptomic landscape of pPCs from patients affected by asymptomatic or symptomatic PC dyscrasias compared with BM PCs derived from HDs sourced with a broad age range. In this setting, pPCs showed upregulation of IFITM1, SQTM1, CTSB, CTSD, and OPTN59,60 markers and ICAM1,71-75 implying an upregulation of inflammation, autophagy, and IFN pathways, with a climax from asymptomatic to symptomatic patients. Of note, the primary purpose of autophagy is to sustain the cellular homeostasis in extreme conditions,76 such as the ones promoted by oxidative and proteotoxic stress owing to an intense production and secretion of immunoglobulins.76-78 Therefore, autophagy is fundamental for long-lived PCs to optimize the protein metabolism and the cell viability,77-80 and we believe that this pathway is exaggerated in the setting of residual pPCs with the BM of patients with PC dyscrasias. Our findings also have translational implications. Patients showing immunoparesis had the lowest number of residual pPCs, and these cells were in turn also functionally aberrant. Indeed, pPCs derived from patients with immunoparesis showed upregulation of IRF1, MX1, SG15, ERN1, H3F3B, and NOP53 genes suggesting activation of IFN-α and IFN-γ pathways, unfolded protein response, and cell proliferation/apoptosis signaling in the suppression of uninvolved immunoglobulins. We further extended this analysis by looking at intercellular interactions between PCs and the TME within each patient, providing evidence of an inflamed TME in patients with immunoparesis. In this scenario, we observed a significant decrease in the number of interactions of pPCs with other immune cells in the TME. Furthermore, pPCs were characterized by a proinflammatory transcriptome, characterized by the interaction between IFITM1 and CD81 and the activation of the TGFB2:TGFBR1/TGFBR2/TGFBR3 axis that we see in our patients were indeed shown to be mainly driven by IFN pathways and may affect pPCs survival and function, including production of immunoglobulin M and immunoglobulin G.81 Altogether, our findings shed new light on mechanisms of deregulated pPCs homeostasis leading to immunoparesis in patients affected by PC dyscrasias. Furthermore, based on previous studies,82-84 we speculate that in these conditions the immune microenvironment could be less competent in antigen-presenting activity and in immunosurveillance, further adding to the complex interrelationships among antibody production, immunity, and tumor progression. Whether this was solely related to the burden of cPCs producing more inflammation in the TME, thus affecting the number and function of residual pPCs, or other factors influence these findings is something that will need to be further investigated.
Our data do not necessarily identify the primary cause of an inflamed TME. cPCs may be responsible through perturbed interaction with pPCs and other cells in the TME. However, it can also be argued that a proinflammatory TME can itself have a primary driver role, deranging the normal BM PC transcriptional program and thus promoting the growth of preexisting cPCs, harboring initiating genomic lesions, whose proliferative potential was not expressed until then. The notion that cPCs can progress to an overt MM without acquiring new genomic events and thus potentially based on microenvironmental stimuli is indeed quite substantial,80,85 and our data shed some light on the type of selection applied from the TME on BM pPCs.
Intriguingly, we also identified a specific “hPC” signature by comparing PCs from HD with pPCs of patients rather than to total CD138+ cells, which resulted decreased across disease stages. Notably, this signature can be applied to bulk RNA-seq. In the CoMMpass data set, patients with an HD signature enrichment over the median showed a better progression-free survival and overall survival. Given the PC-specific nature of the signature, this is not a result of less pure sampling. Rather, these findings emphasize the role of residual “functional polyclonality” within BM PCs, suggesting that the maintenance of a normal polyclonal population, and/or less transcriptionally disrupted cPCs, affects patient’s survival.82,86
In conclusion, our study uses a new methodology of analysis to gain deep insights into the transcriptional landscape of pPCs in PC dyscrasias, suggesting they are affected by TME disruption just as other immune cells. Therefore, their dysfunction can be used as a proxy for TME disruption promoted by MM and has biological and clinical consequences whose understanding may affect research and treatment of MM.
Acknowledgments
This work was supported by the European Research Council under the European Union’s Horizon 2020 research and innovation program (grant agreement number 817997), the International Myeloma Society and Paula and Rodger Riney Foundation Translational Research Grant Application 2023, and the Associazione Italiana Ricerca sul Cancro (AIRC) (grant IG25739). A.N. was supported by AIRC (IG24365). M.C.D.V. was funded by Umberto Veronesi Foundation and Pfizer Global Medical Grants (grant tracking number 75340503). A.G.S. was supported by the Fondo per il Programma Nazionale di Ricerca e Progetti di Rilevante Interesse Nazionale (project number 2022ZKKWLW). This study was supported, in part, by the Italian Ministry of Health, Current Research IRCCS.
Authorship
Contribution: N.B., M.C.D.V., and F.L. conceived the project and designed the experiments; N.B., M.C.D.V., C.D.M., and L.P. enrolled and followed up patients and acquired data; M.C.D.V., F.L., A. Maeda, and A. Matera performed single-cell experiments; A. Marella verified the raw data before analyses and performed preprocessing bioinformatic analysis; M.C.D.V., F.L., and A. Matera performed the bioinformatic analysis and interpreted data; M.L., S.P., S.F., E.C., M.B., S.L., M.S., N.L., G.C., A.G.S., V.D., G.M.P., L.M., R.G., A.N., F.T., C.F., T.C., A. Marchetti, and F.P. contributed with scientific discussions; A.C. and M.T. performed the flow cytometry experiments; and N.B., F.L., and M.C.D.V. wrote the manuscript, which has been revised by all the authors.
Conflict-of-interest disclosure: N.B. received honoraria for Amgen, GlaxoSmithKline (GSK), Janssen, Jazz, Pfizer, and Takeda. M.C.D.V. served on the advisory board for Takeda, Menarini, Amgen, Pfizer, and Johnson & Johnson and served on speakers bureau for Johnson & Johnson, Sanofi, and GSK. F.P. received honoraria during the last 2 years for lectures from Novartis, Bristol Myers Squibb, AbbVie, GSK, Janssen, and AOP Orphan and for advisory boards from Novartis, Bristol Myers Squibb/Celgene, GSK, AbbVie, AOP Orphan, Janssen, Karyopharm, Kyowa Kirin, MEI Pharma, Sumitomo, and Kartos. A.G.S. has received speaker honoraria from Sanofi, Amgen, and AstraZeneca; participated in advisory boards for Pfizer and Menarini; and received travel support for educational purposes from Janssen-Cilag. The remaining authors declare no competing financial interests.
Correspondence: Niccolò Bolli, Hematology Unit, Fondazione IRCCS Ca' Granda Ospedale Maggiore Policlinico, Via Francesco Sforza 35, 20122 Milan, Italy; email: niccolo.bolli@unimi.it.
References
Author notes
M.C.D.V. and F.L. contributed equally to this study.
The raw data have been deposited in the European Genome-phenome Archive (available at https://ega-archive.org/; accession number EGAC50000000232). R scripts are available at https://gitlab.com/bollilab.
Further information and requests should be directed to and will be fulfilled by the corresponding author, Niccolò Bolli (niccolo.bolli@unimi.it).
The online version of this article contains a data supplement.
There is a Blood Commentary on this article in this issue.
The publication costs of this article were defrayed in part by page charge payment. Therefore, and solely to indicate this fact, this article is hereby marked “advertisement” in accordance with 18 USC section 1734.

This feature is available to Subscribers Only
Sign In or Create an Account Close Modal