

Key Points
Human cellular model of CDA IV (KLF1+/E325K) accurately recapitulates patient disease phenotypes, providing a sustainable research resource.
Analysis of the CDA IV line reveals wide-ranging molecular defects and disordered biological processes, elucidating disease pathogenesis.

Abstract
Red blood cell disorders can result in severe anemia. One such disease congenital dyserythropoietic anemia IV (CDA IV) is caused by the heterozygous mutation E325K in the transcription factor KLF1. However, studying the molecular basis of CDA IV is severely impeded by the paucity of suitable and adequate quantities of material from patients with anemia and the rarity of the disease. We, therefore, took a novel approach, creating a human cellular disease model system for CDA IV that accurately recapitulates the disease phenotype. Next, using comparative proteomics, we reveal extensive distortion of the proteome and a wide range of disordered biological processes in CDA IV erythroid cells. These include downregulated pathways the governing cell cycle, chromatin separation, DNA repair, cytokinesis, membrane trafficking, and global transcription, and upregulated networks governing mitochondrial biogenesis. The diversity of such pathways elucidates the spectrum of phenotypic abnormalities that occur with CDA IV and impairment to erythroid cell development and survival, collectively explaining the CDA IV disease phenotype. The data also reveal far more extensive involvement of KLF1 in previously assigned biological processes, along with novel roles in the regulation of intracellular processes not previously attributed to this transcription factor. Overall, the data demonstrate the power of such a model cellular system to unravel the molecular basis of disease and how studying the effects of a rare mutation can reveal fundamental biology.
Introduction
Congenital dyserythropoietic anemia type IV (CDA IV; OMIM #613673) is a severe form of hemolytic anemia caused by a specific mutation in the essential erythroid transcription factor KLF1.
KLF1 regulates the expression of a plethora of genes in erythroid cells, with a multifunctional role throughout erythropoiesis (reviewed by Gnanapragasam and Bieker,1 Siatecka and Bieker,2 and Tallack et al3). Such a critical role of KLF1 is supported by KLF1−/− (null) mice, which die in utero from severe anemia,4,5 and KLF1-null humans, who display lethal hydrops fetalis without intervention.6 In contrast, monoallelic mutation of KLF1 in humans results in a benign clinical phenotype, although some KLF1-dependent target genes are sensitive to haploinsufficiency,7-11 and altered β-globin switching is observed with a mild increase in fetal hemoglobin (HbF) levels.12,13 In contrast, the monoallelic KLF1 mutation c973G>A, resulting in the substitution of glutamate 325 by lysine within the second zinc finger of KLF1,14,15 results in a severe disease phenotype, the underlying molecular mechanisms for which are unresolved.
Patients with CDA IV present with splenomegaly, red blood cell (RBC) osmotic fragility, iron overload, erythroid cell membrane abnormalities, markedly elevated HbF, high levels of nucleated and binucleated erythroid cells, and dyserythropoiesis.14,16-23 However, studying the molecular basis for such defects is severely impeded by the paucity of suitable and adequate quantities of material from patients with anemia, compounded by the rarity of the disease (11 patients reported to date).
To address this, we created a human model cellular system of CDA IV that accurately recapitulates the phenotype of erythroid cells from patients with CDA IV. This enabled extensive, robust, in-depth interrogation to identify the underlying molecular defects, importantly, within a physiologically relevant milieu. Through unbiased comparative quantitative proteomic analysis, we uncovered extensive distortion of the proteome in KLF1+/E325K cells, resulting in a wide range of disordered biological pathways. These collectively contribute to and explain the phenotypic and developmental abnormalities of patient erythroid cells and, thus, the disease phenotype. The data also reveal far more extensive involvement of KLF1 in previously assigned biological processes, along with novel roles in the regulation of intracellular processes not previously attributed to KLF1.
Methods
CRISPR-gene editing of BEL-A to generate KLF1+/E325K and KLF1+/− lines
BEL-A cells were transfected with pSpCas9(BB)-2A-GFP (px458; Addgene)–containing guide RNA, and donor template using AMAXA Nucleofector 2b. Single cell clones were expanded and sequenced, with clones heterozygous for KLF1 G973A (KLF1+/E325K) or for InDels (KLF1+/−) selected. All lines were expanded and differentiated as previously described.24
Quantitative proteomics
Proteomics was carried out as previously described25 using tandem mass tags (TMTs) and analyzed via nanoliquid chromatography tandem mass spectrometry (nano-LC-MS/MS) using an Orbitrap Fusion Tribrid mass spectrometer (all obtained from Thermo Fisher Scientific).
RNA sequencing
Library construction and sequencing were performed by Novogene Co Ltd on Illumina Novaseq 6000 (Pair-end 150).
Reverse-phase high-performance liquid chromatography for globin detection
Reverse-phase high-performance liquid chromatography was carried out as described by Loucari et al26 using a Phenomenex Jupiter 5 μm C18 (300Å) column and analyzed on an UltiMate 3000 liquid chromatography system.
Cardiolipin assay
Cardiolipin was measured in whole cell lysates using a fluorometric assay (ab241036; Abcam).
Detailed methods and statistical analysis are provided in the supplemental Methods, available on the Blood website.
Results
Novel KLF1+/E325K line recapitulates the phenotype of patient erythroid cells
To create a sustainable human model cell line of CDA IV (supplemental Figure 1A-D), we used CRISPR to introduce the G973A mutation into 1 (50%) KLF1 allele of BEL-A, an erythroid line that recapitulates normal adult erythropoiesis.27,28
The resultant KLF1+/E325K clonal line has predominantly proerythroblast morphology in line with wild-type (WT) BEL-A (Figure 1A), with just slightly reduced expansion and viability (supplemental Figure 1E-F). Total KLF1 levels were similar to WT BEL-A (Figure 1B; supplemental Figure 1G; confirmed by nano-LC-MS/MS), with no significant difference between expression of WT and E325K alleles (supplemental Figure 1H).
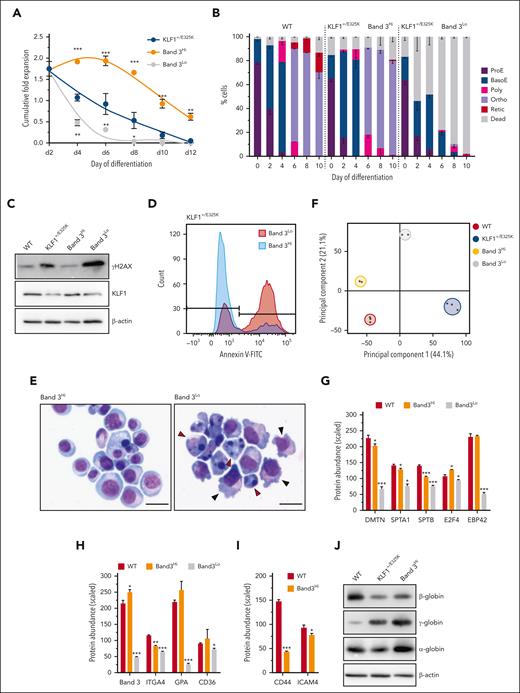
![Characterization of KLF1+/E325K (CDA IV) cell line. (A) Images of WT and KLF1+/E325K cells stained with May-Grünwald Giemsa. Original magnification ×400-800. Scale bars, 20 μm. Orange arrowheads indicate multinuclear proerythroblasts, red arrowheads indicate cells with membrane blebbing, and blue arrowheads indicate chromatin bridges. (B) Quantification of western blots (see supplemental Figure 1G; mean ± standard deviation [SD]; n = 3; ∗P < .05) for WT, KLF1+/E325K, and KLF1+/− expanding cells probed with KLF1 antibody, with β-actin as the loading control. (C) Proportion of multinuclear cells in expanding cell population quantified as a percentage of total live cells (n = 5; >100 cells counted per sample; ∗∗P < .01). (D) Cumulative fold expansion and (E) viability of WT, KLF1+/E325K, KLF1+/−, and KLF1+/ΔE325K cells during expansion (day 0) and on days 2, 4, 6, 8, 10, and 12 of differentiation (mean ± SD; n = 11. ∗P < .05 and ∗∗∗P < .001 for WT vs KLF1+/E325K; +P < .05 and +++P < .001 for WT vs KLF1+/−). (F) Percentage of cells tested positive for anV with fluorescein isothiocyanate (FITC) and negative with propidium iodide (PI) during expansion (day 0) and on days 2, 4, 6, 9, and 11 of differentiation (mean ± SD; n = 3; ∗∗∗P < .001). (G) Western blot of WT, KLF1+/E325K, and KLF1+/− cells probed with antibody to cleaved caspase 3, and to β-actin as loading control (representative of 3 biological repeats). (H) Percentage of cells positive for anV using FITC and PI during expansion (day 0) and on days 2, 4, 6, 9, and 11 of differentiation (mean ± SD; n = 3; ∗∗∗P < .001). (I) Percentage of erythroid cell types during expansion (day 0) and on days 2, 4, 6, 8, and 10 of differentiation, analyzed after staining with May-Grünwald Giemsa (mean ± SD; n = 5; >100 cells counted per sample). (J) Expression of (i) BCAM, (ii) AQP1, and (iii) ICAM4 determined via quantitative polymerase chain reaction (qPCR; mean ± SD; n = 4; ∗P < .05; ∗∗∗P < .001), and abundance of (iv) CD44 protein determined via flow cytometry using an allophycocyanin (APC)-labeled anti-CD44 antibody (mean ± SD; n = 3; ∗P < .05; ∗∗∗P < .001). BasoE, basophilic erythroblast; Ortho, orthochromatic erythroblast; ProE, proerythroblast; Poly, polychromatic erythroblast; Retic, reticulocyte.](/view-large/figure/11741132/BLOOD_BLD-2022-018735-gr1.jpg)
Characterization of KLF1+/E325K (CDA IV) cell line. (A) Images of WT and KLF1+/E325K cells stained with May-Grünwald Giemsa. Original magnification ×400-800. Scale bars, 20 μm. Orange arrowheads indicate multinuclear proerythroblasts, red arrowheads indicate cells with membrane blebbing, and blue arrowheads indicate chromatin bridges. (B) Quantification of western blots (see supplemental Figure 1G; mean ± standard deviation [SD]; n = 3; ∗P < .05) for WT, KLF1+/E325K, and KLF1+/− expanding cells probed with KLF1 antibody, with β-actin as the loading control. (C) Proportion of multinuclear cells in expanding cell population quantified as a percentage of total live cells (n = 5; >100 cells counted per sample; ∗∗P < .01). (D) Cumulative fold expansion and (E) viability of WT, KLF1+/E325K, KLF1+/−, and KLF1+/ΔE325K cells during expansion (day 0) and on days 2, 4, 6, 8, 10, and 12 of differentiation (mean ± SD; n = 11. ∗P < .05 and ∗∗∗P < .001 for WT vs KLF1+/E325K; +P < .05 and +++P < .001 for WT vs KLF1+/−). (F) Percentage of cells tested positive for anV with fluorescein isothiocyanate (FITC) and negative with propidium iodide (PI) during expansion (day 0) and on days 2, 4, 6, 9, and 11 of differentiation (mean ± SD; n = 3; ∗∗∗P < .001). (G) Western blot of WT, KLF1+/E325K, and KLF1+/− cells probed with antibody to cleaved caspase 3, and to β-actin as loading control (representative of 3 biological repeats). (H) Percentage of cells positive for anV using FITC and PI during expansion (day 0) and on days 2, 4, 6, 9, and 11 of differentiation (mean ± SD; n = 3; ∗∗∗P < .001). (I) Percentage of erythroid cell types during expansion (day 0) and on days 2, 4, 6, 8, and 10 of differentiation, analyzed after staining with May-Grünwald Giemsa (mean ± SD; n = 5; >100 cells counted per sample). (J) Expression of (i) BCAM, (ii) AQP1, and (iii) ICAM4 determined via quantitative polymerase chain reaction (qPCR; mean ± SD; n = 4; ∗P < .05; ∗∗∗P < .001), and abundance of (iv) CD44 protein determined via flow cytometry using an allophycocyanin (APC)-labeled anti-CD44 antibody (mean ± SD; n = 3; ∗P < .05; ∗∗∗P < .001). BasoE, basophilic erythroblast; Ortho, orthochromatic erythroblast; ProE, proerythroblast; Poly, polychromatic erythroblast; Retic, reticulocyte.
Characterization of KLF1+/E325K (CDA IV) cell line. (A) Images of WT and KLF1+/E325K cells stained with May-Grünwald Giemsa. Original magnification ×400-800. Scale bars, 20 μm. Orange arrowheads indicate multinuclear proerythroblasts, red arrowheads indicate cells with membrane blebbing, and blue arrowheads indicate chromatin bridges. (B) Quantification of western blots (see supplemental Figure 1G; mean ± standard deviation [SD]; n = 3; ∗P < .05) for WT, KLF1+/E325K, and KLF1+/− expanding cells probed with KLF1 antibody, with β-actin as the loading control. (C) Proportion of multinuclear cells in expanding cell population quantified as a percentage of total live cells (n = 5; >100 cells counted per sample; ∗∗P < .01). (D) Cumulative fold expansion and (E) viability of WT, KLF1+/E325K, KLF1+/−, and KLF1+/ΔE325K cells during expansion (day 0) and on days 2, 4, 6, 8, 10, and 12 of differentiation (mean ± SD; n = 11. ∗P < .05 and ∗∗∗P < .001 for WT vs KLF1+/E325K; +P < .05 and +++P < .001 for WT vs KLF1+/−). (F) Percentage of cells tested positive for anV with fluorescein isothiocyanate (FITC) and negative with propidium iodide (PI) during expansion (day 0) and on days 2, 4, 6, 9, and 11 of differentiation (mean ± SD; n = 3; ∗∗∗P < .001). (G) Western blot of WT, KLF1+/E325K, and KLF1+/− cells probed with antibody to cleaved caspase 3, and to β-actin as loading control (representative of 3 biological repeats). (H) Percentage of cells positive for anV using FITC and PI during expansion (day 0) and on days 2, 4, 6, 9, and 11 of differentiation (mean ± SD; n = 3; ∗∗∗P < .001). (I) Percentage of erythroid cell types during expansion (day 0) and on days 2, 4, 6, 8, and 10 of differentiation, analyzed after staining with May-Grünwald Giemsa (mean ± SD; n = 5; >100 cells counted per sample). (J) Expression of (i) BCAM, (ii) AQP1, and (iii) ICAM4 determined via quantitative polymerase chain reaction (qPCR; mean ± SD; n = 4; ∗P < .05; ∗∗∗P < .001), and abundance of (iv) CD44 protein determined via flow cytometry using an allophycocyanin (APC)-labeled anti-CD44 antibody (mean ± SD; n = 3; ∗P < .05; ∗∗∗P < .001). BasoE, basophilic erythroblast; Ortho, orthochromatic erythroblast; ProE, proerythroblast; Poly, polychromatic erythroblast; Retic, reticulocyte.
As observed for erythroid cells from patients with CDA IV,14,17,18,29,30 proportion of KLF1+/E325K cells were bi or multinuclear (Figure 1A,C; numbers are in line with patients17,21), with chromatin bridges detected between some daughter cells (Figure 1A). Plasma membrane blebbing was also visible (Figure 1A; supplemental Figure 1I), along with increased cell fragility in the hemolysis assay (data not shown), in line with defects in patient erythroid and RBCs. The karyotype of the line is shown in supplemental Figure 1J.
On differentiation, KLF1+/E325K cells exhibited marked dyserythropoiesis, with both expansion and viability significantly reduced, even by day 2 of differentiation (Figure 1D-E). Analysis of annexin V (AnV) binding, a marker of apoptosis, showed a significant increase in KLF1+/E325K cells on day 2 of differentiation (Figure 1F), with ∼50% cells AnV-positive, along with a corresponding increase in caspase 3 activation (Figure 1G). Significantly increased levels of AnV and caspase 3 activation were also detected in KLF1+/E325K cultures on days 0, 4, and 6, but levels were not as elevated. The increase in apoptosis markers was followed by a progressive increase in propidium iodide (PI)–positive cells, indicative of cell death (Figure 1H), correlating with the decreased viability shown in Figure 1E.
As highlighted by Varricchio et al,30 cell-surface markers (eg, band 3 and glycophorin A) used to monitor erythroid differentiation are KLF1 target genes and thus cannot be used for KLF1+/E325K cells. We, therefore, similarly, used morphological analysis (Figure 1I; supplemental Figure 2A). On day 0, there was no significant difference in the number of early erythroblasts in KLF1+/E325K and WT cultures. However, thereafter, cell loss in KLF1+/E325K cultures corresponded with differentiation of basophilic erythroblasts, suggesting acute sensitivity at this stage. In line with previous data from a KLF1-null mouse, KLF1 is dispensable at the proerythroblast stage but essential thereafter.31 The total KLF1 protein level in KLF1+/E325K cells had decreased on day 2 (supplemental Figure 2Bi-ii) to ∼62% or 75% of WT levels (determined via LC-MS/MS), as observed in patient cells during differentiation.30
As for patients in whom some orthochromatic erythroblasts and reticulocytes were detected, a small population of KLF1+/E325K cells (∼14%) survived, differentiating to orthochromatic erythroblasts at a rate similar to that of WT cells (Figure 1I; Supplemental Figure 2A), but as with patient cells,14 enucleation rates were severely reduced. This escaped population is also observed via flow cytometry of key RBC markers during differentiation (supplemental Figure 2C), and will be returned to later.
As for patient RBCs,14,16,18,20,21 the expression of CD44, ICAM4, and aquaporin-1 (AQP1) is significantly reduced in KLF1+/E325K cells, whereas basal cell adhesion molecule (BCAM) level remained normal (Figure 1J).
To demonstrate that the defective phenotype and behavior of KLF1+/E325K cells are not merely due to decreased WT KLF1 levels and, hence, KLF1 haploinsufficiency, we compared the data with that of a heterozygous KLF1 knockout line (KLF1+/−), created by CRISPR editing of KLF1 gene in BEL-A. The line has 1 nucleotide insertion in one KLF1 allele (supplemental Figure 3A-B) and ∼50% of WT KLF1 protein levels, maintained as such during differentiation (Figure 1B; supplemental Figures 1G and 2B). As for erythroid cells from individuals with monoallelic inactivating KLF1 mutations7-9,11-13 the KLF1+/− line had a benign phenotype and normal morphology (supplemental Figures 2A and 3C), with expansion, viability, and differentiation consistent with those of WT cells (Figure 1D-E,I; supplemental Figure 2A,C). However, as for donor cells,8,9 the expression of BCAM, CD44, and AQP1 (Figure 1J), genes sensitive to KLF1 haploinsufficiency,8,9,32 was significantly reduced. Of note, expression of CD44 and AQP1 was further reduced in KLF1+/E325K cells.
We also rescued the KLF1+/E325K line by knocking out the E325K allele (KLF1+/ΔE325K; supplemental Figure 1H), resulting in a KLF1+/− genotype with normal expansion, viability, and differentiation (Figure 1D-E; supplemental Figure 2A,C).
A striking feature of erythroid cells from patients with CDA IV is the very high level of HbF. A similar, significant increase in expression of HBG was found in KLF1+/E325K cells from day 2 of differentiation (Figure 2Ai,B-C), compared with both WT and KLF1+/− cells. In contrast, HBB expression was significantly decreased in KLF1+/E325K (Figure 2Aii,B-C). The expression of embryonic HBE and HBZ was also significantly increased in KLF1+/E325K, and HBD significantly decreased (Figure 2Aiv-vi), as found in cells from patients with CDA IV.14,22 There was no significant difference in the amount of total globin (Figure 2D). The high HBG expression in KLF1+/E325K cells can only partially be explained by the decreased levels of the KLF1-regulated HBG repressor BCL11A, because BCL11A expression in KLF1+/E325K and KLF1+/− cells on days 2 and 4 was not significantly different (Figure 2E). However, Ikaros, which is important for HBG silencing,33,34 the HBG1-messenger RNA (mRNA)–binding protein PUM1,35 and other recently identified potential γ-globin repressors36 are significantly reduced in KLF1+/E325K but not KLF1+/− cells (supplemental Figure 4). The HBG repressor ZBTB7A level was unaffected.

Altered expression of globin subunits in KLF1+/E325K cells. (A) Expression of (i) HBG, (ii) HBB, (iii) HBA, (iv) HBE, (v) HBZ, and (vi) HBD via qPCR. (B) Analysis of β-globin (β), δ-globin (δ), Gγ-globin (Gγ), α-globin (α), and Aγ-globin (Aγ) abundance in WT KLF1+/E325K, and KLF1+/− cells on day 6 of differentiation via reverse-phase high-performance liquid chromatography (RP-HPLC); (i) Representative chromatograms and (ii) quantification of chromatogram peak areas (mAU×min; mean ± SD, n = 3; ∗P < .05; ∗∗∗P < .001). (C) Western blots of WT, KLF1+/E325K, and KLF1+/− cells probed with antibodies of β-, γ-, and α-globin, with β-actin as a loading control (representative of 3 biological repeats). (D) Total globin abundance in WT, KLF1+/E325K, and KLF1+/− cells on day 6 of differentiation determined via RP-HPLC as in panel Bii (mean ± SD; n = 3). (E) Expression of BCL11A in WT, KLF1+/E325K, and KLF1+/− cells during expansion (day 0) and on days 2, 4, and 6 of differentiation, determined via qPCR (mean ± SEM; n = 3; ∗P < .05, ∗∗P < .01, and ∗∗∗P < .001 for WT vs KLF1+/E325K; +P < .05, ++P < .01, and +++P < .001 for WT vs KLF1+/−).
Altered expression of globin subunits in KLF1+/E325K cells. (A) Expression of (i) HBG, (ii) HBB, (iii) HBA, (iv) HBE, (v) HBZ, and (vi) HBD via qPCR. (B) Analysis of β-globin (β), δ-globin (δ), Gγ-globin (Gγ), α-globin (α), and Aγ-globin (Aγ) abundance in WT KLF1+/E325K, and KLF1+/− cells on day 6 of differentiation via reverse-phase high-performance liquid chromatography (RP-HPLC); (i) Representative chromatograms and (ii) quantification of chromatogram peak areas (mAU×min; mean ± SD, n = 3; ∗P < .05; ∗∗∗P < .001). (C) Western blots of WT, KLF1+/E325K, and KLF1+/− cells probed with antibodies of β-, γ-, and α-globin, with β-actin as a loading control (representative of 3 biological repeats). (D) Total globin abundance in WT, KLF1+/E325K, and KLF1+/− cells on day 6 of differentiation determined via RP-HPLC as in panel Bii (mean ± SD; n = 3). (E) Expression of BCL11A in WT, KLF1+/E325K, and KLF1+/− cells during expansion (day 0) and on days 2, 4, and 6 of differentiation, determined via qPCR (mean ± SEM; n = 3; ∗P < .05, ∗∗P < .01, and ∗∗∗P < .001 for WT vs KLF1+/E325K; +P < .05, ++P < .01, and +++P < .001 for WT vs KLF1+/−).
Overall, the data confirm validity of the KLF1+/E325K line in recapitulating the phenotype of patient cells, also clarifying the phenotype of KLF1+/E325K and CDA IV is due to the unique activity of the mutant KLF1 protein, not just to KLF1 haploinsufficiency. Characterization of a second KLF1+/E325K clone (KLF1+/E325KC2) showed the same phenotype (supplemental Figure 5).
Extensive proteomic analysis reveals highly distorted proteome of KLF1+/E325K cells
To identify the fundamental underlying molecular defects and mechanisms resulting in the severe CDA IV disease phenotype, we performed comparative quantitative proteomic analysis, focusing on the proteome as the functional readout of the genome; divergence between the erythroid transcriptome and proteome is becoming increasingly apparent, with transcripts not being reliable surrogates for protein levels in many instances.37-39 Analysis was performed using WT (n = 3) and KLF1+/E325K (n = 3) cells on days 0 and 2 of differentiation (Figure 3A), when defects due to the E325K mutation were clear but before substantial cell death occurred.

Comparative proteomics reveals highly distorted proteome of KLF1+/E325K cells. (A) Erythroid cell population types in (i) expanding (day 0) WT and KLF1+/E325K and (ii) on day 2 of differentiation. (B) PCA of comparative quantitative proteomic data for WT (red) and KLF1+/E325K (blue) during expansion (day 0; triangles) and on day 2 of differentiation (circles). (C) Volcano plots show significantly differentially expressed proteins in WT and KLF1+/E325K during (i) expansion (day 0) and on (ii) day 2 of differentiation. P-value(-log10) is plotted against the log2(KLF1+/E325K/WT). Vertical red lines indicate ±1.0 log2 fold change. The horizontal red line indicates significantly differentially expressed proteins (P = .05 before logarithmic transformation). Yellow proteins passed P = .05 and red proteins passed P = .05 and also had a ±1.0 log2 fold change or higher. Proteins passing false discovery rate calculations (FDR) are shown as triangles, those that failed as circles.
Comparative proteomics reveals highly distorted proteome of KLF1+/E325K cells. (A) Erythroid cell population types in (i) expanding (day 0) WT and KLF1+/E325K and (ii) on day 2 of differentiation. (B) PCA of comparative quantitative proteomic data for WT (red) and KLF1+/E325K (blue) during expansion (day 0; triangles) and on day 2 of differentiation (circles). (C) Volcano plots show significantly differentially expressed proteins in WT and KLF1+/E325K during (i) expansion (day 0) and on (ii) day 2 of differentiation. P-value(-log10) is plotted against the log2(KLF1+/E325K/WT). Vertical red lines indicate ±1.0 log2 fold change. The horizontal red line indicates significantly differentially expressed proteins (P = .05 before logarithmic transformation). Yellow proteins passed P = .05 and red proteins passed P = .05 and also had a ±1.0 log2 fold change or higher. Proteins passing false discovery rate calculations (FDR) are shown as triangles, those that failed as circles.
We found extensive alterations in the proteome of KLF1+/E325K cells. On day 0, of the 7200 unique proteins quantified, 2116 (29%) were significantly different in level compared with WT cells, 1226 increased, and 890 decreased. On day 2, 6672 unique proteins were quantified, of which 3815 (57%) were significantly different, 1847 increased, and 1968 decreased. (supplemental Table 1). The fewer dysregulated proteins on day 0 are in line with the more severe phenotype observed on day 2. Principal component analysis (PCA; Figure 3B) and volcano plots (Figure 3Ci-ii) illustrate the difference in proteomes between WT and KLF1+/E325K cells.
Comparison of the proteomic with an RNAsequencing (RNAseq) data set generated for WT and KLF1+/E325K cells on day 2 of differentiation gave a Pearson coefficient of 0.63 (supplemental Figure 6), in line with previously reported degree of discordance between the erythroid cell transcriptome and proteome,37,38 supporting the importance of analyzing the proteome when exploring the molecular basis of phenotype.
We also compared the proteome of KLF1+/E325K with that of KLF1+/− cells on day 2 of differentiation (supplemental Table 2). PCA demonstrated close similarity between the proteomes of WT and KLF1+/− cells, compared with the disparate profiles of KLF1+/E325K cells (supplemental Figure 7A). Volcano plots (supplemental Figure 7Bi-ii) clearly illustrate the differences between KLF1+/− and KLF1+/E325K cells.
As well as a greater number of proteins altered in level in KLF1+/E325K compared with KLF1+/− cells, the profile of dysregulation was distinct. To illustrate this, we compared the levels of known (or putative) KLF1-regulated genes6 between KLF1+/E325K, KLF1+/−, and WT cells. The overall profile (supplemental Figure 8A-B) showed that proteins decreased in level in KLF1+/− cells are generally further decreased in KLF1+/E325K cells, along with proteins decreased in KLF1+/E325K that are unaltered in KLF1+/−. In considering this, we40 and others14,41 had previously shown E325K KLF1 has reduced affinity for WT KLF1 DNA-binding motifs, leading us to propose that it actively interferes with WT KLF1–dependent processes by destabilizing transcription complexes.40 In line with this, coexpression of WT and E325K KLF1 in K562 cells, to mimic the heterozygosity of patient cells, showed E325K KLF1 reduces the transcriptional activity of WT KLF1 at the CD4414 and HBB (supplemental Figure 8C) promoter. In contrast, 19% of the analyzed proteins were increased in level in KLF1+/E325K cells compared with WT and KLF1+/− cells (supplemental Figure 8A-B).
Functional interrogation of proteomic data sets reveals dysregulated processes underlying the CDA IV disease phenotype
To reveal how alterations to the proteome result in the severe disease phenotype of CDA IV patient red cells, we interrogated the proteomic data sets using the Gene Ontology (GO) and Pathway Enrichment Analysis toolkits WebGestalt42 and Reactome43-45 to identify dysregulated biological processes.
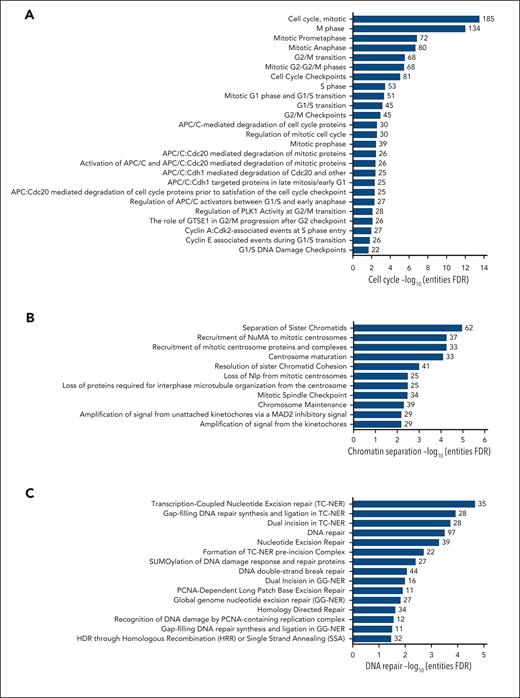
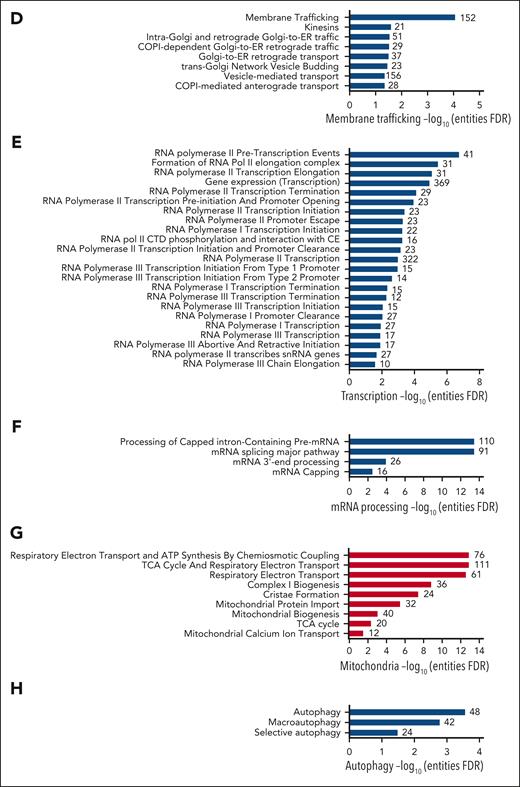
We found that KLF1+/E325K cells had wide-ranging, significantly (false discovery rate < 0.05) downregulated networks governing cell cycle, chromatin separation, transcription and mRNA processing, DNA repair, and membrane trafficking, and significantly upregulated networks governing mitochondrial processes (Figure 4; supplemental Figure 8i-ii).
Pathway analysis reveals multiple dysregulated fundamental biological processes in KLF1+/E325K cells. Proteins that were significantly (via FDR) decreased in level in KLF1+/E325K cells on day 2 of differentiation were analyzed using Reactome, which revealed overrepresentation of pathways associated with (A) cell cycle, (B) chromatin separation, (C) DNA repair, (D) membrane trafficking, (E) transcription, (F) mRNA processing, and (H) autophagy. Analysis of proteins significantly increased in level in KLF1+/E325K cells revealed overrepresentation of pathways primarily associated with (G) mitochondrial function. X-axis shows the –log10 of the FDR (q value) of pathway enrichment.
Next, we correlated the data to explain the phenotypic defects of CDA IV cells.
Dysregulation of cell cycle processes is linked to decreased cell expansion, chromatin bridges, bi/multinucleate cells, and apoptosis
KLF1 directly regulates the expression of critical cell cycle genes (reviewed by Siatecka and Bieker2), which are dysregulated in KLF1+/E325K cells, triggering a slight G0/G1 arrest (supplemental Figure 8A,D) along with a significant decrease in the average abundance for all cell cycle proteins (Figure 5A), contributing to decreased expansion of the cells. Many processes pertaining to the cell cycle were downregulated, including cell cycle checkpoints, chromosome alignment, and chromatid segregation (Figure 4A-B; supplemental Figure 9A).

Extensive dysregulation of proteins required for cell cycle and associated processes, DNA repair, and membrane trafficking in KLF1+/E325K cells. (A) Z-scored scaled abundance values for proteins associated with cell cycle (Gene Ontology database GO:0007049) and (B) chromosome segregation (GO:0098813) in WT and KLF1+/E325K cells on day 2 of differentiation. (C) Quantification of western blots for WT, KLF1+/E325K, and KLF1+/− cells during expansion (day 0) and on days 2, 4, and 6 of differentiation probed with antibody to γH2AX (mean ± SD; n = 3; ∗∗∗P < .001 compared with that for WT), and (D) representative example of γH2AX western blot, with β-actin as loading control. (E) Western blots of WT, KLF1+/E325K, and KLF1+/− cells on day 2 of differentiation probed with antibodies to RAD51, SIRT6, DROSHA, and to β-actin as a loading control. Each blot is representative of 3 biological repeats. (F) Z-scored scaled abundance values for proteins associated with DNA repair (GO:0006281) in WT and KLF1+/E325K cells on day 2 of differentiation. (G) Heat maps of z-scored abundance values for exocyst complex and (H) kinesin superfamily (KIF) proteins in WT and KLF1+/E325K cells on day 2 of differentiation. (I) Z-scored scaled abundance values for proteins associated with vesicle tethering complex (GO:0099023) in WT and KLF1+/E325K cells on day 2 of differentiation. (J) (i) Heat maps of z-scored abundance values for TMED proteins in WT and KLF1+/E325K cells on day 2 of differentiation (n = 3) and (ii) western blot for the selected TMED, TMED10. For heat maps, each box represents 1 biological repeat (total n = 3).
Extensive dysregulation of proteins required for cell cycle and associated processes, DNA repair, and membrane trafficking in KLF1+/E325K cells. (A) Z-scored scaled abundance values for proteins associated with cell cycle (Gene Ontology database GO:0007049) and (B) chromosome segregation (GO:0098813) in WT and KLF1+/E325K cells on day 2 of differentiation. (C) Quantification of western blots for WT, KLF1+/E325K, and KLF1+/− cells during expansion (day 0) and on days 2, 4, and 6 of differentiation probed with antibody to γH2AX (mean ± SD; n = 3; ∗∗∗P < .001 compared with that for WT), and (D) representative example of γH2AX western blot, with β-actin as loading control. (E) Western blots of WT, KLF1+/E325K, and KLF1+/− cells on day 2 of differentiation probed with antibodies to RAD51, SIRT6, DROSHA, and to β-actin as a loading control. Each blot is representative of 3 biological repeats. (F) Z-scored scaled abundance values for proteins associated with DNA repair (GO:0006281) in WT and KLF1+/E325K cells on day 2 of differentiation. (G) Heat maps of z-scored abundance values for exocyst complex and (H) kinesin superfamily (KIF) proteins in WT and KLF1+/E325K cells on day 2 of differentiation. (I) Z-scored scaled abundance values for proteins associated with vesicle tethering complex (GO:0099023) in WT and KLF1+/E325K cells on day 2 of differentiation. (J) (i) Heat maps of z-scored abundance values for TMED proteins in WT and KLF1+/E325K cells on day 2 of differentiation (n = 3) and (ii) western blot for the selected TMED, TMED10. For heat maps, each box represents 1 biological repeat (total n = 3).
Errors in chromosome segregation can result in the formation of chromatin bridges.46 The average abundance of proteins associated with chromosome segregation was significantly lower in KLF1+/E325K than in WT cells (Figure 5B). Compounding this, the homology-directed repair pathway is also dysregulated (Figure 4C), defects of which result in chromatin segregation errors and thus chromatin bridges.47 Defective chromosome segregation is also associated with increased DNA double-strand breaks48 (DSBs). In accordance, increased phosphorylation of histone H2AX (γH2AX), a marker of DSB induction,49 was detected in KLF1+/E325K cells (Figure 5C-D), with highest levels on days 2 and 4 of differentiation correlating with increased cell death at these times. There was no significant increase in γH2AX in KLF1+/− cells (Figure 5C-D). The increased DNA damage is no doubt further exacerbated by downregulation of the DSB repair pathway (Figure 4C), with the persistence of such DNA lesions resulting in apoptosis. Decreased levels of key proteins in this pathway in KLF1+/E325K cells are shown in Figure 5E. Additional DNA repair and associated pathways are also downregulated in KLF1+/E325K cells (Figure 4C), with a significant reduction in the average abundance of all DNA repair proteins detected (Figure 5F), which may further exacerbate cell death.
The presence of bi/multinucleate KLF1+/E325K and cells from patients with CDA IV is indicative of a cytokinesis defect. All proteins of the exocyst complex required for cytokinesis are decreased in KLF1+/E325K cells (Figure 5G). Notably, knockdown of any exocyst complex protein in HeLa cells50,51 results in binucleate cells, providing a causal link. In addition, 3 of the 4 kinesins (KIF4A, KIF4B, KIF23, and KIF20A) required for cytokinesis52 were detected and significantly decreased in KLF1+/E325K cells (Figure 5H), adding further potential disruption to this process. Of note, mutations in KIF23, a KLF1 target gene,6 cause CDA III, characterized by multinuclearity.53
Also of relevance, FANCI and FANCD2, key effectors of the Fanconi anemia pathway, are significantly decreased in KLF1+/E325K cells (34% and 21%, respectively), with deficiency resulting in chromatin bridges and associated with cytokinesis failure and binucleated cells.54
Downregulation of membrane trafficking processes rationalizes membrane abnormalities and increased fragility of CDA IV cells
Membrane structure and stability are influenced by a variety of factors, including membrane composition, stabilization by the underlying cytoskeleton, and the regulated transport of proteins to and from the membrane. Several structural membrane and cytoskeletal proteins, including some known KLF1 target genes,2,3 are significantly decreased in KLF1+/E325K cells (supplemental Figure 8A). In addition, pathways for various aspects of membrane trafficking were significantly downregulated (Figure 4D). Correspondingly, proteins of the exocyst complex (Figure 5G), important in vesicle trafficking to the plasma membrane,55 and vesicle tethering complexes in general (Figure 5I), were significantly decreased. Nine of the 10 transmembrane emp24 domain-containing protein (TMED) family members (Figure 5J), regulators of protein transport,56 were identified, with 8 significantly increased; twenty-six kinesins, key players in intracellular transport systems,57 were dysregulated (Figure 5H). Disrupting the balance of complexes that deliver proteins to the cell membrane, along with decreased levels of structural proteins, undoubtedly contributes to the observed structural defects.
Downregulation of global transcription and mRNA processing contributes to a disordered proteome
In line with a previously reported role for KLF1 in some aspects of transcriptional regulation and RNA splicing,6 we found downregulated pathways for multiple processes governing transcription by RNA polymerase I, II, and III and for posttranscriptional mRNA processing (Figure 4E-F; supplemental Figure 9A). Decreased levels of proteins involved in such processes and, thus, the overall dysregulation of transcription, likely contributes to the radical alteration in the proteome of KLF1+/E325K cells and thus dysregulated intracellular processes. In addition, CDK9, a KLF1 target gene1 critical for RNA polymerase II transcription initiation, elongation, and termination,58,59 is significantly decreased in KLF1+/E325K cells (supplemental Figure 8A).
Increased mitochondrial biogenesis and processes further augment impairment of cell cycle and differentiation and increase apoptosis
The majority of overrepresented pathways revealed from analysis of proteins increased in KLF1+/E325K cells on both day 0 and day 2 govern mitochondrial processes (Figure 4G; supplemental Figure 9B). Analysis of the data sets using the Human Cell Atlas (https://www.humancellatlas.org/) revealed 374 mitochondrial proteins significantly increased in level in KLF1+/E325K cells on day 2, and GO detected 1014 mitochondrial proteins with an average abundance significantly increased compared with that in WT cells (Figure 6Ai). Proteins significantly increased included components of respiratory complex I, II, III, and IV, adenosine triphosphate synthase, and the mitochondrial contact site and cristae organizing system (MICOS) complex (Figure 6B; supplemental Figure 10 for days 0 and 2). The average abundance value for all respiratory electron transport chain (ETC) entities detected was also significantly increased (Figure 6Aii). Of the 13 proteins encoded by the mitochondrial genome, 9 were identified in our data set and significantly increased (Figure 6C). In addition, mitochondrial transcription factor complex components TFAM, TFB2M, and TEFM were increased (Figure 6D), with TFAM also involved in the replication of the mitochondrial genome. In relation, POLγA and B, catalytic and accessory subunits of the mitochondrial DNA polymerase POLγ, were increased (Figure 6E).

Mitochondrial functional and regulatory proteins and markers of mitochondrial biogenesis are increased in KLF1+/E325K cells. (A) Z-scored scaled abundance values for (i) mitochondrial proteins (GO:0005739) and (ii) proteins of the respiratory electron transport chain (GO:0022904) in WT and KLF1+/E325K cells. (B) Heat maps of z-scored abundance values for respiratory complex I, II, III, and IV, adenosine triphosphate synthase, and MICOS complex proteins in WT and KLF1+/E325K cells. Each box represents 1 biological repeat (total n = 3). (C) Scaled abundance of proteins encoded by the mitochondrial genome, (D) mitochondrial transcription factor complex components, and (E) catalytic/accessory subunits of mitochondrial DNA polymerase. All mean ± SD; n = 3; ∗P < .05, ∗∗P < .01, and ∗∗∗P < .001 compared with that for WT. (F) Markers of mitochondrial biogenesis: (i) cardiolipin concentration, (ii) mitochondrial-to-nuclear DNA ratio (determined via the qPCR analysis of mitochondrial genes ND1 and TL1, nuclear gene MSGN1 and an intergenic region; for primers, see Supplementary Table 3) in WT, KLF1+/E325K, and KLF1+/−cells, and (iii) scaled abundance of citrate synthase in WT and KLF1+/E325K cells. (G) Scaled abundance of mitochondrial inner membrane scaffolding protein, PHB2; mean ± SD, n = 3; ∗∗∗P < .001 compared with WT. (H) Scaled abundance of phosphatase and tensin homolog (PTEN). Abundance values were from WT and KLF1+/E325K day 2 of differentiation comparative proteomic data set.
Mitochondrial functional and regulatory proteins and markers of mitochondrial biogenesis are increased in KLF1+/E325K cells. (A) Z-scored scaled abundance values for (i) mitochondrial proteins (GO:0005739) and (ii) proteins of the respiratory electron transport chain (GO:0022904) in WT and KLF1+/E325K cells. (B) Heat maps of z-scored abundance values for respiratory complex I, II, III, and IV, adenosine triphosphate synthase, and MICOS complex proteins in WT and KLF1+/E325K cells. Each box represents 1 biological repeat (total n = 3). (C) Scaled abundance of proteins encoded by the mitochondrial genome, (D) mitochondrial transcription factor complex components, and (E) catalytic/accessory subunits of mitochondrial DNA polymerase. All mean ± SD; n = 3; ∗P < .05, ∗∗P < .01, and ∗∗∗P < .001 compared with that for WT. (F) Markers of mitochondrial biogenesis: (i) cardiolipin concentration, (ii) mitochondrial-to-nuclear DNA ratio (determined via the qPCR analysis of mitochondrial genes ND1 and TL1, nuclear gene MSGN1 and an intergenic region; for primers, see Supplementary Table 3) in WT, KLF1+/E325K, and KLF1+/−cells, and (iii) scaled abundance of citrate synthase in WT and KLF1+/E325K cells. (G) Scaled abundance of mitochondrial inner membrane scaffolding protein, PHB2; mean ± SD, n = 3; ∗∗∗P < .001 compared with WT. (H) Scaled abundance of phosphatase and tensin homolog (PTEN). Abundance values were from WT and KLF1+/E325K day 2 of differentiation comparative proteomic data set.
The data indicate increased mitochondrial biogenesis, which is associated with impaired cell cycle and erythroid differentiation, and increased apoptosis.60 To confirm this, we analyzed markers of mitochondrial content61: cardiolipin, mitochondria-to-nuclear DNA ratio, citrate synthase (Figure 6F), and complex II (SDHB) and V (ATP5F1A) (Figure 6B). All were significantly increased compared with the levels in WT cells. In relation to increased levels of cardiolipin (marker of cristae formation) and MICOS complex components, the level of prohibitin-2, which plays a critical scaffolding role at the inner mitochondrial membrane, was also significantly increased (Figure 6G).
Finally, analysis of the proteome of KLF1+/E325KC2 showed same temporal dysregulated biological processes as that of KLF1+/E325K (supplemental Figure 11), with confirmation of selection of the aforementioned proteins shown in supplemental Figure 5.
Higher total KLF1 activity in small population of KLF1+/E325K cells may afford survival advantage
As observed (Figure 1I; supplemental Figure 2A,C), ∼14% of the KLF1+/E325K population survives and differentiates into orthochromatic erythroblasts, although only a small proportion enucleates. To determine how this population survives, we isolated the top 30% of cells with the highest band 3 levels (band 3Hi) and the 30% with the lowest band 3 levels (band 3Lo) on day 2 of differentiation and returned these cells to the culture.
We first confirmed that the band 3Hi cells retained the heterozygous G973A mutation (supplemental Figure 12). The band 3Hi population had significantly improved expansion during differentiation compared with the KLF1+/E325K and band 3Lo populations, the latter significantly lower than KLF1+/E325K cells, confirming the selection of cells with the most extreme phenotypes within the mixed population (Figure 7A). However, the expansion capacity of band 3Hi was still lower than that of WT cells (see Figure 1D for comparison). Nonetheless, band 3Hi cells differentiated at a rate similar to that of WT cells, reaching the orthochromatic erythroblast stage, but few (∼2%) enucleated (Figure 7B), whereas there was substantial cell death in the band 3Lo population with few cells differentiating beyond basophilic erythroblasts. In contrast to KLF1+/E325K and band 3Lo, the band 3Hi population did not exhibit increased DNA lesions (Figure 7C) and, in accordance, had lower levels of apoptosis (Figure 7D). The membranes of band3Hi cells also appeared normal, whereas band3Lo cells exhibited marked membrane blebbing (Figure 7E).
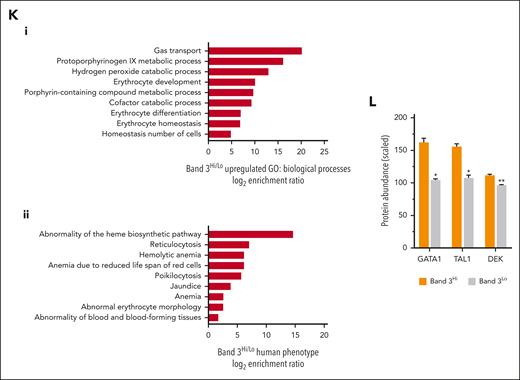
Higher total KLF1 activity reduces defects and confers survival advantage to a small population of KLF1+/E325K cells. The 30% of cells with highest band 3 level (band 3Hi) and the 30% with lowest band 3 level (band 3Lo) within the KLF1+/E325K cell population were isolated on day 2 of differentiation via fluorescence activated cell sorting, and returned to culture for further differentiation. (A) Cumulative fold expansion of differentiating KLF1+/E325K, band 3Hi, and band 3Lo cells on days 2, 4, 6, 8, 10, and 12 of differentiation (mean ± SD; n = 3; ∗P < .05, ∗∗P < .01, ∗∗∗P < .01 compared with that of KLF1+/E325K). (B) Percentage of erythroid cell types in WT, band 3Hi, and band 3Lo cultures during expansion (day 0) and on days 2, 4, 6, 8, and 10 of differentiation, analyzed after staining with May-Grünwald Giemsa (mean ± SD; n = 3; >100 cells counted per sample). (C) Western blots of WT, KLF1+/E325K, band 3Hi, and band 3Lo cells on day 2 of differentiation probed with antibodies to γH2AX and KLF1, and to β-actin as a loading control. Representative of 3 biological repeats. (D) Flow cytometry histogram of annexin V-FITC abundance in band 3Hi (blue) and band 3Lo (red) populations within KLF1+/E325K population on day 2 of differentiation. Representative of 3 biological repeats. (E) Images of sorted band 3Hi and band 3Lo KLF1+/E325K cells on day 2 of differentiation stained with May-Grünwald Giemsa stain. Original magnification ×400. Scale bar, 20 μm. Red arrows indicate apoptotic cells with fragmented or lobulated nuclei. Black arrows indicate cells with membrane blebbing. (F) PCA of comparative quantitative proteomic data for WT (red), KLF1+/E325K (blue), band 3Hi (yellow), and band 3Lo (gray) cells on day 2 of differentiation. (G) Scaled abundance of dematin (DMTN), α-spectrin (SPTA1), β-spectrin (SPTB), E2F4 and protein 4.2 (EBP42), and (H) band 3, α4-integrin (ITGA4), glycophorin A (GPA) and CD36 in WT, band 3Hi, and band 3Lo cells on day 2 of differentiation. (I) Scaled abundance of CD44 and intercellular adhesion molecule 4 (ICAM4) in WT and band 3Hi cells on day 2 of differentiation. All mean ± SD; n = 3; ∗P < .05, ∗∗P < .01, and ∗∗∗P < .01 compared with that of WT. (J) Western blots of WT, KLF1+/E325K, and band 3Hi cells probed with antibodies to β-, γ-, and α-globins, with β-actin as a loading control. Each blot is representative of 3 biological repeats. (K) WebGestalt functional enrichment analyses comparing band 3Hi with band 3Lo cells on day 2 of differentiation. Overrepresentation analysis for enriched gene ontology in (i) biological processes and (ii) human phenotype. (L) Scaled abundance of GATA1, TAL1, and DEK in band 3Hi and band 3Lo cells on day 2 of differentiation. Mean ± SD; n = 3; ∗P < .05; ∗∗P < .01.
Comparative proteomic analysis of band 3Hi, band 3Lo, and WT cells showed the total level of KLF1 in band 3Hi cells on day 2 of differentiation was not significantly different from that of WT cells, confirmed by western blot (Figure 7C), which might have resulted in more optimal KLF1 activity. In concord, PCA showed the proteome of band 3Hi cells to be in closer alignment to that of WT than that of KLF1+/E325K and band 3Lo cells (Figure 7F). In addition, the abundance of proteins from KLF1-regulated genes was also higher in the band 3Hi compared with band 3Lo population (Figure 7G). Consistent with the flow cytometry data (supplemental Figure 2C), the abundance of glycophorin A, α4-integrin, and CD36 was lower in band 3Lo than band 3Hi cells (Figure 7H). Notwithstanding, band 3Hi cells still exhibited some hallmarks of CDA IV erythroid cells: decreased levels of CD44 and ICAM 4 (Figure 7I), decreased β-globin, and increased γ- (Figure 7J), ε-, and ζ-globin compared with WT cells.
GO analysis of the proteins decreased in band 3Lo compared with band 3Hi cells revealed overrepresented pathways governing key erythroid processes (Figure 7K), in line with the survival advantage of the band 3Hi cells. Other characteristics of patients with CDA IV including jaundice caused by increased RBC lysis and poikilocytosis (Figure 7K) were also represented, further confirming the relevance of the line.
Overall, the data provide rationale for the occurrence of late-stage erythroid cells in patients with CDA IV because of the selection of cells with higher than usual WT KLF1 levels, possibly driven by significantly increased levels of GATA1, TAL1, and DEK (Figure 7L), regulators of KLF1 expression.
Discussion
Here, we demonstrate the feasibility and power of creating a human cellular model system of a RBC disease that accurately recapitulates the disease phenotype, enabling extensive interrogation to identify the underlying molecular defects.
In-depth analysis of the proteome of KLF1+/E325K compared with WT and KLF1+/− cells revealed extensive distortion with aberrant levels of large numbers of proteins. This results in a wide range of disordered biological pathways, along with synergy of discrete pathways, which collectively contribute to the defined phenotypic abnormalities of CDA IV cells. The diversity of affected processes explains the spectrum of CDA IV abnormalities and impairment in erythroid cell development and survival. Of note, the pathways were not revealed when analyzing significantly dysregulated transcripts, highlighting the importance of the proteome for understanding the basis of the phenotype.
E325K KLF1 does not, however, act as a normal dominant-negative inhibitor. Instead, it has decreased affinity for KLF1 DNA-binding motifs,14,40,41 interfering with WT KLF1 activity14,40 (supplemental Figure 8C). This explains the decreased level of many KLF1-regulated genes to below that caused by KLF1 haploinsufficiency, the signature feature of KLF1+/− cells. Indeed, the genes for ∼19% of the proteins that were significantly lower in KLF1+/E325K than in KLF1+/− cells had a KLF1 peak in a human KLF1 chromatin immunoprecipitation sequencing (ChiPseq) data set62; additional proteins decreased because of downstream effects.
Impeded WT KLF1 DNA-binding may also contribute to the striking increase in HbF in cells of patients with CDA IV and KLF1+/E325K cells, causing reduced interaction of HBB gene with the locus control region (LCR), augmented by reduced levels of γ-globin repressors. KLF1 has been shown to mediate this interaction, with reduced KLF1 resulting in decreased interaction of HBB and increased interaction of HBG genes with the LCR, and thus γ-globin levels.63,64 Little is known about the regulation of embryonic globins, although KLF1 has been indirectly implicated.65 Reduced levels of KLF1-target, potential embryonic globin repressors BCL11A, KLF3, NFE2, and POGZ65-67 in KLF1+/E325K cells (supplemental Figure 4) may partly explain the increase in embryonic globins. However, globin regulators that are yet to be identified may be affected among the extensive dysregulated KLF1+/E325K proteome.
Many proteins were also increased in KLF1+/E325K cells, undoubtedly, partly because of the reduced expression of repressors or increased levels of alternative activators. Genes of only 13% of the significantly increased proteins had KLF1 peaks in the KLF1 ChIPseq data set, revealing the magnitude of downstream effects. Notwithstanding, ectopic gene expression has been reported from RNA sequencing of cultured cells from patients with CDA IV30 and from in vitro studies of E325K KLF1,41,68 attributed to altered DNA-binding specificity of E325K KLF1.41,68 We were not able to ascertain ectopic expression in our proteomic data set because of the TMT technology used. However, a small number (102) of potentially ectopic genes were identified in our RNAseq data set, of which, 83 are protein-coding genes. Of these, 5 were found in an independent label-free normal erythroid cell proteomic data set,37 so are not ectopic. Of the remaining 78, 13 were identified in our proteomic data set, of which 11 were significantly increased in KLF1+/E325K cells and may therefore be ectopic. The protein products of ectopic transcripts not detected in KLF1+/E325K cells may be due to failed detection via mass spectrometry, or they may be recognized as aberrant and therefore not translated by cells.
Analysis of KLF1+/E325K cells also revealed novel information on KLF1 itself. Identified pathways previously associated with KLF1 regulation have been assigned largely based on the identification of small numbers of individual proteins. In contrast, our data reveal extensive involvement of KLF1 in multiple aspects of such processes, with dysregulation of substantial numbers of associated proteins in the KLF1+/E325K cells. In addition, we reveal a role for KLF1 in the regulation of intracellular processes in erythroid cells not previously attributed to this transcription factor: DNA repair, protein trafficking, chromatin segregation, and mitochondrial biogenesis and function. Indeed, genes of ∼20% of all significantly dysregulated proteins in KLF1+/E325K cells had a KLF1 peak in the KLF1-ChIPseq data set. Analysis of just these KLF1-regulated proteins using Reactome revealed significant enrichment of the same dysregulated pathways as found when all significantly dysregulated proteins were analyzed, supporting a direct role for KLF1 in these processes (examples in supplemental Table 4).
The unexpected finding of potential altered mitochondrial biogenesis in KLF1+/E325K cells and thus the role of KLF1 in coordinating this process is corroborated by the recent finding of injury-induced KLF1 expression in zebrafish cardiomyocytes, whereby increased levels of KLF1 resulted in decreased mitochondrial biogenesis and function.69 The reduced expression of mitochondrial genes, DNA content, and cristae after overexpression of KLF1 inversely correlates with their increase in KLF1+/E325K cells. PTEN, knockdown of which increases mitochondrial mass and impairs erythroid differentiation,60 was significantly reduced in KLF1+/E325K cells (Figure 6H). Such regulation by KLF1 is likely multifactorial and largely indirect, although we identified KLF1 peaks in genes for 9 proteins of the trichloroacetic acid cycle and ETC in the KLF1 ChIPseq data set. Possibly, contributing, autophagy pathways are also downregulated in KLF1+/E325K cells (Figure 4H), which may lead to the retention of dysfunctional mitochondria.
Since our first identification of the E325K KLF1 mutation in 2009,15 the number of patients diagnosed with the mutation has steadily increased. Our comprehensive map of altered protein levels and processes in CDA IV erythroid cells may facilitate further diagnosis, and in considering this, we identified potential biomarkers (supplemental Figure 14) as well as provided possible avenues for novel therapeutic approaches. Furthermore, KLF1 may be causative in a range of additional hematologic disorders, and the data may reveal overlap with profiles of RBC disorders of unknown etiology, prompting KLF1 screening. In addition, our data showing a single heterozygous mutation to a transcription factor can result in a plethora of disrupted cellular processes may help track the cause of diseases of unknown etiology in other systems.
Acknowledgments
The authors thank Phil Lewis, of the School of Cellular and Molecular Medicine, University of Bristol, Bristol, United Kingdom for assistance with analyzing mass spectrometry data and producing figures; Andrew Herman of the University of Bristol Flow Cytometry Facility for cell sorting and use of equipment, Maurice A. Canham of the Scottish National Blood Transfusion Service, Edinburgh and the Wellcome Trust Clinical Research Facility at the University of Edinburgh, United Kingdom for performing molecular karyotyping; Belinda Singleton of Bristol Institute for Transfusion Sciences, National Health Service Blood and Transplant, Bristol, United Kingdom; and Winnie Lau of School of Biochemistry, University of Bristol, United Kingdom for creating the constructs used for luciferase assay and for setting up the luciferase assay system. IBGRL antibodies were kindly supplied by Jonathan Dixey, IBGRL, Filton, Bristol, United Kingdom. The KLF1 ChIPseq data for human erythroid cells was kindly provided by Avik Choudhuri and Leonard Zon of Stem Cell and Regenerative Biology, Harvard University, Cambridge, MA.
This study was funded by the Medical Research Council (MR/R009341/1) and National Institutes of Health, National Institute of Diabetes and Digestive and Kidney Diseases grant (R01 DK046865).
Authorship
Contribution: I.F.-V. and D.C.J.F. contributed equally to the work; J.F. conceived and supervised the study; J.F., I.F.-V., and D.C.J.F designed the experiments; I.F-V. and D.C.J.F generated the KLF1+/E325K and KLF1+/− cell lines; D.C.J.F. and I.F.-V. conducted the majority of experiments, analyzed data, and prepared figures; J.F. analyzed data; J.J.B. assisted with data analysis and discussion; M.C.W. carried out the globin high-performance liquid chromatography experiments; M.C.W. and K.J.H. performed TMT labeling, mass spectrometry, and data acquisition, and contributed to proteomics analysis; J.F. wrote the manuscript; and D.C.J.F., I.F.-V., and J.J.B. edited the manuscript.
Conflict-of-interest disclosure: The authors declare no competing financial interests.
Correspondence: Jan Frayne, University of Bristol, School of Biochemistry, Life Sciences Building, University Walk, Bristol BS8 1TD, United Kingdom; e-mail: jan.frayne@bristol.ac.uk.

This feature is available to Subscribers Only
Sign In or Create an Account Close Modal