Key Points
GARP-induced activation of TGF-β1 attenuates effector functions of BMNK cells ex vivo.
Pharmacologic inhibition of TGF-β1 signaling restores NK cell−mediated antileukemic responses in leukemia xenograft mouse models.
Abstract
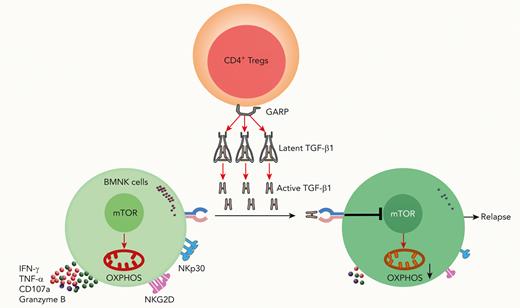
Relapse is a leading cause of death after allogeneic hematopoietic stem cell transplantation (allo-HSCT) for acute myeloid leukemia (AML). However, the underlying mechanisms remain poorly understood. Natural killer (NK) cells play a crucial role in tumor surveillance and cancer immunotherapy, and NK cell dysfunction has been observed in various tumors. Here, we performed ex vivo experiments to systematically characterize the mechanisms underlying the dysfunction of bone marrow−derived NK (BMNK) cells isolated from AML patients experiencing early relapse after allo-HSCT. We demonstrated that higher levels of active transforming growth factor β1 (TGF-β1) were associated with impaired effector function of BMNK cells in these AML patients. TGF-β1 activation was induced by the overexpression of glycoprotein A repetitions predominant on the surface of CD4+ T cells. Active TGF-β1 significantly suppressed mTORC1 activity, mitochondrial oxidative phosphorylation, the proliferation, and cytotoxicity of BMNK cells. Furthermore, pretreatment with the clinical stage TGF-β1 pathway inhibitor, galunisertib, significantly restored mTORC1 activity, mitochondrial homeostasis, and cytotoxicity. Importantly, the blockade of the TGF-β1 signaling improved the antitumor activity of NK cells in a leukemia xenograft mouse model. Thus, our findings reveal a mechanism explaining BMNK cell dysfunction and suggest that targeted inhibition of TGF-β1 signaling may represent a potential therapeutic intervention to improve outcomes in AML patients undergoing allo-HSCT or NK cell−based immunotherapy.
Introduction
Acute myeloid leukemia (AML) is an aggressive hematological malignancy with a higher incidence in older adults, and it has presented challenges for hematologists over the past decades.1,2 Allogeneic hematopoietic stem cell transplantation (allo-HSCT) is an effective therapy and the only curative option for a majority of patients with AML.1,3,4 Even with current treatments, relapse of the original disease after transplantation remains frequent and is associated with particularly poor outcomes.4-7 In particular, after day 100 post-allo-HSCT, relapse becomes a primary cause of death.4,8 However, the underlying mechanism leading to early relapses is poorly understood and requires further investigation.
AML relapse is associated with the ability of AML cells to escape from immune surveillance.7 Natural killer (NK) cells have crucial roles in the immunosurveillance of cancer. Recently, several studies have shown that down-regulation of AML cell killing by NK cells after allo-HSCT may help AML cells to evade immune surveillance.4,9 NK cells are the first reconstituting lymphocytes and may represent up to 80% of peripheral blood lymphocytes during the first 100 days after transplantation.10-14 NK cells kill leukemic cells via the exocytosis of granules containing cytolysis-related proteins such as granzymes, the secretion of effector cytokines such as interferon gamma (IFN-γ), and tumor necrosis factor α (TNF-α).13,15 However, tumor cells often evade NK cell−mediated cytotoxicity and immune surveillance in the tumor microenvironment owing to the action of immunosuppressive factors such as TGF-β1.16-19 Functionally impaired NK cells in AML patients show reduced expression of activating receptors and increased expression of inhibitory receptors.9
TGF-β1 plays an integral role in regulating immune responses and triggers signaling mainly through binding to the TGF-β receptor (TGF-βR) complex. This is composed of 2 type I TGF-β (TGF-βRI, also known as ALK5) and 2 type II TGF-β (TGF-βRII) receptor subunits. Both receptors are serine/threonine kinases.20,21 TGF-β1 is produced as an inactive dimeric complex that undergoes activation and processing before exerting its functional effects.22,23 Glycoprotein-A repetitions predominant (GARP), a type I transmembrane cell surface docking receptor, is abundantly expressed on platelets and regulatory T (Treg) lymphocytes23-26 and regulates activation of latent TGF-β1.24 Active TGF-β1 could inhibit effector functions of NK cells and CD8+ T cells.18,27-30 Blockade of the TGF-β1 pathway has become an attractive approach to restore antitumor immunity.29 Galunisertib is an orally administered small molecule inhibitor of TGF-βR1 kinase. It abrogates the activation of the canonical TGF-β1 pathway by specifically downregulating the phosphorylation of SMAD2. Its ability to inhibit the proliferation of tumor cells was shown in several mouse models.20,31 However, the mechanisms leading to the dysfunction of bone marrow NK (BMNK) cells have not been fully characterized in AML patients. Thus, whether the inhibition of TGF-β1 signaling could restore antitumor activity in patients with relapsing AML remains unclear.
In this study, we performed ex vivo experiments to investigate the mechanisms of TGF-β1 activation in the bone marrow of AML patients who relapse after allo-HSCT. We also investigated the mechanisms by which TGF-β1 induced dysfunction in BMNK cells. Furthermore, we wanted to ascertain whether the in vitro and in vivo antitumor activity of NK cells could be restored by inhibiting TGF-β1 signaling.
Methods
Human samples
Bone marrow mononuclear cells (BMMCs) were isolated from residual bone marrow samples after laboratory tests of AML patients with (n = 20) or without (n = 50) early relapse after allo-HSCT. Early relapse was referred to by relapse within 6 months after achieving complete remission (CR)32 post-allo-HSCT. NK cells applied to in vivo assays were purified from the blood of healthy donors. All human samples used were obtained under the approval of the Ethics Committee of the First Affiliated Hospital of the University of Science and Technology of China (2021-N(H)-120; Hefei, China). Written informed consent was obtained from all patients. The clinical characteristics of patients are shown in supplemental Tables 1-3 (available on the Blood website).
Mice
Female NOD/ShiLtJGpt-Prkdcem26Cd52IL-2rgem26Cd22/Gpt (NCG) mice were purchased from GemPharmatech.33 All animals were kept in specific pathogen-free conditions. All experimental procedures involving mice were carried out as prescribed by the National Guidelines for Animal Usage in Research (China) and were approved by the Ethics Committee of the University of Science and Technology of China (USTCACUC1701038).
Xenograft mouse models and treatment
HL60 cells (5 × 10⁵), labeled with luciferase, were injected into female NCG mice (6 weeks old) via the tail vein to establish a leukemia xenograft model. Tumor formation was confirmed after 1 week, and then 2.5 × 10⁶ NK cells were transfused into each mouse. To support NK cell survival in vivo, each mouse was injected with 50 000 U IL-2 (Jiangsu Kingsley Pharmaceuticals) intraperitoneally every 2 days.34
In the first set of experiments, such tumor-carrying NK cell−infused mice were randomized into 4 groups (n = 6 mice per group). Group 1 received 50 μL phosphate-buffered saline (PBS) by intraperitoneal (IP) injection once weekly (QW). Group 2 received 5 × 10⁵ GARP+CD4+ T cells alone. Group 3 received 50 μL latent TGF-β1, at 5 ng/mL (R&D, Cat# 299-LT; IP, QW), while group 4 received the same dose of latent TGF-β1 in the presence of 5 × 10⁵ GARP+CD4+ T cells.
Galunisertib was obtained from Selleck (Cat# LY2157299) and dissolved in 1% sodium carboxymethyl cellulose (CMC-Na) (as the drug vehicle). During the second set of experiments, the mice were randomized into 6 groups (n = 6 mice per group): Group 1 was administered 50 μL of PBS (IP; QW) and received 150 μL of 1% CMC-Na (oral gavage; twice daily; vehicle control). Group 2 received 5 × 10⁵ GARP+CD4+ T cells alone. Group 3 received 5 × 10⁵ GARP+CD4+ T cells in the presence of 50 μL latent TGF-β1 at 5 ng/mL. Group 4 received 50 μL of active TGF-β1 (R&D, Cat# 240-B) at 5 ng/mL (IP; QW), in combination with 150 μL of 1% CMC-Na. Group 5 received 5 × 10⁵ GARP+CD4+ T cells in the presence of 50 μL latent TGF-β1 at 5 ng/mL and galunisertib at 75 mg/kg twice daily by oral gavage for 21 days.20 Group 6 received 50 μL of active TGF-β1 (5 ng/mL) in combination with galunisertib (75 mg/kg, twice daily) for 21 days.
AML burden was monitored through bioluminescence imaging using the IVIS Spectrum Imaging System (Perkin Elmer) at the indicated time points. Quantitative image data were analyzed using Living Image Software (Perkin Elmer).
Survival analysis
We analyzed the survival rates of 173 AML patients (supplemental Table 4) from the Gene Expression Profiling Interactive Analysis database (http://gepia.cancer-pku.cn).35 The patients were classified into high- and low-risk groups based on the cutoff risk score, and median values were used as cutoffs.34 Kaplan-Meier survival curve analyses were performed, and the significance of overall survival rates was estimated using log-rank tests.
Statistical analysis
We used 2-tailed unpaired or paired t-tests between 2 groups, 1-way analysis of variance (ANOVA) across multiple groups, the Mann-Whitney U test for continuous variables, χ2 and Fisher exact tests for categorical variables, and the Wilcoxon signed rank test. We employed Prism 8 (GraphPad) software to determine statistical significance. Statistical parameters were indicated in the legends of each figure. ∗P < .05; ∗∗P < .01; ∗∗∗P < .001; ∗∗∗∗P < .0001). Data are presented as mean ± standard deviation.
Results
Active TGF-β1 in the bone marrow of patients with relapsed AML
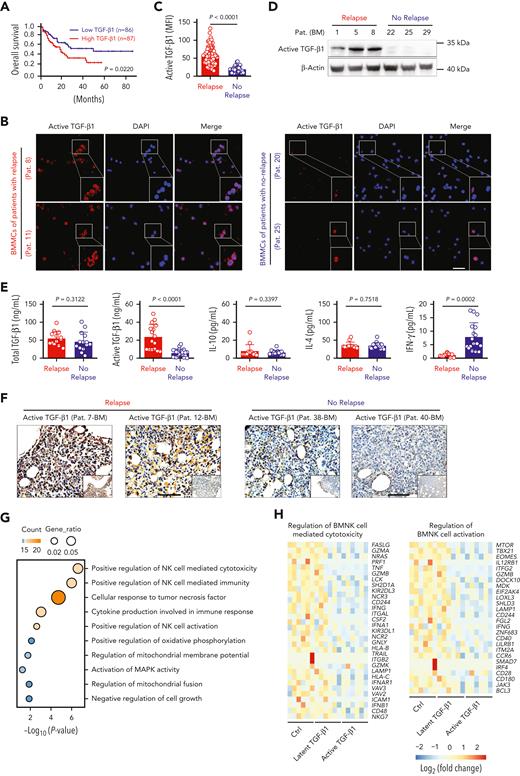
TGF-β1 is one of the most studied cytokines with immunosuppressive effects on various immune cells, including NK cells.14 Recent studies have demonstrated that TGF-β1 causes poor responses to cancer immunotherapy.18 Here, we investigated the role of TGF-β1 in the relapse of AML. Kaplan-Meier survival analysis showed that high expression of TGF-β1 in bone marrow correlated with poorer survival rates in patients with AML, whereas TGF-β2 and TGF-β3 expression levels were not associated with poor outcome (Figure 1A; supplemental Figure 1A-B). Immunofluorescence analysis demonstrated that active TGF-β1 expression was considerably increased in AML patients with early relapse, compared with those with nonrelapsing AML (Figure 1B-C). Western blotting detected a similar difference, with elevated active TGF-β1 levels in the BMMCs of relapsing AML patients (Figure 1D). However, despite these differences in the levels of active TGF-β1, total TGF-β1 levels in the bone marrow did not show statistically significant differences between the 2 groups. Enzyme-linked immunosorbent assay results showed significantly higher levels of active TGF-β1 in the bone marrow of patients with relapsed AML compared with those without relapse (Figure 1E). Next, we performed immunohistochemistry analysis using samples of bone marrow biopsies. Again, significantly higher levels of active TGF-β1 were found in the bone marrow of AML patients with early relapse (Figure 1F).
Active TGF-β1 levels are upregulated significantly in the bone marrow of AML patients with early relapse after allo-HSCT. (A) Kaplan-Meier analyses of overall survival rates of AML patients from the Gene Expression Profiling Interactive Analysis dataset according to TGF-β1 expression levels. High TGF-β1 expression (n = 87); Low TGF-β1 expression (n = 86). Median value was used as the cutoff. P value was calculated by log-rank test. (B) Representative confocal microscopy images showing the levels of active TGF-β1 in BMMCs isolated from AML patients with early relapse (left) or without relapse (right) after allo-HSCT. Scale bar, 50 μm. (C) Mean fluorescence intensity (MFI) of active TGF-β1 in randomly selected single BMMCs from AML patients with early relapse (red; n = 5 patients) or without relapse (blue; n = 7 patients). Each dot represents MFI of active TGF-β1 in a single cell of the 2 groups; the number of cells were 65 and 31, respectively. (D) Western blotting analysis showing the levels of active TGF-β1 in the BMMCs of AML patients with early relapse (n = 3) or without relapse (n = 3). (E) ELISA or cytometric bead array results showing the levels of total TGF-β1, active TGF-β1, interleukin (IL)-10, IL-4, and IFN-γ in the bone marrow of AML patients with early relapse (n = 16) or without relapse (n = 22). (F) Representative immunohistochemistry images showing the staining intensity for active TGF-β1 in bone marrow biopsy samples from AML patients with early relapse or without relapse. Scale bars, 100 μm. (G) Functional enrichment analyses of differentially expressed genes between control and active TGF-β1-treated NK cells indicating the most enriched biological processes. (H) Heat maps show normalized expression levels of genes regulating NK cell-mediated cytotoxicity (left) and NK cell activation (right) in purified BMNK cells pretreated with dimethyl sulfoxide (solvent control), latent TGF-β1 (10 ng/mL), or active TGF-β1 (10 ng/mL). Each column depicts 1 sample. The data in C and E were analyzed by 2-tailed unpaired t-test; ∗P < .05; ∗∗P < .01; ∗∗∗P < .001; ∗∗∗∗P < .0001. Data are represented as means ± standard deviation.
Active TGF-β1 levels are upregulated significantly in the bone marrow of AML patients with early relapse after allo-HSCT. (A) Kaplan-Meier analyses of overall survival rates of AML patients from the Gene Expression Profiling Interactive Analysis dataset according to TGF-β1 expression levels. High TGF-β1 expression (n = 87); Low TGF-β1 expression (n = 86). Median value was used as the cutoff. P value was calculated by log-rank test. (B) Representative confocal microscopy images showing the levels of active TGF-β1 in BMMCs isolated from AML patients with early relapse (left) or without relapse (right) after allo-HSCT. Scale bar, 50 μm. (C) Mean fluorescence intensity (MFI) of active TGF-β1 in randomly selected single BMMCs from AML patients with early relapse (red; n = 5 patients) or without relapse (blue; n = 7 patients). Each dot represents MFI of active TGF-β1 in a single cell of the 2 groups; the number of cells were 65 and 31, respectively. (D) Western blotting analysis showing the levels of active TGF-β1 in the BMMCs of AML patients with early relapse (n = 3) or without relapse (n = 3). (E) ELISA or cytometric bead array results showing the levels of total TGF-β1, active TGF-β1, interleukin (IL)-10, IL-4, and IFN-γ in the bone marrow of AML patients with early relapse (n = 16) or without relapse (n = 22). (F) Representative immunohistochemistry images showing the staining intensity for active TGF-β1 in bone marrow biopsy samples from AML patients with early relapse or without relapse. Scale bars, 100 μm. (G) Functional enrichment analyses of differentially expressed genes between control and active TGF-β1-treated NK cells indicating the most enriched biological processes. (H) Heat maps show normalized expression levels of genes regulating NK cell-mediated cytotoxicity (left) and NK cell activation (right) in purified BMNK cells pretreated with dimethyl sulfoxide (solvent control), latent TGF-β1 (10 ng/mL), or active TGF-β1 (10 ng/mL). Each column depicts 1 sample. The data in C and E were analyzed by 2-tailed unpaired t-test; ∗P < .05; ∗∗P < .01; ∗∗∗P < .001; ∗∗∗∗P < .0001. Data are represented as means ± standard deviation.
TGF-β1 inhibits host immunosurveillance mechanisms.36,37 Therefore, we investigated whether the increased activity of TGF-β1 contributed to the dysfunction of BMNK cells. BMNK cells were isolated from patients who did not relapse after allo-HSCT and stimulated with either latent or active TGF-β1, and whole-genome transcriptome microarray analysis was performed on these samples. Functional enrichment analyses of the differentially expressed genes, using the Gene Ontology (GO) database demonstrated significant changes in the genes that regulated NK cell‒mediated cytotoxicity and NK cell activation in cells treated with active TGF-β1 (Figure 1G). Moreover, gene set enrichment analyses (GSEA) showed reduced expression of genes regulating NK cell‒mediated cytotoxicity and NK cell activation in cells treated with active TGF-β1 (supplemental Figure 1C-D). We then compared the differentially expressed genes related to the regulation of NK cell‒mediated cytotoxicity and activation of NK cells. The results showed downregulation of GZMB, GZMA, TNF, NCR3, TBX21, and MTOR in the NK cells stimulated with active TGF-β1 compared with those stimulated with latent TGF-β1 or unstimulated controls (Figure 1H). These results suggested that higher active TGF-β1 levels in the bone marrow microenvironment could be responsible for the suppressed effector function of NK cells in AML patients with early relapse.
Active TGF-β1 impairs the effector function of BMNK cells
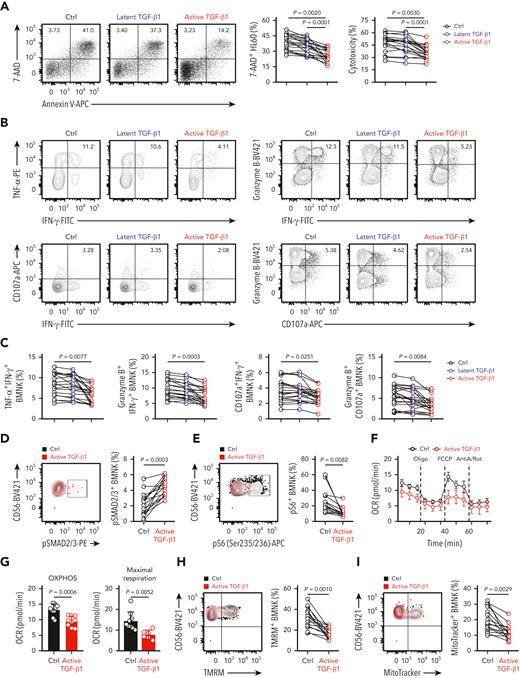
We then performed experiments to determine whether active TGF-β1 suppressed the effector function of BMNK cells. The coculture experiments with HL60 target cells showed reduced cytotoxicity of BMNK cells stimulated with active TGF-β1 compared with that of BMNK cells stimulated with latent TGF-β1 (Figure 2A). In addition, the proportion of polyfunctional effector NK cells, including TNF-α+IFN-γ+ NK cells, granzyme B+IFN-γ+ NK cells, CD107a+IFN-γ+ NK cells, and granzyme B+CD107a+ NK cells, were significantly reduced when BMNK cells were stimulated with active rather than latent TGF-β1 (Figure 2B-C). Furthermore, NKG2D expression was also significantly reduced in BMNK cells treated with active TGF-β1 (supplemental Figure 2A-B).
Active TGF-β1 inhibits effector function, mTORC1 activity, and mitochondrial respiration of bone marrow−derived NK cells ex vivo. (A) Flow cytometry analysis showing the percentage of 7-AAD+ HL60 cells (target cells) when cocultured for 5 hours with control (dimethyl sulfoxide) NK cells, 10 ng/mL latent TGF-β1-treated NK cells, and 10 ng/mL active TGF-β1-treated NK cells to estimate cytotoxicity. NK cells: target cells ratio = 5:1; n = 20. (B-C) Flow cytometry data indicating the proportion of IFN-γ+TNF-α+ NK cells, IFN-γ+granzyme B+ NK cells, IFN-γ+ CD107a+ NK cells, and granzyme B+ CD107a+ NK cells within the total population of control NK cells, latent TGF-β1-treated NK cells, and active TGF-β1-treated NK cells that were cocultured with HL60 cells for 5 h. n = 20. (D-E) Flow cytometry analysis showing the proportion of (D) pSMAD2/3+ and (E) pS6+ NK cell populations in the control (black) and active TGF-β1-treated (red) BMNK cells. n = 15. (F-G) Oxygen consumption rates (OCRs) of control and active TGF-β1-stimulated NK cells under basal conditions and in response to oligomycin (Oligo), the mitochondrial decoupler FCCP, and rotenone + antimycin (R + A). (G) Estimation of OCR values (OXPHOS activity) under basal conditions (left) and maximum respiration rates after FCCP uncoupling (right). OCRs were analyzed for 9 donors per group. (H-I) Flow cytometry analysis indicating the proportion of (H) tetramethylrhodamine methyl ester+ and (I) MitoTracker Green+ NK cells in the control (black) and active TGF-β1-treated (red) groups of BMNK cells. n = 15. Data were analyzed by 1-way analysis of variance with Tukey multiple comparisons test (A,C) or 2-tailed paired t-test (E, I); ∗P < .05; ∗∗P < .01; ∗∗∗P < .001; ∗∗∗∗P < .0001. The data are represented as means ± standard deviation.
Active TGF-β1 inhibits effector function, mTORC1 activity, and mitochondrial respiration of bone marrow−derived NK cells ex vivo. (A) Flow cytometry analysis showing the percentage of 7-AAD+ HL60 cells (target cells) when cocultured for 5 hours with control (dimethyl sulfoxide) NK cells, 10 ng/mL latent TGF-β1-treated NK cells, and 10 ng/mL active TGF-β1-treated NK cells to estimate cytotoxicity. NK cells: target cells ratio = 5:1; n = 20. (B-C) Flow cytometry data indicating the proportion of IFN-γ+TNF-α+ NK cells, IFN-γ+granzyme B+ NK cells, IFN-γ+ CD107a+ NK cells, and granzyme B+ CD107a+ NK cells within the total population of control NK cells, latent TGF-β1-treated NK cells, and active TGF-β1-treated NK cells that were cocultured with HL60 cells for 5 h. n = 20. (D-E) Flow cytometry analysis showing the proportion of (D) pSMAD2/3+ and (E) pS6+ NK cell populations in the control (black) and active TGF-β1-treated (red) BMNK cells. n = 15. (F-G) Oxygen consumption rates (OCRs) of control and active TGF-β1-stimulated NK cells under basal conditions and in response to oligomycin (Oligo), the mitochondrial decoupler FCCP, and rotenone + antimycin (R + A). (G) Estimation of OCR values (OXPHOS activity) under basal conditions (left) and maximum respiration rates after FCCP uncoupling (right). OCRs were analyzed for 9 donors per group. (H-I) Flow cytometry analysis indicating the proportion of (H) tetramethylrhodamine methyl ester+ and (I) MitoTracker Green+ NK cells in the control (black) and active TGF-β1-treated (red) groups of BMNK cells. n = 15. Data were analyzed by 1-way analysis of variance with Tukey multiple comparisons test (A,C) or 2-tailed paired t-test (E, I); ∗P < .05; ∗∗P < .01; ∗∗∗P < .001; ∗∗∗∗P < .0001. The data are represented as means ± standard deviation.
The Smad2/3-dependent signaling axis is referred to as the canonical signaling pathway of TGF-β1.38 Flow cytometry analysis showed that stimulation of BMNK cells with active TGF-β1 resulted in a higher proportion of pSmad2/3+ NK cells, thereby suggesting increased activation of Smad2/3 (Figure 2D-E). Viel et al38 reported that TGF-β1 inhibited both the activation and effector function of NK cells by repressing the mammalian target of rapamycin (mTOR) signaling pathway. mTOR activity is an important regulator of metabolism in NK cells and can be measured by estimating the expression of phosphorylated S6 ribosomal protein (pS6).34 As the expression of pS6 was significantly reduced in NK cells stimulated with active TGF-β1 in our experiments (Figure 2D-E), it was likely that active TGF-β1 inhibited the activation of BMNK cells via suppressing mTOR activity.
Abnormal glucose metabolism suppresses the normal effector functions of human NK cells.36,39,40 Therefore, we examined the metabolic output of BMNK cells using the Seahorse XF Cell Mito Stress Test Kit.34 BMNK cells pretreated with active TGF-β1 demonstrated a reduced oxygen consumption rate, an indicator of oxidative phosphorylation (OXPHOS), compared with that in the control NK cells in the basal state (Figure 2F-G). Maximum respiratory capacity of the mitochondria represents the maximum adenosine triphosphate−generating ability of the mitochondria under conditions of high energy demand and is essential for cellular functions.34,41 We tested the maximum respiratory capacity of active TGF-β1 treated and control NK cells by using the mitochondrial decoupler, carbonylcyanide-4-(trifluoromethoxy) phenylhydrazone (FCCP). Treatment with active TGF-β1 significantly reduced maximum respiratory capacity relative to that seen in control NK cells (Figure 2F-G). Mitochondrial membrane potential can be analyzed by staining cells with the mitochondrial membrane potential−sensitive dye, tetramethylrhodamine methyl ester (TMRM).34 TMRM staining was significantly decreased in NK cells treated with active TGF-β1 compared with that in the control NK cells (Figure 2H). MitoTracker Green staining also showed that this decrease coincided with a significantly reduced mitochondrial mass (Figure 2I). Flow cytometry analysis, using the Ki-67 antibody, showed that proliferation of NK cells treated with active TGF-β1 was significantly reduced (supplemental Figure 2C). However, Annexin V/7-AAD staining demonstrated that the rate of apoptosis did not differ between control NK cells and those treated with active TGF-β1 (supplemental Figure 2D). Taken together, these results showed that active TGF-β1 impairs the effector function, proliferation, mTORC1 activity, and mitochondrial respiration of BMNK cells.
GARP expressed on the surface of CD4+ T cells activates TGF-β1
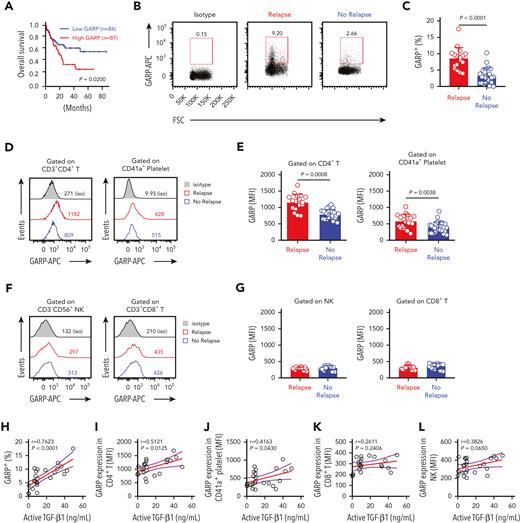
GARP could regulate the bioavailability and activation of latent TGF-β1.24 Next, we analyzed the role of GARP in the activation of TGF-β1 in the context of AML survival. A Kaplan-Meier analysis showed that overall survival of AML patients with high GARP expression was significantly lower than patients with low GARP expression (Figure 3A). The overexpression of GARP was associated with a poor prognosis in patients with other tumors, such as lung squamous cell carcinoma and mesothelioma (supplemental Figure 3). GARP is expressed on activated CD4+ Tregs and is involved in the release of activated TGF-β1.29,42 Several studies reported that more than 25% of CD4+ T cells in human bone marrow are phenotypically and functionally Treg cells.43 The percentage of GARP+ BMMCs was significantly higher in AML patients with early relapse (Figure 3B-C). Furthermore, GARP expression was significantly higher on the surface of CD4+ T cells and CD41a+ platelets of relapsing AML patients (Figure 3D-E). At the same time, differences in GARP expression on BMNK cells and CD8+ T cells were statistically insignificant between patients with or without relapse (Figure 3F-G). Furthermore, active TGF-β1 levels in the bone marrow positively correlated with GARP expression by bone marrow CD4+ T cells (Figure 3H-L).
Surface expression levels of GARP on CD4+ T cells correlate positively with active TGF-β1 levels in the bone marrow of relapsing AML patients. (A) Kaplan-Meier analyses of overall survival rates of AML patients from the Gene Expression Profiling Interactive Analysis dataset according to GARP expression levels. High GARP expression (n = 87); low GARP expression (n = 86). Median value was used as the cutoff. P value was calculated by log-rank test. (B-C) Flow cytometry analysis indicating GARP expression on BMMCs isolated from AML patients with early relapse (red; n = 17) or without relapse (blue; n = 22). (D-E) Flow cytometry analysis showing GARP expression levels on CD4+ T cells (left) and platelets (right) from the bone marrow of AML patients with early relapse (red; n = 9) or without relapse (blue; n = 19). (F-G) Flow cytometry analysis showing GARP expression levels on NK cells (left) and CD8+ T cells (right) from the bone marrow of AML patients with early relapse (red; n = 9) or without relapse (blue; n = 19). (H-L) Spearman rank correlation analysis showing the relationship between active TGF-β1 levels and the proportion of GARP+ lymphocytes or the MFI corresponding to the density of GARP as shown by the Spearman correlation coefficients (r) and P values. The data in C, E, and G were analyzed by 2-tailed unpaired t-test; ∗P < .05; ∗∗P < .01; ∗∗∗P < .001; ∗∗∗∗P < .0001. The data are represented as means ± standard deviation.
Surface expression levels of GARP on CD4+ T cells correlate positively with active TGF-β1 levels in the bone marrow of relapsing AML patients. (A) Kaplan-Meier analyses of overall survival rates of AML patients from the Gene Expression Profiling Interactive Analysis dataset according to GARP expression levels. High GARP expression (n = 87); low GARP expression (n = 86). Median value was used as the cutoff. P value was calculated by log-rank test. (B-C) Flow cytometry analysis indicating GARP expression on BMMCs isolated from AML patients with early relapse (red; n = 17) or without relapse (blue; n = 22). (D-E) Flow cytometry analysis showing GARP expression levels on CD4+ T cells (left) and platelets (right) from the bone marrow of AML patients with early relapse (red; n = 9) or without relapse (blue; n = 19). (F-G) Flow cytometry analysis showing GARP expression levels on NK cells (left) and CD8+ T cells (right) from the bone marrow of AML patients with early relapse (red; n = 9) or without relapse (blue; n = 19). (H-L) Spearman rank correlation analysis showing the relationship between active TGF-β1 levels and the proportion of GARP+ lymphocytes or the MFI corresponding to the density of GARP as shown by the Spearman correlation coefficients (r) and P values. The data in C, E, and G were analyzed by 2-tailed unpaired t-test; ∗P < .05; ∗∗P < .01; ∗∗∗P < .001; ∗∗∗∗P < .0001. The data are represented as means ± standard deviation.
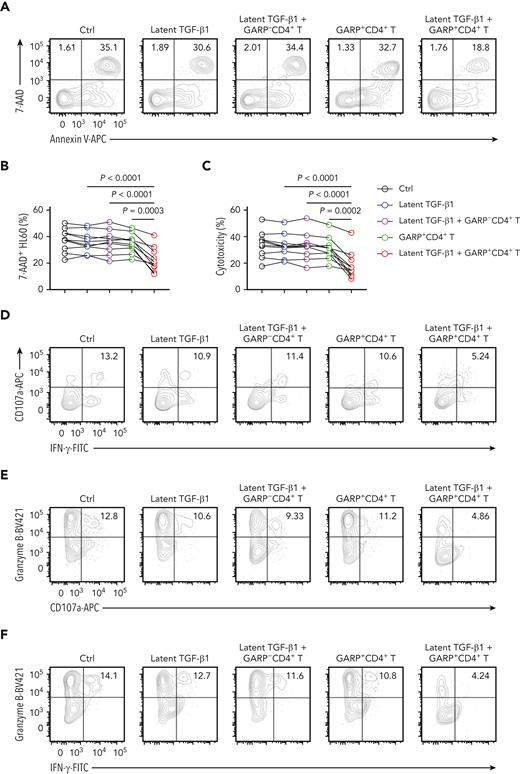
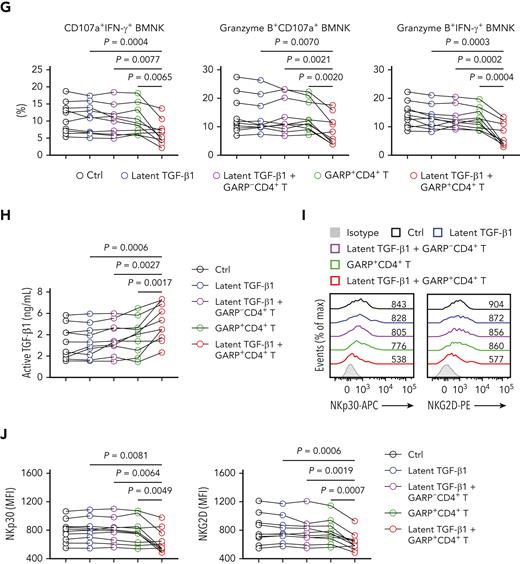
We then investigated whether GARP-induced activation of latent TGF-β1 had an effect on the antitumor activity of NK cells. We purified GARP−CD4+ and GARP+CD4+ T cells, as well as NK cells, from the bone marrow of AML patients without relapse (supplemental Figure 4A-B). The expression of FOXP3, a marker of Treg cells, was significantly higher on the GARP+ population of CD4+ T cells (supplemental Figure 4C-D). NK cells express a variety of activating and inhibitory receptors, and the balance of signals received simultaneously via these is critical for NK cell function.14 NKG2D is a widely studied activating NK cell receptor, signaling via DAP10. Its ligands, ULBPs and MICA/B, are found to be generally expressed on AML cells.44 The engagement of another key activating pathway, the CD94/NKG2C complex, triggers NK cell effector function via DAP12.45 However, 2 inhibitory receptors, NKG2A and KLRG1, which bind HLA-E and members of the classical cadherin family, respectively, have been verified to potently suppress NK cell cytotoxicity.46,47 To assess the role of GARP+CD4+ lymphocytes in activating latent TGF-β1, we performed coculture experiments. BMNK cells preincubated in the presence of both latent TGF-β1 and GARP+CD4+ T cells showed significantly reduced cytotoxicity against HL 60 target cells, compared with BMNK cells cocultured with GARP+CD4+ T cells alone or with NK cells preincubated with latent TGF-β1 and GARP−CD4+ T cells (Figure 4A-C). Furthermore, the proportion of CD107a+IFN-γ+ NK cells, granzyme B+CD107a+ NK cells, and granzyme B+IFN-γ+ NK cells decreased significantly in the latent TGF-β1 plus GARP+CD4+ T cell cocultures compared with NK cells preincubated with GARP+CD4+ T cells in the absence of TGF-β1 or with NK cell cultures containing latent TGF-β1 and GARP−CD4+ T cells (Figure 4D-G). This suggested that GARP impaired the antileukemic responses of NK cells via the activation of latent TGF-β1. The culture supernatant of NK cells preincubated with latent TGF-β1 and GARP+CD4+ T cells showed significantly higher levels of active TGF-β1 than any other combined culture (Figure 4H). This strongly supported the notion that GARP+CD4+ T cells induced the activation of latent TGF-β1. Furthermore, NK cells cocultured with latent TGF-β1 plus GARP+CD4+ T cells showed substantial downregulation of NKp30 and NKG2D compared with the control NK cells, NK cells cocultured with GARP+CD4+ T cells, and NK cells cocultured with latent TGF-β1 plus GARP−CD4+ T cells (Figure 4I-J). The proportion of NKG2A+ NK cells was higher, and the proportion of Ki-67+ NK cells was decreased when NK cells were preincubated with latent TGF-β1 and GARP+CD4+ T cells compared with any other combined culture (supplemental Figure 4E-H).
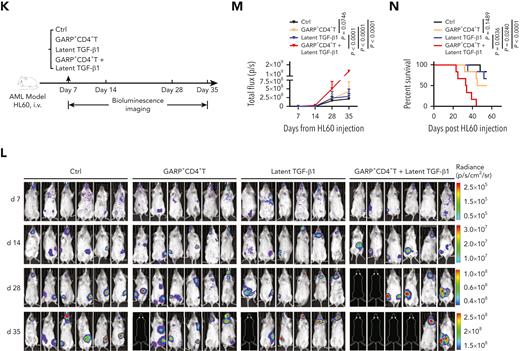
GARP+CD4+ T cells induce TGF-β1 activation that inhibits NK cell-mediated antitumor effects both in vitro and in vivo. (A-C) Flow cytometry data indicating the percentage of 7-AAD+ HL60 cells (target cells) cocultured for 5 hours with BMNK cells pretreated with dimethyl sulfoxide (DMSO; solvent control; black), latent TGF-β1 (10 ng/mL; blue), latent TGF-β1 (10 ng/mL) plus GARP-CD4+ T cells (purple), GARP+CD4+ T cells (green), or latent TGF-β1 (10 ng/mL) plus GARP+CD4+ T cells (red) to estimate cytotoxicity. The NK cells: target cells ratio = 5:1; the ratio of NK cells: GARP-CD4+ T cells or GARP+CD4+ T cells was 5:1. n = 10. (D-G) Flow cytometry analysis showing the proportion of (D) CD107a+IFN-γ+ NK cells, (E) granzyme B+ CD107a+ NK cells, and (F) granzyme B+IFN-γ+ NK cells within the total BMNK cell population that was pretreated with either DMSO (solvent control; black), latent TGF-β1 (10 ng/mL; blue), latent TGF-β1 (10 ng/mL) plus GARP−CD4+ T cells (purple), GARP+CD4+ T cells (green), or latent TGF-β1 (10 ng/mL) plus GARP+CD4+ T cells (red) and cocultured with HL60 cells for 5 hours. n = 10. (H) ELISA results indicating the levels of active TGF-β1 in the supernatants of coculture experiments described in D-G. (I-J) Flow cytometry analysis showing NKp30 (I, left) and NKG2D (I, right) expression levels on BMNK cells pretreated with DMSO (solvent control), latent TGF-β1 (10 ng/mL), latent TGF-β1 (10 ng/mL) plus GARP−CD4+ T cells, GARP+CD4+ T cells, or latent TGF-β1 (10 ng/mL) plus GARP+CD4+ T cells. n = 10. (K) Experimental design: NCG mice were injected into the tail vein with 5 × 10⁵ HL60 cells stably expressing luciferase. After confirmation of engraftment by bioluminescence imaging (BLI) on day 7, 2.5 × 10⁶ NK cells were transferred to all the mice via tail vein in combination with the injection of PBS control (50 μL, IP; QW), 5 × 10⁵ GARP+CD4+ T cells, latent TGF-β1 (50 μL, 5 ng/mL; IP; QW), or 5 × 10⁵ GARP+CD4+ T cells in the presence of latent TGF-β1. AML burden was monitored by BLI at the indicated time points. (L) BLI of AML burden. (M) AML burden was quantified as the average value of the total flux (p/s). n = 6 mice per group. (N) Kaplan-Meier survival curve of mice bearing HL60 cell−derived tumors. Statistical significance was determined by log-rank Mantel-Cox test. n = 6 mice per group. The data in B, C, G, H, J, and M were analyzed by 1-way analysis of variance with Tukey multiple comparisons test; ∗P < .05; ∗∗P < .01; ∗∗∗P < .001; ∗∗∗∗P < .0001. The data are represented as means ± standard deviation.
GARP+CD4+ T cells induce TGF-β1 activation that inhibits NK cell-mediated antitumor effects both in vitro and in vivo. (A-C) Flow cytometry data indicating the percentage of 7-AAD+ HL60 cells (target cells) cocultured for 5 hours with BMNK cells pretreated with dimethyl sulfoxide (DMSO; solvent control; black), latent TGF-β1 (10 ng/mL; blue), latent TGF-β1 (10 ng/mL) plus GARP-CD4+ T cells (purple), GARP+CD4+ T cells (green), or latent TGF-β1 (10 ng/mL) plus GARP+CD4+ T cells (red) to estimate cytotoxicity. The NK cells: target cells ratio = 5:1; the ratio of NK cells: GARP-CD4+ T cells or GARP+CD4+ T cells was 5:1. n = 10. (D-G) Flow cytometry analysis showing the proportion of (D) CD107a+IFN-γ+ NK cells, (E) granzyme B+ CD107a+ NK cells, and (F) granzyme B+IFN-γ+ NK cells within the total BMNK cell population that was pretreated with either DMSO (solvent control; black), latent TGF-β1 (10 ng/mL; blue), latent TGF-β1 (10 ng/mL) plus GARP−CD4+ T cells (purple), GARP+CD4+ T cells (green), or latent TGF-β1 (10 ng/mL) plus GARP+CD4+ T cells (red) and cocultured with HL60 cells for 5 hours. n = 10. (H) ELISA results indicating the levels of active TGF-β1 in the supernatants of coculture experiments described in D-G. (I-J) Flow cytometry analysis showing NKp30 (I, left) and NKG2D (I, right) expression levels on BMNK cells pretreated with DMSO (solvent control), latent TGF-β1 (10 ng/mL), latent TGF-β1 (10 ng/mL) plus GARP−CD4+ T cells, GARP+CD4+ T cells, or latent TGF-β1 (10 ng/mL) plus GARP+CD4+ T cells. n = 10. (K) Experimental design: NCG mice were injected into the tail vein with 5 × 10⁵ HL60 cells stably expressing luciferase. After confirmation of engraftment by bioluminescence imaging (BLI) on day 7, 2.5 × 10⁶ NK cells were transferred to all the mice via tail vein in combination with the injection of PBS control (50 μL, IP; QW), 5 × 10⁵ GARP+CD4+ T cells, latent TGF-β1 (50 μL, 5 ng/mL; IP; QW), or 5 × 10⁵ GARP+CD4+ T cells in the presence of latent TGF-β1. AML burden was monitored by BLI at the indicated time points. (L) BLI of AML burden. (M) AML burden was quantified as the average value of the total flux (p/s). n = 6 mice per group. (N) Kaplan-Meier survival curve of mice bearing HL60 cell−derived tumors. Statistical significance was determined by log-rank Mantel-Cox test. n = 6 mice per group. The data in B, C, G, H, J, and M were analyzed by 1-way analysis of variance with Tukey multiple comparisons test; ∗P < .05; ∗∗P < .01; ∗∗∗P < .001; ∗∗∗∗P < .0001. The data are represented as means ± standard deviation.
To investigate whether GARP-induced activation of latent TGF-β1 could impair the antileukemia effect of NK cells in vivo, we injected luciferase-labeled HL60 cells into NCG (NOD/ShiLtJGpt-Prkdcem26Cd52IL-2rgem26Cd22/Gpt) mice by tail vein to establish a leukemia xenograft model.33 After confirming engraftment by bioluminescence imaging, NK cells were transferred into these mice in the presence of either PBS, GARP+CD4+ T cells, latent TGF-β1, or GARP+CD4+ T cells plus latent TGF-β1 (Figure 4K). Compared with the PBS-treated control group, the GARP+CD4+ T cells−alone group, or the latent TGF-β1−alone treatment group, the GARP+CD4+ T cells plus latent TGF-β1−group exhibited a significantly higher AML burden and shorter survival time (Figure 4L-N). Taken together, these findings demonstrated that GARP-expressing T cells induced NK cell disfunction by activating TGF-β1.
Active TGF-β1 levels during relapse correlate with impaired antileukemic responses of BMNK cells ex vivo
Next, we examined whether BMNK cell-mediated antileukemic responses were impaired and wanted to establish if active TGF-β1 impaired antileukemic responses in patients with relapsing AML. First, we analyzed the proportion and number of BMNK cells in our cohort. We observed that the overall percentage and number of NK cells were significantly reduced in the bone marrow of AML patients with early relapse compared with those without relapse (supplemental Figure 5A-B). Furthermore, the proportions of Ki-67+ BMNK cells were significantly lower in patients with relapsed AML compared with those without AML relapse, but the percentage of apoptotic NK cells was comparable between the 2 groups (supplemental Figure 5C). Moreover, the proportion of NK cells expressing inhibitory NKG2A+ and KLRG1+ receptors increased while those carrying the activating NKG2C+CD94+ NK receptors decreased in relapsing AML patients (supplemental Figure 5D-E). In addition, TMRM+ and MitoTracker Green+ BMNK cells, as well as NKp30 expression, were obviously lower in patients with relapsed AML compared with those without relapse (supplemental Figure 5F-H).
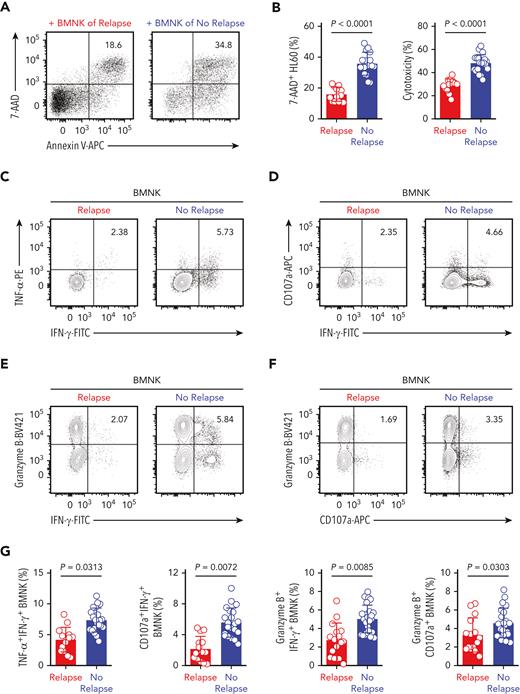
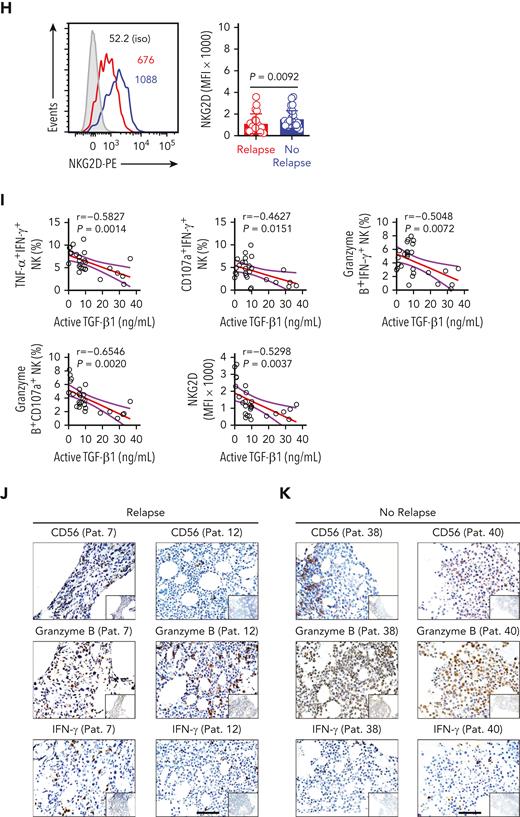
In coculture experiments with HL60 target cells, the cytotoxicity of BMNK cells purified from AML patients with early relapse was significantly decreased when compared with that of NK cells from patients without relapse (Figure 5A-B). Moreover, the proportion of polyfunctional effector NK cells all showed significant reductions in relapsing patients (Figure 5C-G). This suggested that the antitumor effector function of NK cells was compromised in AML patients with early relapse. The expression of NKG2D by BMNK cells also decreased significantly in this group (Figure 5H). Moreover, the proportion of polyfunctional effector NK cells showed a negative correlation with the levels of active TGF-β1 in the bone marrow (Figure 5I). We performed immunohistochemistry analysis using serial sections prepared from bone marrow biopsy samples and found reduced numbers of NK cells and decreased levels of granzyme B in the bone marrow of AML patients with poor outcomes (Figure 5J-K).
Higher levels of active TGF-β1 are associated with impaired antileukemic responses of NK cells in the bone marrow of patients with relapsed AML. (A-B) Flow cytometry analysis indicating the percentage of 7-AAD+ HL60 cells (target cells) cocultured for 5 hours with NK cells isolated from the bone marrow of AML patients with early relapse (red; n = 13) or without relapse (blue; n = 21). NK cell: target cell ratio = 5:1. (C-G) Flow cytometry data of the proportion of (C) IFN-γ+ TNF-α+ NK cells, (D) IFN-γ+ CD107a+ NK cells, (E) IFN-γ+ granzyme B+ NK cells, and (F) granzyme B+ CD107a+ NK cells among the total NK cells purified from the bone marrow of AML patients with early relapse (red; n = 13) or without relapse (blue; n = 21) after coculture with HL60 cells for 5 hours. (H) Flow cytometry analysis showing NKG2D expression on NK cells isolated from the bone marrow of AML patients with early relapse (red; n = 22) or without relapse (blue; n = 28). (I) Spearman rank correlation analysis shows the relationship between active TGF-β1 levels and the proportion of different immune cell types and indicated molecules as shown by the Spearman correlation coefficients (r) and P values. Data in B, G, and H were analyzed by 2-tailed unpaired t-test; ∗P < .05; ∗∗P < .01; ∗∗∗P < .001; ∗∗∗∗P < .0001. Data are represented as means ± standard deviation. (J-K) Representative immunohistochemistry images show the staining intensity for CD56, granzyme B, and IFN-γ in the bone marrow biopsy samples from AML patients with early relapse (J) or without relapse (K). Scale bars, 100 μm.
Higher levels of active TGF-β1 are associated with impaired antileukemic responses of NK cells in the bone marrow of patients with relapsed AML. (A-B) Flow cytometry analysis indicating the percentage of 7-AAD+ HL60 cells (target cells) cocultured for 5 hours with NK cells isolated from the bone marrow of AML patients with early relapse (red; n = 13) or without relapse (blue; n = 21). NK cell: target cell ratio = 5:1. (C-G) Flow cytometry data of the proportion of (C) IFN-γ+ TNF-α+ NK cells, (D) IFN-γ+ CD107a+ NK cells, (E) IFN-γ+ granzyme B+ NK cells, and (F) granzyme B+ CD107a+ NK cells among the total NK cells purified from the bone marrow of AML patients with early relapse (red; n = 13) or without relapse (blue; n = 21) after coculture with HL60 cells for 5 hours. (H) Flow cytometry analysis showing NKG2D expression on NK cells isolated from the bone marrow of AML patients with early relapse (red; n = 22) or without relapse (blue; n = 28). (I) Spearman rank correlation analysis shows the relationship between active TGF-β1 levels and the proportion of different immune cell types and indicated molecules as shown by the Spearman correlation coefficients (r) and P values. Data in B, G, and H were analyzed by 2-tailed unpaired t-test; ∗P < .05; ∗∗P < .01; ∗∗∗P < .001; ∗∗∗∗P < .0001. Data are represented as means ± standard deviation. (J-K) Representative immunohistochemistry images show the staining intensity for CD56, granzyme B, and IFN-γ in the bone marrow biopsy samples from AML patients with early relapse (J) or without relapse (K). Scale bars, 100 μm.
Next, we analyzed the intracellular IFN-γ and granzyme B levels by immunofluorescence in purified BMNK cells after stimulation with IL-2 and IL-12. Both granzyme B and IFN-γ expression levels were significantly lower in the BMNK cells from AML patients with early relapse compared with those from AML patients without relapse (supplemental Figure 5I-J). Taken together, these findings showed that the antileukemic responses of NK cells were significantly impaired in AML patients with early relapse and negatively correlated with the levels of activated TGF-β1 in the bone marrow microenvironment.
Inhibition of active TGF-β1 signaling restores antileukemic activity of NK cells
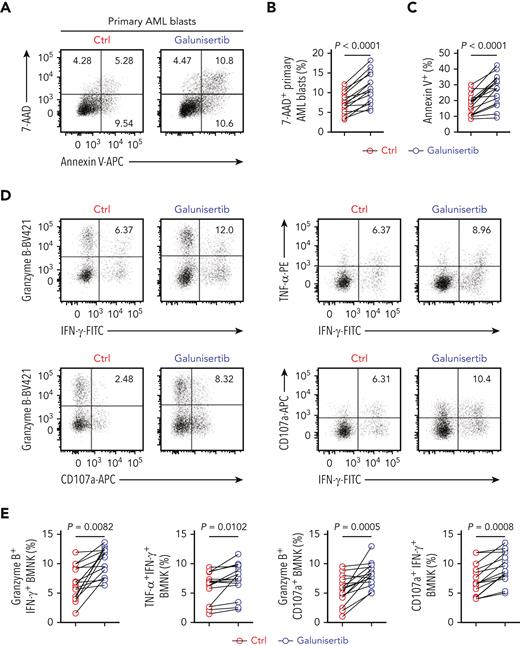
Next, we investigated whether the inhibition of TGF-β1/TGF-βR1 signaling could restore the antileukemic activity of BMNK cells. A study by Holmgaard et al20 reported that targeting the TGF-β1 pathway with galunisertib, an inhibitor of TGF-βR1 in clinical studies, promoted antitumor immunity of hepatocellular cancer (HCC) or pancreatic cancer patients to immunotherapy. Therefore, we tested if treatment with this compound could reverse the observed impairments in the antileukemic function of BMNK cells from AML patients with early relapse. The cytotoxicity of BMNK cells against primary AML blast cells was significantly improved when galunisertib was added to NK cells isolated from AML patients with early relapse (Figure 6A-C). Specifically, ex vivo pretreatment with galunisertib restored both degranulation and cytokine expression in the NK cells isolated from these AML patients (Figure 6D-E). Galunisertib pretreatment significantly downregulated pSMAD2/3 expression while substantially upregulating pS6 expression by BMNK cells of relapsing AML patients (Figure 6F-G). Moreover, pretreatment with the compound significantly increased mitochondrial membrane potential and mitochondrial mass (Figure 6F-G). The obtained data clearly indicate that galunisertib has the ability to increase mTOR activity, restore mitochondrial homeostasis, and improve the effector function of BMNK cells isolated from AML patients with early relapse.
Inhibition of TGF-β1 signaling restores antileukemic activity of NK cells. (A-C) Flow cytometry analysis showing the percentage of 7-AAD+ primary AML blasts and Annexin V + primary AML blasts (target cells) when cocultured for 5 hours with NK cells purified from the bone marrow of AML patients with early relapse. The BMNK cells were pretreated with dimethyl sulfoxide (solvent control) or galunisertib (10 μM) for 24 hours before coculture. NK cell: target cell ratio = 5:1. (D-E) Flow cytometry analysis indicating the proportions of IFN-γ+ granzyme B+ NK cells, IFN-γ+ TNF-α+ NK cells, granzyme B+ CD107a+ NK cells, IFN-γ+ CD107a+ NK cells among control and galunisertib-treated NK cells isolated from the bone marrow of AML patients with early relapse. n = 15. (F-G) Flow cytometry analysis showing the proportion of pSMAD2/3+ NK cells (upper left), pS6+ NK cells (upper right), tetramethylrhodamine methyl ester+ NK cells (lower left), and MitoTracker Green+ NK cells (lower right) among control and galunisertib-treated NK cells isolated from the bone marrow of AML patients with early relapse. n = 15. (H) Experimental scheme: NCG mice were injected with 5 × 10⁵ HL60 cells stably expressing luciferase into the tail vein. After confirmation of engraftment by BLI on day 7, 2.5 × 10⁶ NK cells were transferred to all the mice via tail vein in combination with vehicle control, 5 × 10⁵ GARP+CD4+ T cells, 5 × 10⁵ GARP+CD4+ T cells in the presence of latent TGF-β1 (50 μL, 5 ng/mL; IP; QW), active TGF-β1 (50 μL, 5 ng/mL; IP; QW) in combination with vehicle control, 5 × 10⁵ GARP+CD4+ T cells in the presence of latent TGF-β1 and galunisertib at 75 mg/kg twice daily (BID) by oral gavage for 21 days, or active TGF-β1 in combination with galunisertib (75 mg/kg; twice daily for 21 days) for treatment. AML burden was monitored by BLI at the indicated time points. (I) BLI of AML burden. (J) AML burden was quantified as the average value of the total flux (p/s). n = 6 mice per group. (K) Kaplan-Meier survival curve of mice bearing HL60 cell−derived tumors. Statistical significance was determined by log-rank Mantel-Cox test. n = 6 mice per group. Data in B, C, E, and G were analyzed by 2-tailed paired t-test. Data in J were analyzed by 1-way analysis of variance with Tukey multiple comparisons test. ∗P < .05; ∗∗P < .01; ∗∗∗P < .001; ∗∗∗∗P < .0001. Data are represented as means ± standard deviation.
Inhibition of TGF-β1 signaling restores antileukemic activity of NK cells. (A-C) Flow cytometry analysis showing the percentage of 7-AAD+ primary AML blasts and Annexin V + primary AML blasts (target cells) when cocultured for 5 hours with NK cells purified from the bone marrow of AML patients with early relapse. The BMNK cells were pretreated with dimethyl sulfoxide (solvent control) or galunisertib (10 μM) for 24 hours before coculture. NK cell: target cell ratio = 5:1. (D-E) Flow cytometry analysis indicating the proportions of IFN-γ+ granzyme B+ NK cells, IFN-γ+ TNF-α+ NK cells, granzyme B+ CD107a+ NK cells, IFN-γ+ CD107a+ NK cells among control and galunisertib-treated NK cells isolated from the bone marrow of AML patients with early relapse. n = 15. (F-G) Flow cytometry analysis showing the proportion of pSMAD2/3+ NK cells (upper left), pS6+ NK cells (upper right), tetramethylrhodamine methyl ester+ NK cells (lower left), and MitoTracker Green+ NK cells (lower right) among control and galunisertib-treated NK cells isolated from the bone marrow of AML patients with early relapse. n = 15. (H) Experimental scheme: NCG mice were injected with 5 × 10⁵ HL60 cells stably expressing luciferase into the tail vein. After confirmation of engraftment by BLI on day 7, 2.5 × 10⁶ NK cells were transferred to all the mice via tail vein in combination with vehicle control, 5 × 10⁵ GARP+CD4+ T cells, 5 × 10⁵ GARP+CD4+ T cells in the presence of latent TGF-β1 (50 μL, 5 ng/mL; IP; QW), active TGF-β1 (50 μL, 5 ng/mL; IP; QW) in combination with vehicle control, 5 × 10⁵ GARP+CD4+ T cells in the presence of latent TGF-β1 and galunisertib at 75 mg/kg twice daily (BID) by oral gavage for 21 days, or active TGF-β1 in combination with galunisertib (75 mg/kg; twice daily for 21 days) for treatment. AML burden was monitored by BLI at the indicated time points. (I) BLI of AML burden. (J) AML burden was quantified as the average value of the total flux (p/s). n = 6 mice per group. (K) Kaplan-Meier survival curve of mice bearing HL60 cell−derived tumors. Statistical significance was determined by log-rank Mantel-Cox test. n = 6 mice per group. Data in B, C, E, and G were analyzed by 2-tailed paired t-test. Data in J were analyzed by 1-way analysis of variance with Tukey multiple comparisons test. ∗P < .05; ∗∗P < .01; ∗∗∗P < .001; ∗∗∗∗P < .0001. Data are represented as means ± standard deviation.
We then verified whether the inhibition of TGF-β1/TGF-βR1 signaling restored the effector function of BMNK cells by abrogating the effects of active TGF-β1. Therefore, we pretreated naive NK cells with (1) latent TGF-β1 or active TGF-β1 plus anti-TGF-β1 antibody/galunisertib or (2) latent TGF-β1 in the presence of GARP−CD4+ T cells or GARP+CD4+ T cells plus anti-TGF-β1 or galunisertib. Then, the NK cells were co-cultured with primary AML blasts. We observed that antitumor functions of NK cells were significantly reduced by active TGF-β1 but restored by treatment with galunisertib, which blocked TGF-β1/TGF-βR1 signaling (supplemental Figure 6A-B).
To directly assess the ability of galunisertib to restore the antitumor activity of NK cells in vivo, we used a leukemia xenograft model based on injecting luciferase-labeled HL60 cells into NCG mice. After confirming engraftment, NK cells were transferred into the mice and the mice were injected with GARP+CD4+ T cells, GARP+CD4+ T cells in the presence of latent TGF-β1, active TGF-β1, or vehicle control (Figure 6H). These experiments demonstrated that both groups of mice receiving GARP+CD4+ T cells in the presence of latent TGF-β1 and receiving active TGF-β1 had significantly higher AML burden and shorter survival time (Figure 6I-K). In addition, bioluminescence imaging indicated that in mice injected with active TGF-β1, NK cells failed to control tumor growth in the later stages of observation (day 35) (Figure 6I-K). Importantly, we found that if the injection of GARP+CD4+ T cells in the presence of latent TGF-β1 or the injection of active TGF-β1 was followed by the administration of galunisertib, this significantly reduced tumor burden and prolonged survival (Figure 6H-K). Our results indicated that the inhibition of TGF-β1/TGF-βR1 signaling effectively restored impaired antileukemic responses of NK cells caused by active TGF-β1. Taken together, our findings demonstrated that the effector function of NK cells was impaired by the presence of active TGF-β1 in the bone marrow microenvironment of AML patients with early relapse. We also showed that inhibition of TGF-β1 signaling by galunisertib could restore the antileukemic functions of NK cells both in vitro and in vivo.
Discussion
Posttransplantation relapse is frequent in AML patients and represents the main cause of treatment failure and death. In this study, we demonstrated that active TGF-β1 levels are significantly increased in the bone marrow of AML patients experiencing early relapse. Furthermore, we showed that active TGF-β1 suppressed the antileukemic action of BMNK cells by downregulating mTORC1 activity and reducing mitochondrial respiration. We also demonstrated that inhibition of TGF-β1 signaling at least partially restored the antileukemic effect of NK cells. Taken together, these findings highlight a novel immune escape mechanism in the relapse of AML following allogeneic transplantation.
The causes of immune cell dysfunction are dependent on the tumor type and tumor microenvironment that can exhibit considerable individuality and multiformity. We previously demonstrated that the aberrant expression of fructose-1,6-bisphosphatase in NK cells led to their dysfunction, which was dependent on increased TGF-β1 expression in the lung cancer microenvironment.36 Here, we found that active TGF-β1 levels were significantly increased in the bone marrow of relapsing patients. The impaired effector function of BMNK cells showed a correlation with the levels of active TGF-β1. Furthermore, BMNK cells isolated from patients with relapsed AML showed dysfunctional mitochondrial metabolism. In addition, treatment with active TGF-β1 significantly inhibited the mTOR activity, mitochondrial OXPHOS, and antitumor activity of BMNK cells.
Recently, GARP has been identified as a latent TGF-β1‒binding protein playing a key role in regulating the bioavailability of TGF-β1.24,48 In latent TGF-β1 the mature TGF-β1 dimer remains noncovalently associated with the latency-associated peptide (LAP), preventing its binding to the TGF-β1 receptor.18 Activation of TGF-β1 requires the release of mature TGF-β1 from the LAP, a critical step that can be mediated by multiple mechanisms. The binding of latent TGF-β1 to GARP requires the formation of a disulfide bond with a key cysteine residue in the LAP. The association of this complex with alpha-beta integrins ultimately releases mature, active TGF-β1.48,49 Our study showed an increased expression of GARP by bone marrow CD4+ T cells in AML patients with early relapse. Furthermore, incubation of GARP+CD4+ T cells with latent TGF-β1 significantly increased active TGF-β1 levels in the culture supernatant, inhibiting mTOR and the antitumor activity of NK cells. Previous reports indicated that the bone marrow is a reservoir for Treg cells, and the abundance of these cells was linked to inadequate cytotoxic activity of immune cells, causing poor survival in many cancer types.43,48,50 Activated TGF-β1 plays a crucial role in Treg cell development and biology. The TGF-β1-triggered activation of Smad3 results in the formation of Smad3/Smad4 heterodimers that translocate to the nucleus and bind to FOXP3 enhancer. This activation of Smad3 is essential for inducing FOXP3 expression in naive CD4+ T cells, thus promoting their differentiation into induced Treg cells with suppressive function.48,51 Despite their accumulation into GARP activation on CD4+ T cells and possible role in Treg activation by activated TGF-β1, more preclinical work is needed to clarify how GARP+ Treg cells may regulate the antitumor effects of NK cells in the bone marrow microenvironment.
Furthermore, we observed that pretreatment with galunisertib restored mitochondrial function and the cytotoxic effector function of BMNK cells from patients with relapsed AML. Importantly, we found that treatment with galunisertib improved the antitumor capacity of NK cells in a leukemia xenograft mouse model. Several studies have demonstrated that NK cell−based immunotherapy is a promising treatment option in several cancers.10,52-54 Our results suggested that enhancing the function of BMNK cells by inhibiting TGF-β1/TGF-βR1 may improve outcomes after AML therapy and potentially prevent relapse after allo-HSCT.
The presented study has a few limitations. An increased proportion of TGF-β1‒producing NK cells have been reported in patients with breast cancer.29 However, in our study, we did not investigate the role of autocrine TGF-β1 signaling in relapse. Slattery et al29 reported that GARP was constitutively overexpressed by NK cells of some metastatic breast cancer patients. Moreover, targeting GARP/TGF-β1 complexes on NK cells isolated from such patients replicated the effects of TGF-β1 neutralization.29 However, in this study, we did not explore the relevance of GARP+ NK cells in the bone marrow of patients with AML relapse. Furthermore, the main source of TGF-β1 in the bone marrow of patients with relapsing AML currently remains unknown, although several immune and nonimmune cells can produce TGF-β1.
In conclusion, our results demonstrate that GARP-mediated active TGF-β1 release induces BMNK cell dysfunction in AML patients suffering early relapse post-allo-HSCT and that the inhibition of TGF-β1 signaling by galunisertib could restore the antitumor activity of NK cells both in vitro and in vivo. Thus, TGF-β1 signaling inhibitor may have therapeutic application against tumors by restoring NK cells. However, further studies will be required to ascertain the dosage, safety, and efficacy of galunisertib in the treatment of AML patients.
Acknowledgments
This work was supported by the Chinese Academy of Medical Sciences (BB2070000027), Natural Science Foundation of China (82100230, 81670165, and 81903637), Fundamental Research Funds for the Central Universities (WK9110000168 and WK9110000001), and China Postdoctoral Science Foundation (2020M671910).
Authorship
Contribution: D.W. designed and conducted experiments, analyzed data, and wrote the manuscript; D.W., X. Zheng, and Y.Z. performed the experiments and interpreted the data; Y.L. and P.Y. helped to analyze the data; H. Wang, H.L, J.J., and H.Z. helped to collect whole-blood samples and patient information; R.S., Y.W., B.F., and Z.T. established techniques of flow cytometry and interpreted the data; and Z.S., X. Zhu, and H. Wei designed the study, supervised the research, and revised the manuscript.
Conflict-of-interest disclosure: The authors declare no competing financial interests.
Correspondence: Zimin Sun, University of Science and Technology of China, 443 Huangshan Rd, Hefei City, 230027, Anhui, China; e-mail: zmsun@ustc.edu.cn; and Xiaoyu Zhu, University of Science and Technology of China, 443 Huangshan Rd, Hefei City, 230027, Anhui, China; e-mail: xiaoyuz@ustc.edu.cn; and Haiming Wei, University of Science and Technology of China, 443 Huangshan Rd, Hefei City, 230027, Anhui, China; e-mail: ustcwhm@ustc.edu.cn.
References
Author notes
For original data, please contact ustcwhm@ustc.edu.cn. Microarray data are available at GEO under accession number GSE190546.
The online version of this article contains a data supplement.
There is a Blood Commentary on this article in this issue.
The publication costs of this article were defrayed in part by page charge payment. Therefore, and solely to indicate this fact, this article is hereby marked “advertisement” in accordance with 18 USC section 1734.


This feature is available to Subscribers Only
Sign In or Create an Account Close Modal