Key Points
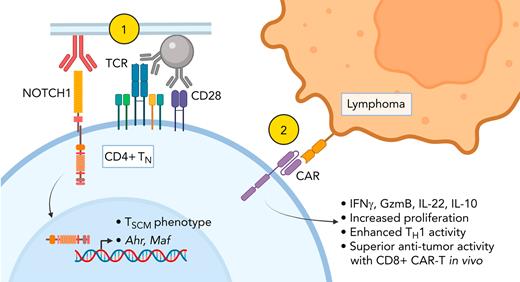
NOTCH1 signaling restricts naïve CD4+ T-cell differentiation and enhances CD4+ CAR-T proliferation and helper function.
NOTCH1 signaling programs distinct cytokine profiles in naïve CD4+ T cells by inducing AhR and c-MAF.
Abstract
Adoptive transfer of T cells expressing chimeric antigen receptors (CAR-T) effectively treats refractory hematologic malignancies in a subset of patients but can be limited by poor T-cell expansion and persistence in vivo. Less differentiated T-cell states correlate with the capacity of CAR-T to proliferate and mediate antitumor responses, and interventions that limit tumor-specific T-cell differentiation during ex vivo manufacturing enhance efficacy. NOTCH signaling is involved in fate decisions across diverse cell lineages and in memory CD8+ T cells was reported to upregulate the transcription factor FOXM1, attenuate differentiation, and enhance proliferation and antitumor efficacy in vivo. Here, we used a cell-free culture system to provide an agonistic NOTCH1 signal during naïve CD4+ T-cell activation and CAR-T production and studied the effects on differentiation, transcription factor expression, cytokine production, and responses to tumor. NOTCH1 agonism efficiently induced a stem cell memory phenotype in CAR-T derived from naïve but not memory CD4+ T cells and upregulated expression of AhR and c-MAF, driving heightened production of interleukin-22, interleukin-10, and granzyme B. NOTCH1-agonized CD4+ CAR-T demonstrated enhanced antigen responsiveness and proliferated to strikingly higher frequencies in mice bearing human lymphoma xenografts. NOTCH1-agonized CD4+ CAR-T also provided superior help to cotransferred CD8+ CAR-T, driving improved expansion and curative antitumor responses in vivo at low CAR-T doses. Our data expand the mechanisms by which NOTCH can shape CD4+ T-cell behavior and demonstrate that activating NOTCH1 signaling during genetic modification ex vivo is a potential strategy for enhancing the function of T cells engineered with tumor-targeting receptors.
Introduction
NOTCH plays context-dependent roles in cell differentiation and stem cell self-renewal.1,2 In T cells, NOTCH coordinates thymic T-cell development from common lymphoid progenitors,3-6 facilitates gene expression critical for effector function,7-9 and promotes memory CD4+ T-cell (TMEM) survival following infection.10 Naïve T cells (TN) upregulate NOTCH receptors after T-cell receptor (TCR) ligation and receive signals from antigen-presenting cells expressing NOTCH ligands.11-13 In activated CD4+ T cells, NOTCH signaling promotes T-helper (TH) subset-defining transcription factor (TF) and cytokine gene expression irrespective of polarizing cytokine signals, broadly enabling effector responses.7,14-19 Depending on experimental context, NOTCH signaling has also been reported to skew differentiation toward various CD4+ TH subsets.14-16,20-22 In contrast to NOTCH’s role in T-cell effector function, one study reported that coculturing previously activated TMEM with OP9 stromal cells overexpressing the NOTCH ligand DLL1 (OP9/DLL1) induced a less differentiated T-cell surface phenotype and enhanced T-cell proliferation upon restimulation.23 These diverse effects suggest that manipulation of NOTCH signaling could be used to improve T-cell cancer immunotherapy24.
Treatment of advanced hematologic malignancies with T cells engineered to express chimeric antigen receptors (CAR-T) targeting tumor-associated molecules is effective, but responses are often incomplete.25,26 Both CD4+ and CD8+ CAR-T contribute to antitumor activity through direct killing and host immune cell activation in the tumor microenvironment.27,28 In preclinical models, CAR-T derived from less differentiated subsets mediate superior antitumor responses,28 and limiting tumor-specific T-cell differentiation during ex vivo manufacturing enhances efficacy.29-35 Ex vivo polarization of CD4+ T-cell differentiation toward particular TH subsets also improves antitumor responses in vivo.36,37 These findings suggest that NOTCH signaling, whether delivered in contexts that restrict CD4+ differentiation or promote acquisition of particular TH subset behavior, could improve CAR-T therapy.
The effects of NOTCH signaling in CD4+ T cells can vary with induction method as soluble NOTCH ligands, NOTCH-specific monoclonal antibodies (mAbs), and overexpression of transcriptionally active NOTCH intracellular domains in T cells provide signals of different quality, strength, and duration.38 Additional membrane-bound and soluble signals available during cell-based delivery of NOTCH ligands further complicate interpretation; indeed, culturing CD8+ T cells in OP9/DLL1-conditioned medium was sufficient to induce phenotypic changes reported to be NOTCH-specific.39 We avoided using cell lines and instead developed a culture system using αCD3/CD28 mAb-coated beads and plate-coated αNOTCH mAb to simultaneously activate CD4+ T cells and engage NOTCH receptors. Using this method, we studied the effects of NOTCH1 signaling on CD4+ CAR-T gene expression, differentiation, and antitumor responses.
Methods
Cell lines
Lentiviral vectors and lentivirus production
CAR vectors encoding the CD19-specific FMC63 single-chain variable fragment and truncated EGFR (EGFRt) transduction marker or the ROR1-specific R12 single-chain variable fragment and truncated CD19 (tCD19) transduction marker with either 4-1BB/CD3ζ or CD28/CD3ζ costimulatory domains were previously generated.42,43 “CAR” denotes FMC63:4-1BB/CD3ζ:EGFRt unless otherwise stated. GFP was removed from the SGEP plasmid (#111170, Addgene) and replaced with a selectable truncated CD34 (tCD34) marker. Maf-targeting short hairpin RNAs (shRNAs) were designed using SplashRNA and cloned into SGEP-tCD34 as described.44 Lentivirus was generated as described.40
T-cell culture
Peripheral blood was obtained from healthy donors who provided informed consent to participate in a blood donation protocol approved by the Fred Hutchinson Cancer Research Center Institutional Review Board. T-cell subsets were isolated using EasySep CD4+ Naïve, CD8+ Naïve, and CD4+ Memory T-cell negative selection kits (Stemcell).
Non–tissue-culture-coated plates were coated overnight at 4°C with phosphate-buffered saline (PBS) plus 5 μg/mL RetroNectin (Takara) and either 2.5 μg/mL Ultra-LEAF-Purified αNOTCH1 mAb (MHN1-519, BioLegend) for NOTCH1 (N1) culture, 2.5 μg/mL mouse immunoglobulin G1κ (IgG1κ) isotype (BioLegend) for control culture, or various concentrations of DLL1-Fc. Coating solution was aspirated and plates washed twice with PBS before T-cell plating. On day 0, 2 × 10⁵ T cells and 6 × 10⁵ Human T-Activator CD3/CD28 Dynabeads (ThermoFisher) in 1 mL T-cell culture medium including interleukin-2 (IL-2)40 were plated per N1/control-coated 24-well. On day 1, T cells were transduced with CAR or shRNA lentivirus.40 T cells were expanded in N1/control-coated wells for 7 days before transfer to uncoated flasks. DynaBeads were removed at day 5. CAR-T were analyzed on day 11. In some experiments, EGFRt+ CAR-T were enriched as described.40 tCD34+ T-cells were enriched by CD34 microbead positive selection (Miltenyi).
RNA sequencing (RNAseq)
Three hundred CD4+ EGFRt+ CAR-T cells were fluorescence-activated cell sorted (FACS) into SMART-Seq HT lysis buffer (Takara). Complementary DNA was generated using 13 amplification cycles and purified using AMPure XP beads (Agencourt). Libraries were prepared using the Nextera XT kit (Illumina) and sequenced in an SP flow cell on a NovaSeq 6000 (Illumina) to read depths > 10 × 106 per sample. Transcripts were aligned using STAR45 and analyzed for differential expression using DESeq246 and gene set enrichment analysis (GSEA).47
In vitro assays
For cocultures, tumors were irradiated (10 000 rad) and plated at 1.25 × 10⁴ cells per well in a 96-well U-bottom plate. For assays with recombinant human CD19 (rhCD19), 100 μL PBS plus 10 μg/mL avidin (Fisher) was added per well of a 96-well flat-bottom non–tissue-culture-coated plate, incubated overnight at 4°C, washed with PBS, blocked 1 hour with PBS plus 2% bovine serum albumin, and washed again. One hundred microliters of PBS plus biotinylated rhCD19 at the indicated concentrations was added per well, incubated for 30 minutes at 4°C, and washed again. For assays with OKT3, 100 μL PBS plus OKT3 was added per well, incubated overnight at 4°C, and washed with PBS.
For proliferation analyses, CAR-T were labeled in 0.25 μM carboxyfluorescein succinimidyl ester (CFSE) or CellTrace Violet (CTV) (ThermoFisher). 2.5 × 10⁴ or 7.5 × 10⁴ CAR-T were added to wells containing tumor cells or plate-bound rhCD19/OKT3, respectively. Twenty-four hours postplating, culture medium was analyzed for CAR-T cytokine production by Luminex, and CAR-T were fixed/permeabilized and stained for IL-2R receptor (IL-2R) and phosphoproteins or FACS-sorted for RNAseq. Separately, CFSE-labeled CAR-T were analyzed by flow cytometry for CFSE dilution after 72 hours of coculture with tumor. CTV-labeled CAR-T were transferred from rhCD19/OKT3-coated to uncoated plates after 24-hour stimulation and analyzed for CTV dilution 48 hours later.
Mouse experiments
6- to 8-week-old NOD.Cg-PrkdcscidIl2rgtm1Wjl/SzJ (NSG) mice were engrafted IV with 5 × 10⁵ CD19+/GFP+/firefly luciferase–positive Raji or JeKo-1 lymphoma. One week later, mice were treated IV with specified doses of CD19-specific CAR-T. CAR-T quantification in peripheral blood and tumor imaging were performed as described.40,43
Statistical analysis
Student paired and unpaired 2-tailed t tests, 1-way analysis of variance (ANOVA) with Dunnett posttests, and Mann-Whitney U tests were performed using Prism 9 (GraphPad). Raw cytokine values were log transformed prior to ANOVA analysis to achieve normal distribution. P values <.05 were considered significant.
Results
αNOTCH1 mAb induces NOTCH signaling during T-cell activation
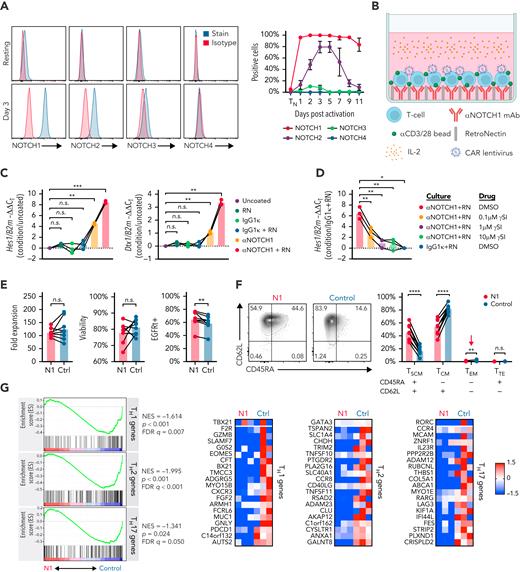
We measured NOTCH receptor surface expression in human CD4+ TN at rest and after activation with αCD3/CD28 mAb-coated beads and IL-2. Initial experiments were performed using CD4+ TN to avoid potential differences introduced by variable TN and TMEM frequencies between donors. Unstimulated CD4+ TN expressed low levels of NOTCH1 and no detectable NOTCH2, 3, or 4. Following activation, NOTCH1 was rapidly and uniformly upregulated and durably expressed, whereas NOTCH2 and NOTCH3 were upregulated more slowly and expressed transiently on a smaller fraction of cells (Figure 1A). These data suggested that NOTCH1 ligation would most uniformly induce NOTCH signaling early during in vitro activation.
NOTCH1 agonism during CD4+ TN activation results in a less differentiated phenotype. (A) Left: flow cytometry of NOTCH receptor expression compared with isotype in human CD4+ TN at rest (top) and 3 days after activation with αCD3/CD28 mAb-coated beads and IL-2 (bottom). Histograms show 1 representative donor. Right: percent of CD4+ TN expressing each NOTCH receptor at rest and over time after activation. N = 6 donors. (B) Schematic of the N1 culture method using αNOTCH1 mAb- and RetroNectin-coated plates. (C) Reverse transcription quantitative polymerase chain reaction evaluation of Hes1 (left) and Dtx1 (right) expression relative to B2m in activated CD4+ TN after 48 hours of culture on plates coated with different combinations of 2.5 μg/mL αNOTCH1 mAb, 2.5 μg/mL M IgG1κ, and 5 μg/mL RN. N = 3 donors. One-way ANOVA with Dunnett’s multiple comparisons test. ∗∗P < .01; ∗∗∗P < .005. (D) Expression of Hes1 relative to B2m in activated CD4+ TN after 48 hours of N1 culture in the presence of various doses of RO4929097 γ-secretase inhibitor (γSI). N = 3 donors. One-way ANOVA with Dunnett’s multiple comparisons test. ∗P < .05; ∗∗P < .01. (E) Fold expansion of N1 and control CD4+ T cells (left), viability assessed by propidium iodide exclusion (middle) and CAR lentivirus transduction rate (right) measured after 11 days of culture. N = 8 donors. Ratio-paired 2-tailed Student t test. ∗∗P < .01. (F) CD45RA and CD62L expression on N1 and control CD4+ CAR-T at day 11. Left: representative flow cytometry plots. Right: frequencies of N1 and control CD4+ CAR-T with TSCM, TCM, effector memory and terminal effector phenotypes across 11 donors. Ratio-paired 2-tailed Student t test. ∗∗P < .01; ∗∗∗∗P < .001. (G) Left: GSEA of RNAseq data from day 11 N1 and control CD4+ CAR-T. Right: heatmaps depict log2(normalized count/global average) for master regulator TFs and selected leading edge genes with a cutoff at 1.5-fold change. Significance was established at P and q both <.05 after correction for multiple hypothesis testing. See also supplemental Table 1. Ctrl, control; DMSO, dimethyl sulfoxide; FDR, false discovery rate; NES, normalized enrichment score; n.s., not significant; RN, RetroNectin.
NOTCH1 agonism during CD4+ TN activation results in a less differentiated phenotype. (A) Left: flow cytometry of NOTCH receptor expression compared with isotype in human CD4+ TN at rest (top) and 3 days after activation with αCD3/CD28 mAb-coated beads and IL-2 (bottom). Histograms show 1 representative donor. Right: percent of CD4+ TN expressing each NOTCH receptor at rest and over time after activation. N = 6 donors. (B) Schematic of the N1 culture method using αNOTCH1 mAb- and RetroNectin-coated plates. (C) Reverse transcription quantitative polymerase chain reaction evaluation of Hes1 (left) and Dtx1 (right) expression relative to B2m in activated CD4+ TN after 48 hours of culture on plates coated with different combinations of 2.5 μg/mL αNOTCH1 mAb, 2.5 μg/mL M IgG1κ, and 5 μg/mL RN. N = 3 donors. One-way ANOVA with Dunnett’s multiple comparisons test. ∗∗P < .01; ∗∗∗P < .005. (D) Expression of Hes1 relative to B2m in activated CD4+ TN after 48 hours of N1 culture in the presence of various doses of RO4929097 γ-secretase inhibitor (γSI). N = 3 donors. One-way ANOVA with Dunnett’s multiple comparisons test. ∗P < .05; ∗∗P < .01. (E) Fold expansion of N1 and control CD4+ T cells (left), viability assessed by propidium iodide exclusion (middle) and CAR lentivirus transduction rate (right) measured after 11 days of culture. N = 8 donors. Ratio-paired 2-tailed Student t test. ∗∗P < .01. (F) CD45RA and CD62L expression on N1 and control CD4+ CAR-T at day 11. Left: representative flow cytometry plots. Right: frequencies of N1 and control CD4+ CAR-T with TSCM, TCM, effector memory and terminal effector phenotypes across 11 donors. Ratio-paired 2-tailed Student t test. ∗∗P < .01; ∗∗∗∗P < .001. (G) Left: GSEA of RNAseq data from day 11 N1 and control CD4+ CAR-T. Right: heatmaps depict log2(normalized count/global average) for master regulator TFs and selected leading edge genes with a cutoff at 1.5-fold change. Significance was established at P and q both <.05 after correction for multiple hypothesis testing. See also supplemental Table 1. Ctrl, control; DMSO, dimethyl sulfoxide; FDR, false discovery rate; NES, normalized enrichment score; n.s., not significant; RN, RetroNectin.
We evaluated the effects of using plate-coated αNOTCH1 mAb to engage NOTCH1 during αCD3/CD28 stimulation of CD4+ TN. T cells were cultured at low density on RetroNectin-coated plates to promote adhesion and provide mechanical stress required to induce NOTCH signaling.48,49 This method allowed efficient lentiviral transduction of a CD19-specific CAR (Figure 1B). The NOTCH target genes Hes1 and Dtx1 were induced after CD4+ TN activation with plate-coated αNOTCH1, and their expression was further increased by RetroNectin (Figure 1C). NOTCH1-induced Hes1 expression was abrogated by γ-secretase inhibition, indicating the effect was NOTCH-dependent (Figure 1D). T cells cultured on RetroNectin and αNOTCH1 mAb (hereafter “N1”) exhibited equivalent fold expansion and viability and a higher transduction rate compared with cells cultured on RetroNectin and IgG1κ isotype (hereafter “control”) (Figure 1E).
NOTCH signaling during CD4+ TN activation promotes a less differentiated phenotype
Coculture of previously activated murine ovalbumin-specific and human Epstein-Barr virus–specific T cells with OP9/DLL1 to activate NOTCH resulted induced a less differentiated stem cell memory (TSCM) phenotype.23 We evaluated the phenotypes of CD4+ TN and N1 and control CAR-T derived from CD4+ TN at the end of culture (supplemental Figure 1A). More N1 CAR-T expressed CD45RA and CD62L and fewer expressed CD45RO than control cells, consistent with the TSCM phenotype (Figure 1F; supplemental Figure 1B). N1 and control cells expressed similar levels of CCR7, CD27, CD28, and TCF1 and uniformly expressed CD95, indicating transition from TN to TMEM (supplemental Figure 1B). Fewer N1 cells expressed the chemokine receptors CXCR3 or CCR4, which are associated with TH1 and TH2 differentiation, respectively, and are expressed by CD4+ TSCM less frequently than by central (TCM) or effector memory cells (supplemental Figure 1C).50,51 The phenotypic effects of N1 culture were independent of CAR construct (supplemental Figure 1D).
Endogenous CD4+ TSCM express lower levels of transcripts associated with TH1, TH2, and TH17 effector responses than TCM and effector memory cells.51 To investigate whether NOTCH-induced phenotypic changes were reflected at the transcriptomic level, we performed RNAseq of N1 and control CD4+ CAR-T at the end of culture. GSEA showed that N1 CAR-T expressed lower levels of TH1-, TH2-, and TH17-characteristic genes compared with control CAR-T52 (Figure 1G; supplemental Table 1). Together, the enriched TSCM phenotype and diminished CD4+ TH effector gene expression indicate that NOTCH1 agonism during CD4+ TN activation attenuates differentiation.
To compare specific NOTCH1 agonism to other strategies delivering nonspecific NOTCH signaling, we measured NOTCH target gene expression and surface phenotype in CD4+ TN after activation and culture with RetroNectin and either αNOTCH1 mAb, IgG1κ isotype, or recombinant DLL1-Fc.53 T cells cultured on saturating amounts of DLL1-Fc expressed Hes1 and Dtx1 levels and demonstrated CD45RA+ CD62L+ cell frequencies similar to N1 CD4+ T cells (supplemental Figure 1E-F).
We asked whether early NOTCH1 agonism mediated similar changes in CD4+ TMEM by isolating CD45RA− CD4+ TMEM and evaluating NOTCH receptor expression at rest and following activation. TMEM activation induced uniform and persistent NOTCH1 expression similar to TN (supplemental Figure 2A), but N1 culture induced only a minor TSCM population and little change in chemokine receptor expression (supplemental Figure 2B-C). We therefore focused further experiments on the effects of NOTCH1 signaling on CD4+ TN.
NOTCH alters CD4+ CAR-T cytokine production by inducing AhR and c-MAF
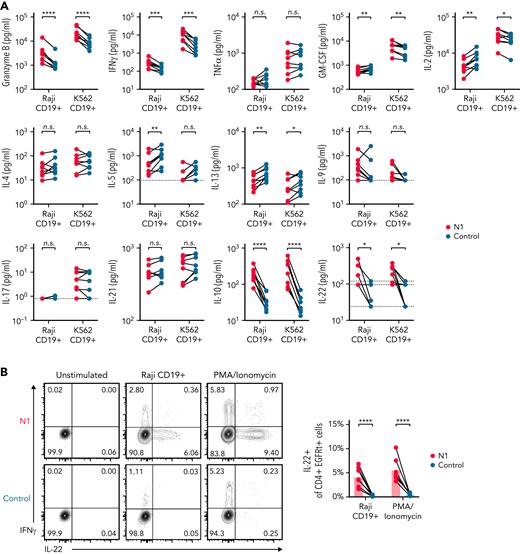
NOTCH can both direct production of specific cytokines11,54 and facilitate expression of master regulator TFs that drive TH effector cytokine production in murine T cells.7 In response to restimulation with tumor, N1 CD4+ CAR-T produced more granzyme B (GzmB) and interferon γ (IFNγ) than control CAR-T, similar tumor necrosis factor α (TNFα), variable amounts of IL-2 and granulocyte-macrophage colony-stimulating factor depending on tumor stimulus, and less IL-5 and IL-13 (Figure 2A). N1 cells produced markedly more IL-10 than control cells and, uniquely, produced IL-22 (Figure 2A). N1 and control cells produced similar amounts of IL-4, IL-9, IL-17, and IL-21 (Figure 2A). The effects of NOTCH1 agonism on cytokine production were independent of CAR costimulatory domains (supplemental Figure 3A). N1 primary culture supernatants contained elevated levels of IFNγ, GzmB, IL-10, and IL-22 after 3 days, indicating that NOTCH1 agonism imparted a functional program early after activation that endured upon restimulation (supplemental Figure 3B). To determine whether IL-22 and IFNγ were produced by the same cells, we performed intracellular staining of N1 and control CD4+ CAR-T after restimulation with phorbol 12-myristate 13-acetate (PMA)/ionomycin or Raji tumor. IL-22 was expressed only by N1 cells and was produced by a population distinct from those making IFNγ (Figure 2B).
NOTCH1 agonism alters cytokine production of CAR-T derived from CD4+ TN. (A) Luminex quantification of cytokines in culture medium after 24 hours of coculture of N1 and control CD4+ CAR-T with irradiated CD19+ Raji or K562 tumor cells. Dotted lines indicate limits of detection. N = 8 donors. Ratio-paired 2-tailed Student t test. ∗P < .05; ∗∗P < .01; ∗∗∗P < .005; ∗∗∗∗P < .001. (B) Intracellular staining for IL-22 and IFNγ after restimulation of N1 and control CD4+ CAR-T for 5 to 8 hours with PMA/ionomycin or CD19+ Raji tumor. Left: plots depict 1 donor representative of 7. Right: quantification of IL-22+ cell frequencies. Ratio-paired 2-tailed Student t test. ∗∗∗∗P < .001. n.s., not significant.
NOTCH1 agonism alters cytokine production of CAR-T derived from CD4+ TN. (A) Luminex quantification of cytokines in culture medium after 24 hours of coculture of N1 and control CD4+ CAR-T with irradiated CD19+ Raji or K562 tumor cells. Dotted lines indicate limits of detection. N = 8 donors. Ratio-paired 2-tailed Student t test. ∗P < .05; ∗∗P < .01; ∗∗∗P < .005; ∗∗∗∗P < .001. (B) Intracellular staining for IL-22 and IFNγ after restimulation of N1 and control CD4+ CAR-T for 5 to 8 hours with PMA/ionomycin or CD19+ Raji tumor. Left: plots depict 1 donor representative of 7. Right: quantification of IL-22+ cell frequencies. Ratio-paired 2-tailed Student t test. ∗∗∗∗P < .001. n.s., not significant.
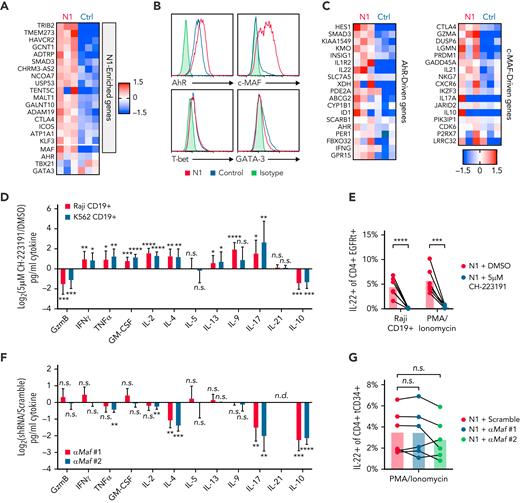
Differences in T-cell cytokine production can be driven by altered expression of TFs, particularly TH subset-defining master regulators.55 To profile TF and target gene expression, we performed RNAseq on N1 and control CD4+ CAR-T 3 days after activation, when cytokine differences were evident. N1 CAR-T were enriched for 18 genes, including the transcription factor Maf (c-MAF) (Figure 3A; supplemental Table 2). Though the differences did not rise to statistical significance, N1 CAR-T also expressed more Ahr (aryl hydrocarbon receptor, AhR), less Gata3 (GATA-3), and equivalent Tbx21 (T-bet) transcripts (Figure 3A). Intracellular staining confirmed these differences at the protein level (Figure 3B). Consistent with these findings, N1 cells expressed higher levels of AhR- and c-MAF–driven genes than control cells (Figure 3C).56-58
NOTCH1 agonism programs cytokine production by inducing AhR and c-MAF. (A) Ahr, Tbx21, Gata3 and genes enriched in N1 compared with control CD4+ CAR-T at day 3 of culture. Heatmaps depict log2(normalized count/global average) with a cutoff at 1.5-fold change. N = 3 donors per group. Significance was established as a minimum fold change of 1.5 and P < .05. See also supplemental Table 2. (B) Intracellular staining for AhR, c-MAF, T-bet, and GATA-3 in N1 and control CD4+ CAR-T at day 3 of culture. Histograms are representative of 5 donors. (C) Expression of AhR- and c-MAF–driven genes in N1 and control CD4+ CAR-T quantified by RNAseq on day 3 of culture. Heatmaps depict log2(normalized count/global average) with a cutoff at 1.5-fold change. N = 3 donors per group. (D) Luminex quantification of cytokine production by CD19-specific N1 CD4+ CAR-T grown in DMSO or 5 μM CH-223191 after 24 hours of coculture with irradiated CD19+ Raji or K562 tumor in absence of drug. Graph shows mean and standard deviation of relative sample values from 8 donors. Ratio-paired 2-tailed Student t test. ∗P < .05; ∗∗P < .01; ∗∗∗P < .005; ∗∗∗∗P < .001. (E) Intracellular staining for IL-22 in N1 CD4+ CAR-T grown in DMSO or 5 μM CH-223191 after restimulation for 5 to 8 hours with PMA/ionomycin or CD19+ Raji tumor. N = 6 donors. Ratio-paired 2-tailed Student t test. ∗∗∗P < .005; ∗∗∗∗P < .001. (F) Luminex quantification of cytokine production by N1 CD4+ T cells transduced with a scrambled or Maf-targeting shRNA after 24 hours of stimulation with PMA and ionomycin. Graph shows mean and standard deviation of relative sample values from 6 donors. One-way ANOVA of log-transformed pg/ml values with Dunnett’s multiple comparison testing. ∗∗P < .01; ∗∗∗P < .005; ∗∗∗∗P < .001. (G) Intracellular staining for IL-22 in N1 CD4+ T cells transduced with a scrambled or Maf-targeting shRNA after restimulation for 5 to 8 hours with PMA/ionomycin. N = 6 donors. One-way ANOVA of log-transformed pg/ml data with Dunnett’s multiple comparison testing. Ctrl, control; DMSO, dimethyl sulfoxide; n.s., not significant.
NOTCH1 agonism programs cytokine production by inducing AhR and c-MAF. (A) Ahr, Tbx21, Gata3 and genes enriched in N1 compared with control CD4+ CAR-T at day 3 of culture. Heatmaps depict log2(normalized count/global average) with a cutoff at 1.5-fold change. N = 3 donors per group. Significance was established as a minimum fold change of 1.5 and P < .05. See also supplemental Table 2. (B) Intracellular staining for AhR, c-MAF, T-bet, and GATA-3 in N1 and control CD4+ CAR-T at day 3 of culture. Histograms are representative of 5 donors. (C) Expression of AhR- and c-MAF–driven genes in N1 and control CD4+ CAR-T quantified by RNAseq on day 3 of culture. Heatmaps depict log2(normalized count/global average) with a cutoff at 1.5-fold change. N = 3 donors per group. (D) Luminex quantification of cytokine production by CD19-specific N1 CD4+ CAR-T grown in DMSO or 5 μM CH-223191 after 24 hours of coculture with irradiated CD19+ Raji or K562 tumor in absence of drug. Graph shows mean and standard deviation of relative sample values from 8 donors. Ratio-paired 2-tailed Student t test. ∗P < .05; ∗∗P < .01; ∗∗∗P < .005; ∗∗∗∗P < .001. (E) Intracellular staining for IL-22 in N1 CD4+ CAR-T grown in DMSO or 5 μM CH-223191 after restimulation for 5 to 8 hours with PMA/ionomycin or CD19+ Raji tumor. N = 6 donors. Ratio-paired 2-tailed Student t test. ∗∗∗P < .005; ∗∗∗∗P < .001. (F) Luminex quantification of cytokine production by N1 CD4+ T cells transduced with a scrambled or Maf-targeting shRNA after 24 hours of stimulation with PMA and ionomycin. Graph shows mean and standard deviation of relative sample values from 6 donors. One-way ANOVA of log-transformed pg/ml values with Dunnett’s multiple comparison testing. ∗∗P < .01; ∗∗∗P < .005; ∗∗∗∗P < .001. (G) Intracellular staining for IL-22 in N1 CD4+ T cells transduced with a scrambled or Maf-targeting shRNA after restimulation for 5 to 8 hours with PMA/ionomycin. N = 6 donors. One-way ANOVA of log-transformed pg/ml data with Dunnett’s multiple comparison testing. Ctrl, control; DMSO, dimethyl sulfoxide; n.s., not significant.
We next evaluated whether AhR and c-MAF influenced N1 CD4+ CAR-T cytokine production in response to tumor. The role of AhR was assessed by growing N1 CD4+ CAR-T in the continuous presence an AhR inhibitor (CH-223191), then restimulating cells with CD19+ tumor or PMA/ionomycin and assaying cytokine production in supernatants by Luminex or by intracellular staining. AhR inhibition abolished IL-22 production by N1 CAR-T and reduced IL-10 and GzmB but enhanced production of IFNγ, TNFα, granulocyte-macrophage colony-stimulating factor, IL-2, IL-4, IL-13, IL-9, and IL-17 (Figure 3D-E; supplemental Figure 3C). These data indicate a dual role for AhR, both driving IL-22, IL-10, and GzmB secretion and restricting production of other cytokines induced in CD4+ TN by NOTCH signaling during activation.
To evaluate c-MAF, N1 CD4+ T-cells were transduced with a lentiviral vector encoding tCD34 and an shRNA either containing a scrambled sequence or targeting Maf. Two Maf-specific shRNAs both reduced c-MAF expression in N1 cells by half (supplemental Figure 3D). Scrambled and Maf-targeted N1 cells were isolated by CD34 selection, rested overnight, then restimulated with PMA/ionomycin. c-MAF knockdown reduced N1 cell IL-4 and IL-17 secretion and inhibited IL-10 production to an even greater extent than AhR antagonism but had no effect on GzmB, IFNγ, or IL-22 production (Figure 3F-G; supplemental Figure 3E). These data indicate that c-MAF, together with AhR, promotes IL-10 production in the setting of NOTCH signaling but does not limit IFNγ or IL-2 production as observed in other contexts.58,59
NOTCH1 agonism enhances CD4+ CAR-T proliferation and antigen sensitivity
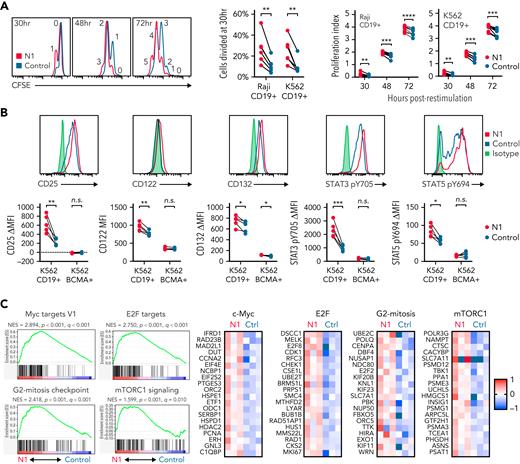
Less differentiated tumor-specific T cells demonstrate superior proliferation capacity and antitumor efficacy in vivo.28,60 To assess whether NOTCH1 agonism altered CAR-T proliferative capacity, CFSE-labeled N1 and control CD4+ CAR-T were cocultured with CD19+ tumors and evaluated by flow cytometry over time. More N1 than control CAR-T divided after 30 hours of stimulation, and this early proliferation advantage persisted over 3 days (Figure 4A). ROR1-specific N1 4-1BB/CD3ζ or CD28/CD3ζ CAR-T also proliferated more than control CAR-T after coculture with ROR1+ tumor (supplemental Figure 4A), indicating the effect of NOTCH1 agonism on CD4+ CAR-T proliferation was independent of target antigen or costimulatory domain.
N1 CD4+ CAR-T proliferate more than control CD4+ CAR-T in response to CD19+ tumor. (A) CFSE dilution by CD19-specific N1 and control CD4+ CAR-T after coculture with irradiated CD19+ Raji or K562 tumor cells. Left: flow cytometry plots are representative of 6 to 9 donors per timepoint. Percent cells divided (middle) and proliferation index (average number of divisions) at various timepoints after stimulation (right) are shown for individual donors. Paired Student 2-tailed t test. ∗∗P < .01; ∗∗∗P < .005; ∗∗∗∗P < .001. (B) Expression of IL-2R chains, STAT3 pY705, and STAT5 pY694 in CD19-specific N1 and control CD4+ CAR-T after 24 hours of coculture with CD19+ or CD19−/BCMA+ K562 tumor cells. Top: histograms depict expression following CD19+ K562 restimulation representative of 5 donors. Bottom: IL-2R and phosphoSTAT expression in CAR-T following coculture with CD19+ or CD19− BCMA+ tumor cells. Ratio-paired Student 2-tailed t test. ∗P < .05; ∗∗P < .01; ∗∗∗P < .005. (C) Left: GSEA of RNAseq data generated from FACS-isolated CD19-specific N1 and control CD4+ CAR-T after 24 hours of coculture with CD19+ K562 tumor cells. Right: heatmaps depict log2(normalized count/global average) for leading edge genes. Significance was established at P and q both <.05 after correction for multiple hypothesis testing. See also supplemental Tables 3 and 4. Ctrl, control; NES, normalized enrichment score.
N1 CD4+ CAR-T proliferate more than control CD4+ CAR-T in response to CD19+ tumor. (A) CFSE dilution by CD19-specific N1 and control CD4+ CAR-T after coculture with irradiated CD19+ Raji or K562 tumor cells. Left: flow cytometry plots are representative of 6 to 9 donors per timepoint. Percent cells divided (middle) and proliferation index (average number of divisions) at various timepoints after stimulation (right) are shown for individual donors. Paired Student 2-tailed t test. ∗∗P < .01; ∗∗∗P < .005; ∗∗∗∗P < .001. (B) Expression of IL-2R chains, STAT3 pY705, and STAT5 pY694 in CD19-specific N1 and control CD4+ CAR-T after 24 hours of coculture with CD19+ or CD19−/BCMA+ K562 tumor cells. Top: histograms depict expression following CD19+ K562 restimulation representative of 5 donors. Bottom: IL-2R and phosphoSTAT expression in CAR-T following coculture with CD19+ or CD19− BCMA+ tumor cells. Ratio-paired Student 2-tailed t test. ∗P < .05; ∗∗P < .01; ∗∗∗P < .005. (C) Left: GSEA of RNAseq data generated from FACS-isolated CD19-specific N1 and control CD4+ CAR-T after 24 hours of coculture with CD19+ K562 tumor cells. Right: heatmaps depict log2(normalized count/global average) for leading edge genes. Significance was established at P and q both <.05 after correction for multiple hypothesis testing. See also supplemental Tables 3 and 4. Ctrl, control; NES, normalized enrichment score.
Activated T cells produce IL-2 and upregulate IL-2R, enabling signaling through STAT3 and STAT5 that drives proliferation.61 We measured IL-2R chain expression and STAT3 and STAT5 activation in N1 and control CD4+ CAR-T by flow cytometry after 24 hours coculture with CD19+ or CD19− K562 cells. N1 CAR-T upregulated CD25, CD122, and CD132 and phosphorylated STAT3 Y705 and STAT5 Y694 to greater extents than control CAR-T in response to CD19+ but not CD19− tumor (Figure 4B). RNAseq of N1 and control CAR-T cocultured with CD19+ K562 showed that N1 cells were strongly enriched for expression of genes involved in c-Myc, E2F and mTORC1 activity, and G2-mitosis progression compared with control cells47,62 (Figure 4C; supplemental Tables 3 and 4). Together, these data indicated NOTCH1 agonism during CD4+ TN activation conferred a cell state capable of an enhanced proliferative response to subsequent antigen encounter.
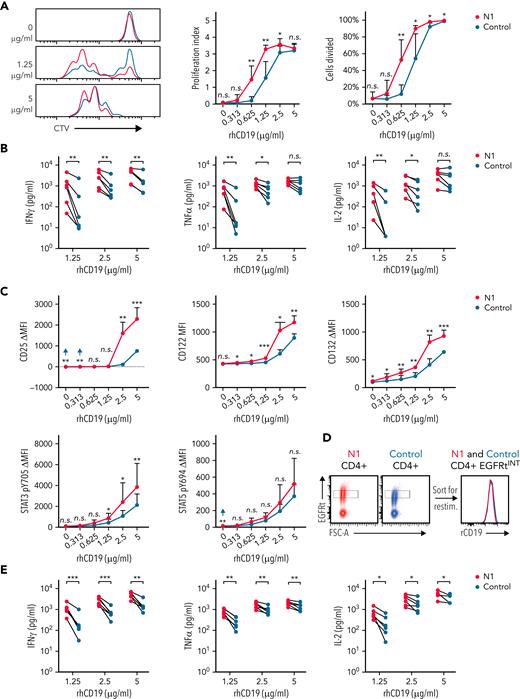
The increased proliferative capacity of NOTCH1-agonized CD4+ CAR-T could result from enhanced antigen recognition. To test this, CTV-labeled CD19-specific N1 and control CD4+ CAR-T were restimulated on plates coated with titrated rhCD19. At low rhCD19 densities, more N1 than control CAR-T had divided after 72 hour, and N1 cells proliferated more on average than control cells (Figure 5A). N1 CAR-T also produced more IFNγ, TNFα, and IL-2 and upregulated IL-2R chains and phosphorylated STAT3 to a greater extent than control CAR-T at low antigen densities (Figure 5B-C). Thus, NOTCH1 agonism heightens CD4+ CAR-T antigen sensitivity independently of any potential differential costimulatory or coinhibitory receptor engagement by tumor.
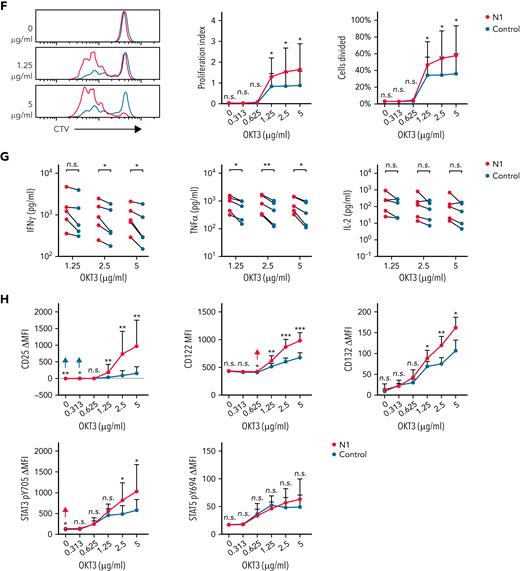
NOTCH1 agonism enhances CD4+ CAR-T proliferation and cytokine production in response to antigen. (A) CTV dilution by CD19-specific N1 and control CD4+ CAR-T 72 hours after restimulation on plates coated with various concentrations of rhCD19. Left: histograms of 1 donor representative of 6. Right: percent CAR-T divided and proliferation index at 72 hours. Paired 2-tailed Student t test. ∗P < .05; ∗∗P < .01. (B) Luminex quantification of cytokine production by CD19-specific N1 or control CD4+ CAR-T after 24 hours restimulation on plate-coated rhCD19. N = 6 donors. Ratio-paired 2-tailed Student t test. ∗P < .05; ∗∗P < .01. (C) Flow cytometry analysis of IL-2R chain, STAT3 pY705, and STAT5 pY694 expression by CD19-specific N1 or control CD4+ CAR-T after 24 hours restimulation on plate-coated rhCD19. N = 5 donors. Ratio-paired 2-tailed Student t test. ∗P < .05; ∗∗P < .01; ∗∗∗P < .005. (D) Schematic depicting sorting of EGFRtINT N1 and control CD4+ CAR-T (left) and the CAR expression levels of the sorted cells (right). Representative histograms of 6 donors. (E) Luminex quantification of cytokine production by CD19-specific EGFRtINT N1 and control CD4+ CAR-T after 24 hours restimulation on plate-coated rhCD19. N = 6 donors. Ratio-paired 2-tailed Student t test. ∗P < .05; ∗∗P < .01; ∗∗∗P < .005. (F) CTV dilution by untransduced N1 and control CD4+ T cells after 24 hours restimulation on plate-coated agonistic αCD3 mAb (OKT3) followed by 48 hours of culture on uncoated plates. Representative plots of 5 donors. Paired 2-tailed Student t test. ∗P < .05. (G) Luminex quantification of cytokine production by untransduced N1 and control CD4+ T cells after 24 hours restimulation on plate-coated OKT3. N = 5 donors. Ratio-paired 2-tailed Student t test. ∗P < .05; ∗∗P < .01. (H) Flow cytometry analysis of IL-2R chain, STAT3 pY705, and STAT5 pY694 expression by untransduced N1 and control CD4+ T cells after 24 hours restimulation on plate-coated OKT3. N = 6 donors. Ratio-paired 2-tailed Student t test. ∗P < .05; ∗∗P < .01; ∗∗∗P < .005. FSC-A, forward scatter area; n.s., not significant.
NOTCH1 agonism enhances CD4+ CAR-T proliferation and cytokine production in response to antigen. (A) CTV dilution by CD19-specific N1 and control CD4+ CAR-T 72 hours after restimulation on plates coated with various concentrations of rhCD19. Left: histograms of 1 donor representative of 6. Right: percent CAR-T divided and proliferation index at 72 hours. Paired 2-tailed Student t test. ∗P < .05; ∗∗P < .01. (B) Luminex quantification of cytokine production by CD19-specific N1 or control CD4+ CAR-T after 24 hours restimulation on plate-coated rhCD19. N = 6 donors. Ratio-paired 2-tailed Student t test. ∗P < .05; ∗∗P < .01. (C) Flow cytometry analysis of IL-2R chain, STAT3 pY705, and STAT5 pY694 expression by CD19-specific N1 or control CD4+ CAR-T after 24 hours restimulation on plate-coated rhCD19. N = 5 donors. Ratio-paired 2-tailed Student t test. ∗P < .05; ∗∗P < .01; ∗∗∗P < .005. (D) Schematic depicting sorting of EGFRtINT N1 and control CD4+ CAR-T (left) and the CAR expression levels of the sorted cells (right). Representative histograms of 6 donors. (E) Luminex quantification of cytokine production by CD19-specific EGFRtINT N1 and control CD4+ CAR-T after 24 hours restimulation on plate-coated rhCD19. N = 6 donors. Ratio-paired 2-tailed Student t test. ∗P < .05; ∗∗P < .01; ∗∗∗P < .005. (F) CTV dilution by untransduced N1 and control CD4+ T cells after 24 hours restimulation on plate-coated agonistic αCD3 mAb (OKT3) followed by 48 hours of culture on uncoated plates. Representative plots of 5 donors. Paired 2-tailed Student t test. ∗P < .05. (G) Luminex quantification of cytokine production by untransduced N1 and control CD4+ T cells after 24 hours restimulation on plate-coated OKT3. N = 5 donors. Ratio-paired 2-tailed Student t test. ∗P < .05; ∗∗P < .01. (H) Flow cytometry analysis of IL-2R chain, STAT3 pY705, and STAT5 pY694 expression by untransduced N1 and control CD4+ T cells after 24 hours restimulation on plate-coated OKT3. N = 6 donors. Ratio-paired 2-tailed Student t test. ∗P < .05; ∗∗P < .01; ∗∗∗P < .005. FSC-A, forward scatter area; n.s., not significant.
Although N1 and control culture yielded similar transduction efficiencies, N1 CD4+ CAR-T expressed higher levels of CARs and transduction markers than control CAR-T (supplemental Figure 4B), providing a possible explanation for heightened N1 CAR-T antigen sensitivity. To control for CAR expression, we sorted EGFRt-intermediate (EGFRtINT) N1 and control CD4+ CAR-T with similar CAR expression (Figure 5D) and restimulated them on rhCD19-coated plates. EGFRtINT N1 CAR-T produced more cytokine than EGFRtINT control CAR-T (Figure 5E), indicating NOTCH1 agonism enhanced T-cell responsiveness to CAR signaling irrespective of CAR expression. We further asked whether this enhanced responsiveness translated to signaling through CD3, which was expressed equivalently by N1 and control CD4+ T-cells (supplemental Figure 4C). Mirroring responses to low rhCD19 levels, untransduced N1 CD4+ T-cells stimulated over a range of plate-bound αCD3 OKT3 mAb concentrations exhibited greater proliferation, IFNγ and TNFα production, IL-2R chain upregulation, and STAT3 phosphorylation than control CD4+ T-cells (Figure 5F-H). These data show that NOTCH1-agonized CD4+ T- cells are intrinsically capable of heightened responses to low antigen levels via both CAR and TCR signaling.
NOTCH1 agonism enhances CD4+ CAR-T proliferation in mice bearing lymphoma xenografts
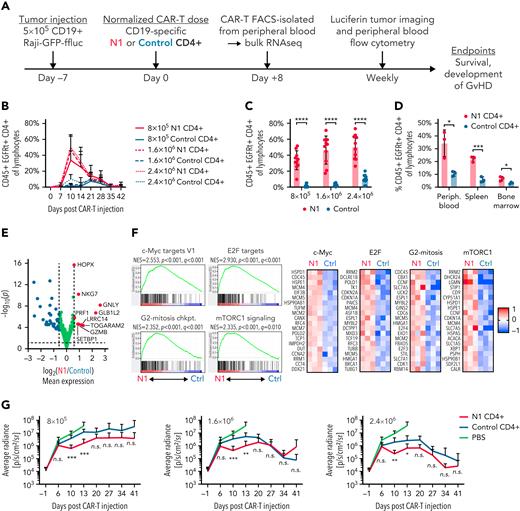
The phenotypic and functional characteristics imparted by NOTCH1 agonism suggested N1 CD4+ CAR-T might exhibit superior antitumor activity in vivo. NSG mice were engrafted with CD19+ Raji lymphoma, treated 7 days later with CD19-targeting N1 or control CD4+ CAR-T, and monitored for CAR-T expansion and changes in tumor burden (Figure 6A). N1 CD4+ CAR-T rose to markedly higher peak frequencies in the blood than control CAR-T, and analysis of paired blood, splenocytes, and bone marrow demonstrated higher N1 CD4+ CAR-T numbers at all sites (Figure 6B-D; supplemental Figure 5A). Neither N1 nor control CD4+ CAR-T expanded in non–tumor-bearing mice, indicating tumor recognition drove T-cell expansion and that NOTCH1 agonism did not promote T-cell transformation (supplemental Figure 5B).
NOTCH1 agonism enhances CD4+ CAR-T proliferation in mice bearing lymphoma xenografts. (A) Experimental schematic for the xenograft model. (B) Frequencies of N1 and control CD4+ CAR-T in peripheral blood over time following injection into tumor-bearing mice. N = 10 mice per group, 2 donors. (C) Frequencies of N1 and control CD4+ CAR-T at peak expansion 10 days posttransfer into tumor-bearing mice. N = 10 mice per group, 2 donors. Unpaired 2-tailed Student t test. ∗∗∗∗P < .001. (D) Frequencies of N1 and control CD4+ CAR-T in peripheral blood, spleen, and bone marrow of tumor-bearing mice treated with 1.6 × 10⁶ N1 or control CD4+ CAR-T 14 days posttreatment. N = 3 mice per group, 1 donor. Unpaired 2-tailed Student t test. ∗P < .05; ∗∗∗P < .005. (E) Gene expression by RNAseq of N1 and control CD4+ CAR-T FACS isolated from peripheral blood 8 days posttransfer into tumor-bearing mice. N = 3 mice per group, 1 donor. Significance was established at P < .05 and fold change > 1.5. See also supplemental Table 5. (F) Left: GSEA of RNAseq generated from N1 and control CD4+ CAR-T FACS-isolated from peripheral blood 8 days posttransfer into tumor-bearing mice. N = 3 mice per group, 1 donor. Right: heatmaps depict log2(normalized count/global average) for selected leading-edge genes with a cutoff at 1. Significance was established at P and q both <.05 after correction for multiple hypothesis testing. See also supplemental Table 6. (G) Tumor burden over time in mice treated with N1 or control CD4+ CAR-T, evaluated by intraperitoneal luciferin injection and bioluminescent imaging. N = 10 mice per group, 2 donors. Mann-Whitney U test. ∗P < .05; ∗∗P < .01; ∗∗∗P < .005. Ctrl, control; GvHD, graft-versus-host disease; n.s., not significant.
NOTCH1 agonism enhances CD4+ CAR-T proliferation in mice bearing lymphoma xenografts. (A) Experimental schematic for the xenograft model. (B) Frequencies of N1 and control CD4+ CAR-T in peripheral blood over time following injection into tumor-bearing mice. N = 10 mice per group, 2 donors. (C) Frequencies of N1 and control CD4+ CAR-T at peak expansion 10 days posttransfer into tumor-bearing mice. N = 10 mice per group, 2 donors. Unpaired 2-tailed Student t test. ∗∗∗∗P < .001. (D) Frequencies of N1 and control CD4+ CAR-T in peripheral blood, spleen, and bone marrow of tumor-bearing mice treated with 1.6 × 10⁶ N1 or control CD4+ CAR-T 14 days posttreatment. N = 3 mice per group, 1 donor. Unpaired 2-tailed Student t test. ∗P < .05; ∗∗∗P < .005. (E) Gene expression by RNAseq of N1 and control CD4+ CAR-T FACS isolated from peripheral blood 8 days posttransfer into tumor-bearing mice. N = 3 mice per group, 1 donor. Significance was established at P < .05 and fold change > 1.5. See also supplemental Table 5. (F) Left: GSEA of RNAseq generated from N1 and control CD4+ CAR-T FACS-isolated from peripheral blood 8 days posttransfer into tumor-bearing mice. N = 3 mice per group, 1 donor. Right: heatmaps depict log2(normalized count/global average) for selected leading-edge genes with a cutoff at 1. Significance was established at P and q both <.05 after correction for multiple hypothesis testing. See also supplemental Table 6. (G) Tumor burden over time in mice treated with N1 or control CD4+ CAR-T, evaluated by intraperitoneal luciferin injection and bioluminescent imaging. N = 10 mice per group, 2 donors. Mann-Whitney U test. ∗P < .05; ∗∗P < .01; ∗∗∗P < .005. Ctrl, control; GvHD, graft-versus-host disease; n.s., not significant.
RNAseq of N1 and control CD4+ CAR-T isolated from tumor-bearing mouse blood 8 days posttransfer showed that N1 cells expressed higher levels of genes involved in T-cell cytotoxicity, including Gzmb, Gnly, Prf1, and Nkg7 (Figure 6E; supplemental Table 5). N1 cells were also strongly enriched for gene signatures of cell cycle progression and c-Myc, E2F, and mTORC1 activity compared with control cells, similar to transcriptional differences observed after tumor recognition in vitro (Figure 6F; supplemental Table 6). GSEA further revealed strong skewing of N1 CAR-T toward TH1-like and away from TH2-like gene expression relative to control CAR-T (supplemental Figure 5C). In line with these transcriptomic findings, a higher fraction of N1 CAR-T harvested from marrow and restimulated with PMA/ionomycin produced IFNγ (supplemental Figure 5D). The pronounced TH1-like N1 CAR-T effector response was accompanied by transiently enhanced tumor regression compared with control cells, but this effect was modest and did not persist (Figure 6G; supplemental Figure 5E). These data demonstrate that NOTCH1 agonism strikingly improves CD4+ CAR-T proliferative potential and skews cells toward a TH1-like fate in vivo but does not enhance tumor control by CD4+ CAR-T alone.
N1 CD4+ CAR-T markedly enhance CD8+ CAR-T proliferation and antitumor efficacy
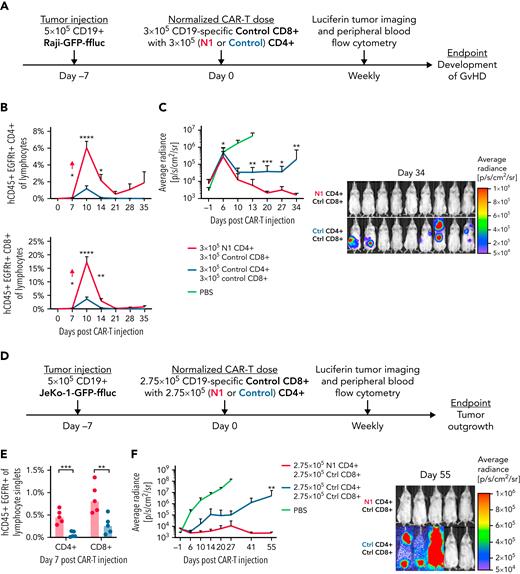
Although CD8+ T cells are often the primary mediators of antitumor responses, CD4+ T cells can enhance, and in some cases are required for, CD8+ T-cell antitumor efficacy.27,28,42,63-65 The striking difference in expansion between N1 and control CD4+ CAR-T in tumor-bearing mice suggested that NOTCH1 agonism might improve the ability of CD4+ CAR-T to support CD8+ CAR-T proliferation and function. To test this, NSG mice bearing Raji lymphoma were treated with 3 × 10⁵ control CD8+ CAR-T and either 3 × 10⁵ N1 or 3 × 10⁵ control CD4+ CAR-T (Figure 7A). N1 CD4+ CAR-T rose to higher peak frequencies in the peripheral blood than control CD4+ CAR-T and promoted much greater expansion of control CD8+ CAR-T (Figure 7B). The enhanced CAR-T expansion in mice treated with N1 CD4+ and control CD8+ CAR-T drove rapid and complete tumor regression in all mice, whereas half of mice treated with control CD4+ and CD8+ CAR-T failed to regress tumor (Figure 7C; supplemental Figure 6A).
N1 CD4+ CAR-T enhance CD8+ CAR-T proliferation and antitumor efficacy. (A) Experiment schematic for the Raji xenograft model. (B) Flow cytometry quantification of CD4+ (top) and CD8+ (bottom) CAR-T frequencies in peripheral blood over time following injection into Raji-bearing mice. N = 10 mice per group, 2 experiments. Unpaired 2-tailed Student t test. ∗P < .05; ∗∗P < .01; ∗∗∗∗P < .001. (C) Raji tumor burden over time (left) and 34 days post–CAR-T injection (right) in mice treated with control CD8+ and either N1 or control CD4+ CAR-T, measured by intraperitoneal luciferin injection. N = 10 mice per group, 2 experiments. Mann-Whitney U test. ∗P < .05; ∗∗P < .01; ∗∗∗P < .005. (D) Experiment schematic for the JeKo-1 xenograft model. (E) Flow cytometry quantification of CD4+ and CD8+ CAR-T frequencies in peripheral blood at peak expansion 7 days after injection into JeKo-1–bearing mice. N = 5 mice per group, 1 experiment. Unpaired 2-tailed Student t test. ∗∗P < .01; ∗∗∗P < .005. (F) JeKo-1 tumor burden over time (left) and 55 days post–CAR-T injection (right) in mice treated with control CD8+ and either N1 or control CD4+ CAR-T, measured by intraperitoneal luciferin injection. N = 5 mice per group, 1 experiment. Mann-Whitney U test. ∗∗P < .01. Ctrl, control; GvHD, graft-versus-host disease.
N1 CD4+ CAR-T enhance CD8+ CAR-T proliferation and antitumor efficacy. (A) Experiment schematic for the Raji xenograft model. (B) Flow cytometry quantification of CD4+ (top) and CD8+ (bottom) CAR-T frequencies in peripheral blood over time following injection into Raji-bearing mice. N = 10 mice per group, 2 experiments. Unpaired 2-tailed Student t test. ∗P < .05; ∗∗P < .01; ∗∗∗∗P < .001. (C) Raji tumor burden over time (left) and 34 days post–CAR-T injection (right) in mice treated with control CD8+ and either N1 or control CD4+ CAR-T, measured by intraperitoneal luciferin injection. N = 10 mice per group, 2 experiments. Mann-Whitney U test. ∗P < .05; ∗∗P < .01; ∗∗∗P < .005. (D) Experiment schematic for the JeKo-1 xenograft model. (E) Flow cytometry quantification of CD4+ and CD8+ CAR-T frequencies in peripheral blood at peak expansion 7 days after injection into JeKo-1–bearing mice. N = 5 mice per group, 1 experiment. Unpaired 2-tailed Student t test. ∗∗P < .01; ∗∗∗P < .005. (F) JeKo-1 tumor burden over time (left) and 55 days post–CAR-T injection (right) in mice treated with control CD8+ and either N1 or control CD4+ CAR-T, measured by intraperitoneal luciferin injection. N = 5 mice per group, 1 experiment. Mann-Whitney U test. ∗∗P < .01. Ctrl, control; GvHD, graft-versus-host disease.
We then tested whether N1 CD4+ CAR-T could mediate enhanced helper function against CD19+ JeKo-1 lymphoma, which expresses lower levels of costimulatory molecules supportive of T-cell proliferation (supplemental Figure 6B). Mice were engrafted with JeKo-1 lymphoma and treated 7 days later with 2.75 × 10⁵ control CD8+ CAR-T and either 2.75 × 10⁵ N1 or 2.75 × 10⁵ control CD4+ CAR-T targeting CD19 (Figure 7D). Both CD4+ and CD8+ CAR-T rose to higher peak frequencies in mice treated with N1 compared with control CD4+ CAR-T (Figure 7E). All mice treated with N1 CD4+ CAR-T experienced curative antitumor responses, whereas most CD4+ CAR-T–treated mice failed to control tumor long-term (Figure 7F; supplemental Figure 6C). Thus, NOTCH1 agonism during ex vivo culture enhanced CD4+ CAR-T capacity to support CD8+ CAR-T proliferation and promote durable antitumor function in vivo.
Discussion
CAR-T therapy effectively treats refractory hematologic malignancies,25 but responses vary depending on CAR-T differentiation state, expansion, and persistence in vivo.26,66-71 NOTCH signaling induced by coculture of previously activated human CD8+ CAR-T with OP9/DLL1 and IL-7 promoted a TSCM phenotype and improved antitumor activity, in part by inducing FOXM1.39 How NOTCH signaling alters human CD4+ CAR-T phenotype and function has not been studied. Here, we developed a cell-free culture system to simultaneously activate T cells and induce NOTCH signaling during CAR-T production. Culture on immobilized αNOTCH1 mAb strongly induced NOTCH target genes, demonstrating that existing GMP antibody manufacturing processes could be leveraged to deliver cell-free NOTCH signaling during clinical tumor-specific T-cell production. Contrasting prior work,23 early NOTCH1 agonism efficiently induced a TSCM phenotype in CAR-T grown from CD4+ TN but not TMEM, indicating that the mechanisms by which NOTCH signaling alters T-cell differentiation may be context- and T-cell subset-dependent.
NOTCH signaling during CD4+ TN priming facilitates cytokine and master regulator TF expression, amplifying other polarizing signals.7 Under stimulation conditions conducive to efficient CAR-T production, NOTCH1 agonism enhanced IFNγ, GzmB, IL-10, and IL-22 production. Different populations of N1 CD4+ CAR-T produced IFNγ and IL-22, indicating that NOTCH signaling permitted distinct cell fates and might be used to generate diverse TH subsets for different applications in adoptive cell therapy. The effects of NOTCH signaling on CD4+ T-cell cytokine production have often been studied through the lens of master regulator TFs; here, we observed that NOTCH instead controls cytokine production primarily by inducing AhR and c-MAF. AhR drove N1 CD4+ CAR-T production of IL-22, IL-10, and GzmB, in agreement with studies documenting its role transactivating these genes.72-74 Moreover, AhR antagonism during N1 culture disinhibited production of other CD4+ effector cytokines, suggesting that NOTCH-induced AhR restrains overexpression of inflammatory cytokines during CD4+ TH responses. In conjunction with findings that attenuation of AhR activation can improve CD8+ T-cell antitumor activity,75 our data invite further inquiry into whether manipulating AhR activity might improve T-cell function in cancer immunotherapy.
NOTCH-induced c-MAF also promoted IL-10 production, consistent with a recent report76 and c-MAF’s described cooperation with AhR in programming T regulatory type 1 (TR1) characteristics.77-79 N1 CD4+ CAR-T did not exhibit regulatory activity in xenogeneic lymphoma models, instead providing robust help to CD8+ CAR-T and promoting curative antitumor responses. N1 cells lacked key TR1 traits, including CD49b and LAG3 coexpression, IL-21 secretion, and reduced IL-2 production.78-80 However, it is possible that NOTCH1-agonized CD4+ T cells could mediate TR1-like regulatory effects in an immunocompetent syngeneic setting, in which antigen-presenting cells play critical roles in T-cell antitumor responses. Our findings add to the known pathways through which NOTCH can alter CD4+ T-cell function and indicate that unbiased profiling strategies might identify additional novel behaviors initiated by NOTCH in other activation settings.
Unexpectedly, NOTCH1 agonism during CD4+ TN activation rendered T cells more responsive to activation through the CAR or TCR. Restimulated N1 CD4+ T cells strongly upregulated expression of IL-2R chains and activated STATs and genes associated with T-cell activation and proliferation, translating into improved proliferation and TH1 function in vivo. Although N1 CD4+ CAR-T did not control tumor more effectively, they provided markedly better help to cotransferred CD8+ CAR-T, supporting CD8+ expansion to higher frequencies in vivo and driving curative antitumor responses. N1 CD4+ CAR-T enabled potent CD8+ CAR-T antitumor responses at low doses, suggesting NOTCH activation during CD4+ CAR-T production might be leveraged to improve both therapeutic efficacy and safety.
In summary, NOTCH1 signaling provided concurrently with CD3/CD28 stimulation restricted differentiation during CAR-T production from human CD4+ TN, generating a cell product that responded to low levels of antigen, proliferated robustly, and provided superior help to cotransferred CD8+ CAR-T. We identified AhR and c-MAF as transcriptional mediators of NOTCH-induced changes to CD4+ T-cell cytokine production, expanding the mechanisms by which NOTCH can shape TH behavior beyond modulation of master regulator TF expression. Our data demonstrate that short-term antibody-based NOTCH1 agonism during ex vivo culture is a viable strategy for enhancing tumor-specific T-cell performance.
Acknowledgments
The authors thank S. Lee (Fred Hutchinson Cancer Research Center) for providing unmodified SGEP plasmid, as well as members of Shared Resources at the Fred Hutchinson Cancer Research Center for their help: E. Gad, D. Parrilla, L. King, and M. Jess for performing mouse experiments; R. Lawler and E. Griffiths for performing Luminex assays; C. Sather and D. Covarrubias for assistance with Aseq; and R. Reeves, B. Janoschek, B. Raden, and A. Berger for assistance with flow cytometry and FACS.
This work was supported by National Institutes of Health National Cancer Institute CA257088-02 (A.B.W.) and CA114536 (S.R.R.), by the Department of Defense BC190327P1 (S.R.R.), and by research funding from Lyell ImmunoPharma (S.R.R.). S.R.R. is an American Cancer Society research professor.
Authorship
Contribution: A.B.W., E.C.F., M.J.P., G.O.C., S.M.S., and M.R.H. performed experiments; I.L. developed the plate-bound rhCD19 assay and profiled tumor cell costimulatory molecule expression; A.B.W. and S.N.F. analyzed RNAseq data; A.B.W., I.D.B., and S.R.R. conceived and designed the experiments; and A.B.W. and S.R.R. wrote the paper.
Conflict-of-interest disclosure: S.R.R. is a cofounder and shareholder of Lyell Immunopharma and has received grant funding and has intellectual property licensed to Lyell Immunopharma. S.R.R. was a founder of Juno Therapeutics, a Bristol Myers Squibb company, and has served as a scientific advisor to Juno Therapeutics and Adaptive Biotechnologies. I.D.B. has received grant funding from and owns shares of Lyell Immunopharma. M.J.P. has equity interest in Lyell Immunopharma, has received consulting income from SpringWorks Therapeutics, is currently employed by CellPoint B.V., and has equity interest in CellPoint B.V. The remaining authors declare no competing financial interests.
The current affiliation for M.J.P. is CellPoint B.V.
Correspondence: Stanley R. Riddell, 1100 Fairview Ave N, S2-207, Seattle, WA 98109; e-mail: sriddell@fredhutch.org.
References
Author notes
RNAseq data are available in the online supplement and at the Gene Expression Omnibus (GEO) under accession number GSE207315.
Contact sriddell@fredhutch.org for other data requests.
The online version of this article contains a data supplement.
There is a Blood Commentary on this article in this issue.
The publication costs of this article were defrayed in part by page charge payment. Therefore, and solely to indicate this fact, this article is hereby marked “advertisement” in accordance with 18 USC section 1734.

This feature is available to Subscribers Only
Sign In or Create an Account Close Modal