

TO THE EDITOR:
COVID-19 is caused by severe acute respiratory syndrome-coronavirus-2 (SARS-CoV-2) containing the spike (S) and nucleocapsid (N) proteins.1,2 The S protein consists of the S1 and S2 components, and the virus enters the cells through binding of the receptor-binding domain (RBD) within the S1 protein3 to the angiotensin-converting enzyme-2 receptor.1,4 Unfortunately, patients with hematologic malignancies have dramatically increased mortality rates after SARS-CoV-2 infection,5,6 and patients infected after treatment with chimeric antigen receptor T-cell (CART) treatment for B-cell malignancies experience mortality rates as high as 33%.7
The development of anti–SARS-CoV-2 antibodies after an active infection and/or vaccination, is crucial for limiting disease severity, protecting from future COVID-19 infections, and controlling viral transmission.8,9 Unfortunately, patients with the most common hematologic malignancies (namely, B-cell lymphomas) develop insufficient antibody responses to messenger RNA (mRNA) vaccines, by virtue of treatment-induced immunosuppression.10,11 However, in addition to antibody responses, development of antiviral T cells has been shown to improve survival in patients with COVID-19 and hematologic cancers12; thus, vaccine-induced T-cell responses have the potential to “salvage” protective immunity in patients with B-cell lymphoma. This potential may be particularly important in patients receiving one of the most effective cell-depleting treatments: CD19 CAR T cells (C19 CART). In this study we performed a prospective, comprehensive monitoring of vaccine-induced anti-SARS-CoV-2 antibody and T-cell immunity in patients with B-cell lymphoma treated with CAR T cells.
In this prospective, single-center, clinical study evaluating immune responses to COVID-19 mRNA vaccines authorized by the US Food and Drug Administration, we enrolled patients with B-cell lymphomas treated with CD19 CAR T cells (n = 18) and healthy controls (HCs; n = 10) (supplemental Table 1, available on the Blood Web site). Most patients had large B-cell lymphoma, followed by follicular lymphoma, mantle cell lymphoma, and primary mediastinal large B-cell lymphoma. Most patients had advanced-stage disease and were heavily pretreated. Ten patients received the mRNA-1273 (Moderna) vaccine, and 8 received the BNT162b2 (Pfizer/BioNTech) vaccine. All but 2 patients were in complete remission at the time of vaccination (supplemental Figure 1). Two patients received the vaccine before CART treatment; 13 patients received the vaccine after treatment (median, 5 weeks; range, 3-64); and 3 patients received therapy, followed by allogeneic stem cell transplantation and then received the vaccine (median, 71 weeks; range, 67-76).
When we analyzed 14 of our 18 CART-treated patients who had samples for either the prevaccine or the post–second dose time points for IgG antibodies against different SARS-CoV-2 proteins, we found that after the 2 initial doses of COVID-19 mRNA vaccine, none of the 13 patients with B-cell lymphoma developed an immune response against the RBD, S1, S2, or N proteins. In contrast, all HCs showed a highly significant vaccine-induced increase in antibody titers against all vaccine-generated viral proteins; as expected, none developed anti–N protein antibodies, as the N protein is not part of the vaccine formulation, and N protein antibodies discriminate vaccinated patients from SARS-CoV-2–infected patients (Figure 1A; supplemental Figure 2C). Accordingly, sera from patients with B-cell lymphoma without prior CART treatment and from vaccinated HCs showed an increase from baseline in anti-RBD IgG antibody titers after the second and third doses, whereas CART-treated patients did not demonstrate detectable antibodies (Figure 1B). Consistent with these results, CART-treated patients did not show neutralizing activity at any of the 3 postvaccine time points, whereas the HCs demonstrated almost 100% inhibition of viral entry after 2 to 3 doses of vaccine (Figure 1C). Importantly, although HCs’ antiviral antibodies showed reduced reactivity toward the Omicron (Ο) variant, as compared with the original SARS-CoV-2 virus (supplemental Figure 2D), 3 doses of mRNA vaccine yielded some degree of Ο-variant neutralization (Figure 1C). In contrast, among CART-treated patients, polyclonal sera showed no measurable inhibition of the currently prevalent Ο variant (Figure 1C). We asked whether the lack of vaccine-induced anti-SARS-CoV-2 immune responses was due to nonspecific, global, treatment- or disease-induced immunosuppression; we found that, although CART-treated patients did, indeed, have lower levels of total IgG, IgM, and IgA (supplemental Figure 2A), they actually had maintained normal levels of IgG antibodies against recall antigens, such as influenza A, tetanus toxoid, Epstein-Barr virus, and herpes simplex (supplemental Figure 2B). Looking to explain the specific absence of any de novo humoral immunoreactivity, we confirmed associated depletion of peripheral-blood B cells in CART-treated patients compared with intact B-cell compartments in all other subjects, including HCs, heavily pretreated non-CART–treated patients, and patients with active COVID-19 (Figure 1D-E). Impressively, CD19-CART treatment selectively depleted all CD19+/CD20+ B cells from our patients’ blood, thus eradicating the immune-cell compartment secreting anti-SARS-CoV-2 antibodies (supplemental Figure 2E), yet left CD19−/CD38+ long-lived memory plasma cells intact. Indeed, at baseline, CART-treated patients showed an even higher number of plasma cells than the vaccinated HCs (Figure 1E). Our combined serological findings indicate that, although CART-treated patients are able to generate memory antibody responses (eg, against antigens encountered before B-cell–depleting CAR T-cell therapy), they are incapable of mounting de novo antibody responses against novel antigens, such as SARS-CoV-2.
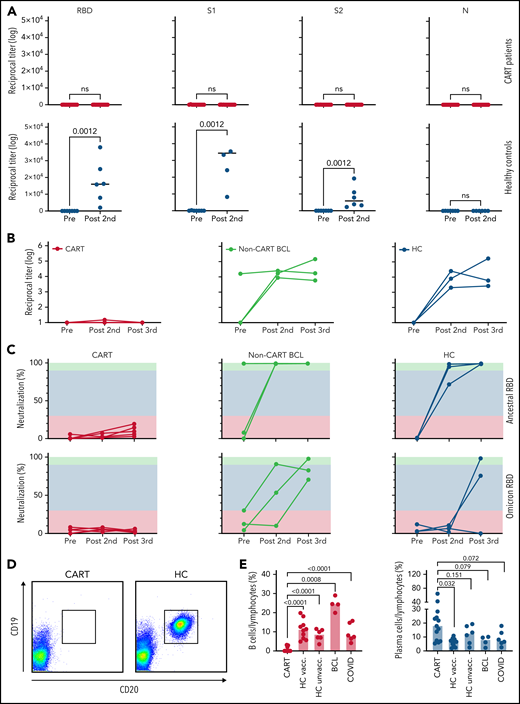
Anti–SARS-CoV-2 B-cell responses in CART-treated patients after 2 to 3 doses of a COVID-19 mRNA vaccine. (A) Titers of IgG antibodies against different full-length recombinant SARS-CoV-2 proteins were measured in CART-treated patients (top, red) and HCs (bottom, blue) before (11 CART-treated patients, 7 HCs) and after (13 CART-treated patients, 6 HCs) 2 doses of a COVID-19 mRNA vaccine. (B) For 5 CART-treated patients (red), 3 patients with B-cell lymphoma (BCL) without prior CART treatment (yellow), and 3 HCs (blue), samples were available at all 3 time points, and anti-RBD titers were measured before vaccination, after the second dose, and after the third dose. (C) Neutralizing activity before vaccination after the second and third doses of a COVID-19 mRNA vaccine in the peripheral blood of the same groups. Green, orange, and red areas indicate different degrees of inhibition (green, >90%; orange, 30%-89%; red, <30%). Neutralizing activity is shown for both the original ancestral SARS-CoV-2 RBD protein (top) and for its Ο variant (bottom). (D) Example of a flow cytometric analysis of B-cell subpopulations in the peripheral blood of a CART-treated patient (2123-038) and an HC (2123-019; right), before the first dose of the vaccine. Dot plots show CD19+/CD20+ B cells after gating on CD3−/CD56−/CD14− lymphocytes. (E) Percentages of peripheral blood CD19+/CD20+ B cells (red bars) and CD19−/CD38+ cells were determined in 13 CART-treated patients, 10 vaccinated HCs, 4 patients with B-cell lymphoma without prior CART treatment at the prevaccine time point, 6 unvaccinated HCs, and 7 patients with active COVID-19. Data are medians. Differences between groups were analyzed for statistical significance by Mann-Whitney U test.
Anti–SARS-CoV-2 B-cell responses in CART-treated patients after 2 to 3 doses of a COVID-19 mRNA vaccine. (A) Titers of IgG antibodies against different full-length recombinant SARS-CoV-2 proteins were measured in CART-treated patients (top, red) and HCs (bottom, blue) before (11 CART-treated patients, 7 HCs) and after (13 CART-treated patients, 6 HCs) 2 doses of a COVID-19 mRNA vaccine. (B) For 5 CART-treated patients (red), 3 patients with B-cell lymphoma (BCL) without prior CART treatment (yellow), and 3 HCs (blue), samples were available at all 3 time points, and anti-RBD titers were measured before vaccination, after the second dose, and after the third dose. (C) Neutralizing activity before vaccination after the second and third doses of a COVID-19 mRNA vaccine in the peripheral blood of the same groups. Green, orange, and red areas indicate different degrees of inhibition (green, >90%; orange, 30%-89%; red, <30%). Neutralizing activity is shown for both the original ancestral SARS-CoV-2 RBD protein (top) and for its Ο variant (bottom). (D) Example of a flow cytometric analysis of B-cell subpopulations in the peripheral blood of a CART-treated patient (2123-038) and an HC (2123-019; right), before the first dose of the vaccine. Dot plots show CD19+/CD20+ B cells after gating on CD3−/CD56−/CD14− lymphocytes. (E) Percentages of peripheral blood CD19+/CD20+ B cells (red bars) and CD19−/CD38+ cells were determined in 13 CART-treated patients, 10 vaccinated HCs, 4 patients with B-cell lymphoma without prior CART treatment at the prevaccine time point, 6 unvaccinated HCs, and 7 patients with active COVID-19. Data are medians. Differences between groups were analyzed for statistical significance by Mann-Whitney U test.
We next asked whether CART-treated patients evidenced anti-SARS-CoV-2 T-cell generation, despite the absence of humoral antiviral immunity. As a first step, we evaluated the general T-cell immunoreactivity of our CART-treated patients and found that T-cell responses to T-cell receptor cross-linking or a mixture of recall antigens was comparable to that of our HCs (supplemental Figure 3A-B). Even more important, we found that, indeed, CART-treated patients showed vaccine-induced CD4+- and CD8+-specific T cells in the blood, targeting the S protein of SARS-CoV-2 (Figure 2A). After 2 initial doses of mRNA vaccine, the number of virus-specific T cells was equal to and sometimes even surpassed that of healthy, vaccinated controls as well as patients with active COVID-19 infection (Figure 2A). The antiviral CD8+ T cells showed strong cytotoxic potential upon stimulation with the SARS-CoV-2 S peptides, as indicated by coexpression of granzyme B, perforin, and CD107a, a marker of recent degranulation (supplemental Figure 4). Over the course of 3 doses of the mRNA COVID-19 vaccine, our CART-treated patients showed an increase in S protein–specific CD4+ and CD8+ T cells, comparable to those in patients with lymphoma without prior CART treatment and in HCs (Figure 2B). Most of the immunodominant epitopes of the anti-SARS-CoV-2 CD4+ T cells were within the S1 component of the S fusion protein, whereas in SARS-CoV-2–specific CD8+ T cells, most of the immunodominant epitopes presumably were present at the C-terminal end of the S2 component (Figure 2C). Importantly, although a decrease in T-cell reactivity was observed when exposed to the S protein Ο variant, most of the polyclonal vaccine-induced CD4+ and CD8+ T cells also recognized this immune-escape variant of ancestral SARS-CoV-2 virus (supplemental Figure 5).
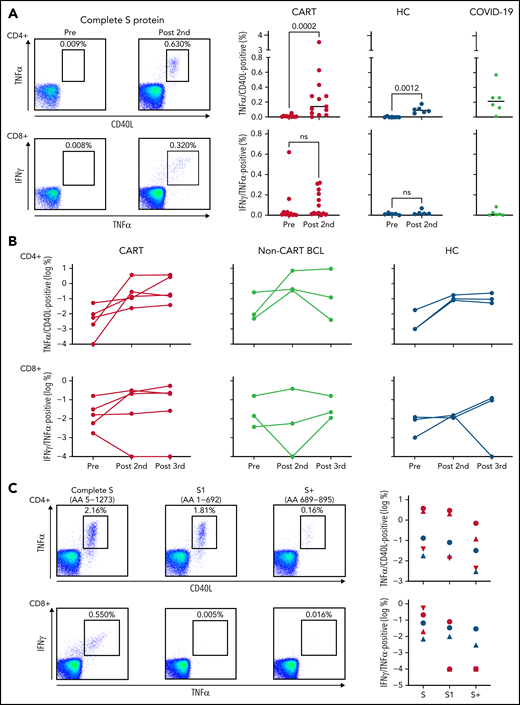
Vaccine-induced SARS-CoV-2–specific T cells in patients with B-cell lymphoma after CD19 CART treatment. (A) T cells specific for the S protein of the SARS-CoV-2 were identified ex vivo after short-term stimulation of total peripheral blood mononuclear cells, by using libraries of overlapping peptides covering the complete sequence of the protein. Intracellular staining of cytokines followed by flow cytometry served as a read-out assay. SARS-CoV-2–specific CD4+ T cells (top left) were defined as tumor necrosis factor-α (TNFα/CD40L (CD154) double-positive CD3+CD4+ T cells, and SARS-CoV-2–specific CD8+ T cells (bottom left) were defined as interferon-γ/TNFα–double-positive CD3+CD8+ T cells. The dot plots on the left show examples of a CART-treated patient (2123-042) without any antiviral T cells before vaccination and easily detectable CD4+ and CD8+ anti-S protein T cells after the second dose of the vaccine. Background levels were typically <0.01% of all CD4+ or CD8+ T cells. Scatterplots indicate levels of SARS-CoV-2–specific CD4+ (top right) and CD8+ T cells (bottom right) before vaccination (11 CART-treated patients; 7 HCs) and after the second dose (13 CART-treated patients; 7 HCs). Gray plots on the right indicate T-cell levels in 6 patients with active COVID-19. Horizontal lines indicate median levels. Differences between groups were analyzed for statistical significance by Mann-Whitney U test. (B) For 5 CART-treated patients (red), 3 patients with B-cell lymphoma (BCL) without prior CART treatment (yellow), and 3 HCs (blue), samples were available at all 3 time points and anti-S CD4+ (top) and CD8+ T cells (bottom) were measured before vaccination, after the second dose, and after the third dose. (C) The number of vaccine-induced CD4+ and CD8+ T cells specific for the complete sequence of the S fusion protein was compared with the number of T cells from the same individual, recognizing the N-terminal S1 protein or the N-terminal part (AA 689-895) of the S2 protein (S+). Dot plots on the left show exemplary data for 2 CART-treated patients with CD4+ (patient 2123-108) and CD8+ (patient 2123-034) T cells, respectively, specific for the SARS-CoV-2 S protein. Symbols on the right show the same type of data for 3 CART-treated patients (red) and 2 HCs (blue).
Vaccine-induced SARS-CoV-2–specific T cells in patients with B-cell lymphoma after CD19 CART treatment. (A) T cells specific for the S protein of the SARS-CoV-2 were identified ex vivo after short-term stimulation of total peripheral blood mononuclear cells, by using libraries of overlapping peptides covering the complete sequence of the protein. Intracellular staining of cytokines followed by flow cytometry served as a read-out assay. SARS-CoV-2–specific CD4+ T cells (top left) were defined as tumor necrosis factor-α (TNFα/CD40L (CD154) double-positive CD3+CD4+ T cells, and SARS-CoV-2–specific CD8+ T cells (bottom left) were defined as interferon-γ/TNFα–double-positive CD3+CD8+ T cells. The dot plots on the left show examples of a CART-treated patient (2123-042) without any antiviral T cells before vaccination and easily detectable CD4+ and CD8+ anti-S protein T cells after the second dose of the vaccine. Background levels were typically <0.01% of all CD4+ or CD8+ T cells. Scatterplots indicate levels of SARS-CoV-2–specific CD4+ (top right) and CD8+ T cells (bottom right) before vaccination (11 CART-treated patients; 7 HCs) and after the second dose (13 CART-treated patients; 7 HCs). Gray plots on the right indicate T-cell levels in 6 patients with active COVID-19. Horizontal lines indicate median levels. Differences between groups were analyzed for statistical significance by Mann-Whitney U test. (B) For 5 CART-treated patients (red), 3 patients with B-cell lymphoma (BCL) without prior CART treatment (yellow), and 3 HCs (blue), samples were available at all 3 time points and anti-S CD4+ (top) and CD8+ T cells (bottom) were measured before vaccination, after the second dose, and after the third dose. (C) The number of vaccine-induced CD4+ and CD8+ T cells specific for the complete sequence of the S fusion protein was compared with the number of T cells from the same individual, recognizing the N-terminal S1 protein or the N-terminal part (AA 689-895) of the S2 protein (S+). Dot plots on the left show exemplary data for 2 CART-treated patients with CD4+ (patient 2123-108) and CD8+ (patient 2123-034) T cells, respectively, specific for the SARS-CoV-2 S protein. Symbols on the right show the same type of data for 3 CART-treated patients (red) and 2 HCs (blue).
Limitations of this study include a small sample size and a somewhat limited functional assessment of vaccine-induced T-cell responses. However, we have been able to show that patients with B-cell lymphoma treated with CD19-CAR T cells are rendered incapable of developing vaccine-induced antibody responses against novel antigens such as SARS-CoV-2 as a result of potent B-cell depletion. We also demonstrate that these same patients are still capable of developing anti-SARS-CoV-2 T cells that even recognize the Ο immune-escape13 variant. Ongoing studies are investigating whether these Ο-reactive T cells are protective, especially in light of a certain degree of lymphopenia typically present in our patient population (supplemental Figure 6), as well as whether additional measures, such as reimmunization with previous vs heterologous vaccine14 can effectively induce seroconversion in patients with B-cell lymphoma after CD19-CART treatment.
Acknowledgments
This study was funded by 2 grants from the Kahlert Foundation (D.A.), by the Maryland Department of Health’s Cigarette Restitution Fund Program (D.A. and X.F.), and by the National Institutes of Health, National Cancer Institute Cancer Center Support Grant (CCSG) P30CA134274.
Authorship
Contribution: D.A. designed the study, performed experiments, analyzed the data, created the figures, and wrote the manuscript; T.L., N.M.H., K.K.S., J.S.H., S.V.N., P.M., S.T.L., J.Y.L., E.V.M., K.H., J.B., M.K., J.A.Y., A.P.R., and S.D. analyzed data and wrote the manuscript; D.O., T.I., and S.V.A. processed the patient samples and performed the experiments; F.L. and H.D.M. collected the patient data and wrote the manuscript; X.F. performed the experiments and wrote the manuscript; and S.B. and P.L. collected the patient samples.
Conflict-of-interest: S.D. serves on advisory boards for Bristol-Myers Squibb, Incyte, and Atara Biotherapeutics. The remaining authors declare no competing financial interests.
Correspondence: Djordje Atanackovic, Fannie Angelos Cellular Therapeutics GMP Laboratory, University of Maryland Greenebaum Comprehensive Cancer Center, Bressler Research Building, Room 9-011, 655 W. Baltimore St, Baltimore, MD 21201; e-mail: datanackovic@som.umaryland.edu.
Original data will be shared upon request by e-mail to the corresponding author.
The online version of this article contains a data supplement.
There is a Blood Commentary on this article in this issue.

This feature is available to Subscribers Only
Sign In or Create an Account Close Modal