Key Points
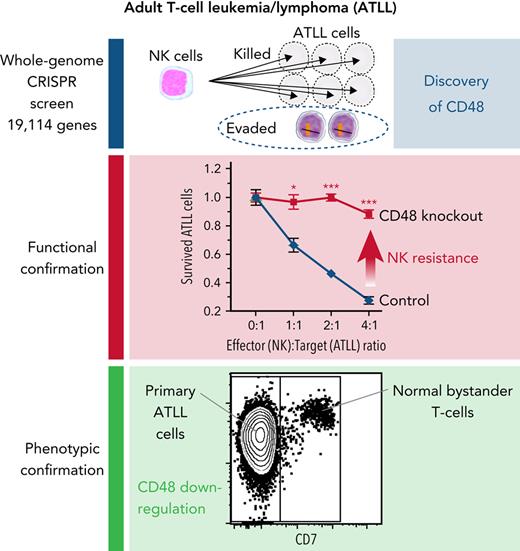
Whole-genome CRISPR library screening identified CD48 as a key molecule to define susceptibility to NK-cell–mediated cytotoxicity in ATLL.
ATLL and other PTCLs had reduced CD48 expression compared with normal T cells, implicating a role of reduced CD48 in PTCL pathogenesis.
Abstract
Adult T-cell leukemia/lymphoma (ATLL) is one of the aggressive peripheral T-cell neoplasms with a poor prognosis. Accumulating evidence demonstrates that escape from adaptive immunity is a hallmark of ATLL pathogenesis. However, the mechanisms by which ATLL cells evade natural killer (NK)-cell–mediated immunity have been poorly understood. Here we show that CD48 expression in ATLL cells determines the sensitivity for NK-cell–mediated cytotoxicity against ATLL cells. We performed unbiased genome-wide clustered regularly interspaced short palindromic repeat (CRISPR) screening using 2 ATLL-derived cell lines and discovered CD48 as one of the best-enriched genes whose knockout conferred resistance to YT1–NK cell line-mediated cytotoxicity. The ability of CD48-knockout ATLL cells to evade NK-cell effector function was confirmed using human primary NK cells with reduced interferon-γ (IFNγ) induction and degranulation. We found that primary ATLL cells had reduced CD48 expression along with disease progression. Furthermore, other subgroups among aggressive peripheral T-cell lymphomas (PTCLs) also expressed lower concentrations of CD48 than normal T cells, suggesting that CD48 is a key molecule in malignant T-cell evasion of NK-cell surveillance. Thus, this study demonstrates that CD48 expression is likely critical for malignant T-cell lymphoma cell regulation of NK-cell–mediated immunity and provides a rationale for future evaluation of CD48 as a molecular biomarker in NK-cell–associated immunotherapies.
Introduction
Adult T-cell leukemia/lymphoma (ATLL) is a mature T-cell neoplasm with a poor prognosis. Human T-cell leukemia virus type 1 (HTLV-1) is the causative retrovirus of ATLL that infects CD4+ T cells of infants through breastfeeding. A fraction of the HTLV-1–infected individuals develop ATLL after >50 years.1 During the long latency period, genetic alterations and aberrant gene expression accumulate extensively in ATLL cells because of genomic instability.1-4 In particular, ATLL has a high frequency of somatic mutations, genomic losses, and epigenetic silencing in HLA-A (human leukocyte antigen A), HLA-B, and β2 microglobulin (B2M) and structural variations in the 3′-untranslated region of PD-L1 (programmed cell death ligand-1).2,5 The expression pattern of these tumor immunity-related molecules was associated with prognosis in patients with ATLL.6,7 These findings highlighted immune escape as a hallmark of ATLL. On the basis of these, clinical trials of immune checkpoint inhibitors against ATLL have been initiated (NCT02631746 and UMIN000020601). However, in many cancers, immune checkpoint inhibitor monotherapy is not sufficiently effective.8 It is known that successful antitumor immune responses can be elicited by a system of multiple immune effector cells.9,10 From this viewpoint, it is important to examine in detail the role of each antitumor immune cell to find biomarkers and to establish the strategies for maximizing the efficacies of the immunotherapies.
Natural killer (NK) cells are innate immune cells that eliminate virus-infected cells and tumor cells. In addition to their direct cytotoxic ability, recent evidence indicates that NK cells can orchestrate the immune response and help adaptive immune responses to cancer through the production of cytokines and chemokines, including interferon-γ (IFNγ).11,12 However, in ATLL, mechanisms of immune escape from NK cells are poorly understood. Activation of NK cells is controlled by signal integration from multiple stimulatory and inhibitory receptors on their cell surfaces. These receptors comprise killer cell immunoglobulin-like receptors, killer lectin-like receptors, natural cytotoxicity receptors, some adhesion molecules, and some from the signaling lymphocyte activation molecule (SLAM) family. Given the diversity of the NK cell receptors,11 functional elucidation of the key mechanisms by which cancer cells evade NK-mediated immune surveillance remains challenging.
Therefore, we performed unbiased genome-wide clustered regularly interspaced short palindromic repeat (CRISPR) screening and examined ATLL cell-intrinsic molecules, which could play essential roles in the immune escape from NK-mediated cytotoxicity against ATLL uncovering a critical role for CD48 modulation in the evasion of NK-mediated immunity. Furthermore, the downregulation of CD48 expression appears to be a shared phenomenon among T-cell neoplasms that confer these malignant cells’ resistance against NK-cell surveillance to ensure their survival.
Materials and methods
See supplemental Materials and methods for details (available on the Blood Web site).
Human ATLL samples
This study was performed in accordance with the Declaration of Helsinki. Approval was granted by the Institutional Review Board of Hokkaido University Faculty of Medicine. Peripheral blood mononuclear cells (PBMCs) were isolated from patients with ATLL by Ficoll-Hypaque.
PBMC isolation and NK-cell purification from healthy donors
Written informed consent was obtained in accordance with the Declaration of Helsinki and was approved by the ethics committee in the Faculty of Medicine, Hokkaido University. PBMCs were isolated from healthy donors by Ficoll Hypaque. NK cells were purified with an NK cell Isolation Kit human (Miltenyi Biotec #130-092-657). We obtained >80% purity for NK cells defined by CD3 negativity and CD56 positivity.
Mice
Five-week-old male NOD/Shi-scid,IL-2RγKO Jic (NOG) mice were purchased from In-Vivo Science. All animal experimental procedures in the study were approved by the Institutional Animal Care and Research Advisory Committee of Hokkaido University (no. 21-0095) and were performed in accordance with Institutional guidelines. All the mice were subcutaneously injected with ED40515(−) cells (5 × 10⁶) in the right flank. When the average tumor volume reached approximately 100 mm3, 2 Gy irradiated YT1 cells (1 × 10⁷) were subcutaneously injected to adjacent sites of the tumor twice on day 0 and day 4. The tumor size was measured by using a caliper, and the tumor volume was calculated by the following formula: tumor volume = 1/2 (length × width2).
Statistical analysis
All experiments presented have been repeated at least twice, and consistent results were obtained. Data were analyzed using Welch 2-sample t test and log-rank test by GraphPad PRISM 8. Error bars are represented as means ± SEM unless specified otherwise; P < .05 was considered statistically significant.
Results
Unbiased genome-wide CRISPR screening identifies CD48 as an ATLL-intrinsic molecule involved in NK-cell–mediated cytotoxicity
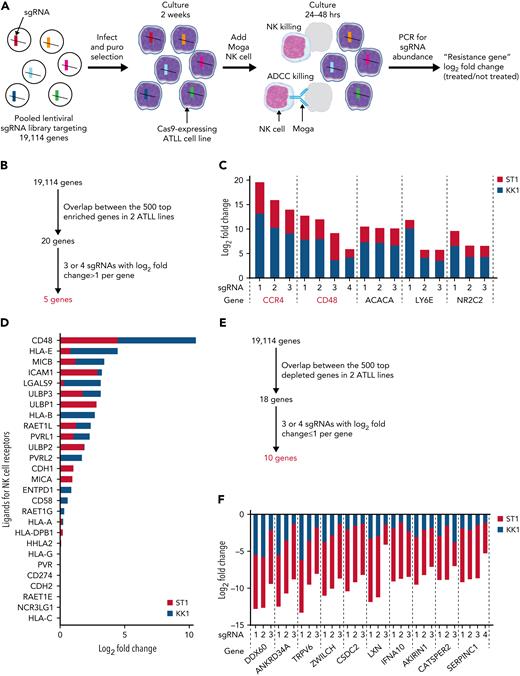
We conducted a genome-wide loss-of-function CRISPR screen to identify intrinsic genes involved in resistance to NK-mediated cytotoxicity in ATLL cells (Figure 1A). Cas9-expressing ATLL cell lines, ST1 and KK1, were infected with a pooled genome-wide CRISPR knockout library, selected by puromycin, and cultured for 2 weeks, enough to have genes fully inactivated by single guide RNA (sgRNA). Then the cells were cocultured with a human YT1–NK cell line at an effector to target (E:T) ratio of 1:2 with mogamulizumab (Moga), anti-human CCR4 monoclonal antibody, for 24 hours with ST1 and 48 hours with KK1, resulting in a decrease in the ATLL cell population by 80% and 90%, respectively. The abundance of each sgRNA in the surviving ATLL cells was assessed by next-generation sequencing of genomic DNA and compared with the one in ATLL cells cultured without YT1 and Moga. Resistant genes were those for which the corresponding sgRNAs were enriched in the screening cell pool compared with the nonscreening cell pool. Our experimental setting enabled us to evaluate the responsible genes for both direct NK-cell mediated cytotoxicity and Moga-mediated antibody-dependent cellular cytotoxicity (ADCC). In theory, the latter is dependent on CCR4 expression on the ATLL cells,13 so this screening was designed to show the enrichment of sgRNAs targeting CCR4 (sgCCR4) when the screening worked properly.
A CRISPR library screen identifies ATLL cell-intrinsic molecules for immune escape from YT1–NK cell line-mediated cytotoxicity. (A) Schematic design of CRISPR library screening in this study. Two Cas9-expressing ATLL cell lines, ST1 and KK1, were analyzed. (B) Selection criteria for ATLL cell-intrinsic genes whose knockout lead to escape from NK cytotoxicity. (C) Log2 fold changes (treated/not treated) of single guide RNAs (sgRNAs) targeting selected resistance genes. (D) Log2 fold changes (treated/not treated) of known NK-cell receptor ligands in our screening. (E) Selection criteria for ATLL-cell–intrinsic genes whose knockout lead to sensitization of NK cytotoxicity. (F) Log2 fold changes (treated/not treated) of sgRNAs targeting selected sensitizing genes.
A CRISPR library screen identifies ATLL cell-intrinsic molecules for immune escape from YT1–NK cell line-mediated cytotoxicity. (A) Schematic design of CRISPR library screening in this study. Two Cas9-expressing ATLL cell lines, ST1 and KK1, were analyzed. (B) Selection criteria for ATLL cell-intrinsic genes whose knockout lead to escape from NK cytotoxicity. (C) Log2 fold changes (treated/not treated) of single guide RNAs (sgRNAs) targeting selected resistance genes. (D) Log2 fold changes (treated/not treated) of known NK-cell receptor ligands in our screening. (E) Selection criteria for ATLL-cell–intrinsic genes whose knockout lead to sensitization of NK cytotoxicity. (F) Log2 fold changes (treated/not treated) of sgRNAs targeting selected sensitizing genes.
We ranked genes enriched in this screen by using the Model-based Analysis of Genome-wide CRISPR/Cas9 Knockout (MAGeCK) algorithm. Twenty genes overlapped between the top 500 ranked genes in the 2 ATLL cell lines (Figure 1B). Further, we selected genes having 3 or 4 sgRNAs with a log 2-fold change >1. Accordingly, we identified 5 genes that played important roles in direct NK cytotoxicity or Moga-mediated ADCC (Figure 1B-C; supplemental Figure 1A). As a proof of concept, CCR4 was identified as the best-ranked gene with 3 enriched sgRNAs, confirming that this screening process worked properly (Figure 1C). The other 4 genes were CD48 (cluster of differentiation 48; one of the SLAM family cell surface receptors), ACACA (acetyl-CoA carboxylase α; an enzyme associated with fatty acid biogenesis), LY6E (lymphocyte antigen 6E; a gene related to antiviral defense), and NR2C2 (nuclear receptor subfamily 2 group C member 2; nuclear orphan receptor). CD48 activates NK cells through ligation of 2B4 on the NK cells,11 which was well characterized using the YT1–NK cell line previously.14 CD48 obtained the strongest enrichment score among all known 27 NK-cell receptor ligands in our sgRNA library (Figure 1D; supplemental Figure 1B). Therefore, our CRISPR screen results demonstrated CD48 as an important molecule mediating the evasion of ATLL from NK cytotoxicity, and we decided to focus on CD48 in the following confirmatory experiments.
We also ranked genes depleted in this screening using the MAGeCK algorithm (Figure 1E). Eighteen genes overlapped among the top 500 ranked genes in 2 ATLL cell lines. After filtering out unsure genes, we identified 10 genes that may play roles in sensitizing direct NK cytotoxicity or Moga-mediated ADCC. These genes consisted of DDX60 (a DEXD/H box helicase promoting RIG-I–like receptor-mediated signaling), ANKRD34A, TRPV6 (calcium transporter), ZWILCH (kinetochore-associated molecule), CSDC2 (RNA-binding factor), LXN (zinc-dependent metallocarboxypeptidase inhibitor), IFNA10 (type I interferon family gene), AKIRIN1, CATSPER2 (sperm-specific ion channel), and SERPINC1 (granzyme inhibitor) (Figure 1F). Although it is beyond the scope of this study, it would be worth investigating in a future study if the loss of these genes makes the ATLL cells more susceptible to NK-mediated killing.
CD48 knockout renders ATLL cell lines resistant to YT1-mediated direct cytotoxicity
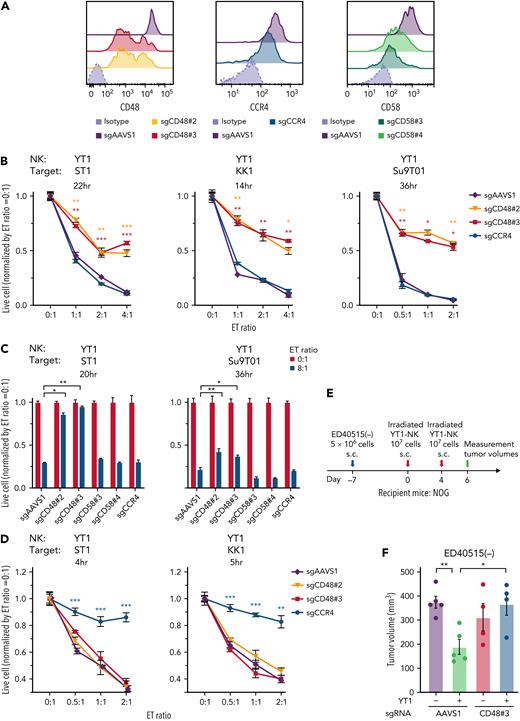
We infected ATLL cell lines expressing Cas9 with 2 sgRNAs targeting CD48 (sgCD48#2 and #3), which were enriched in our screening. These ATLL cell lines decreased CD48 surface expression, which was confirmed by flow cytometric analysis and immunoblot analysis (Figure 2A [left panel]; supplemental Figure 2A [left panel] and 2B). In parallel, we created ATLL cell lines transduced with sgRNA targeting CCR4 (sgCCR4) as a positive control for Moga-related ADCC and sgRNA targeting CD58 (sgCD58) as a negative control, as shown in Figure 1D (Figure 2A [middle and right panel]; supplemental Figure 2A [right panel]). ATLL cell lines carrying sgAAVS1 were also used as another negative control.
CD48 knockout renders ATLL cells resistant to YT1-mediated direct cytotoxicity. (A) Cell surface expression of CD48, CCR4, and CD58. Mean fluorescence intensity were evaluated in the sgRNA-transduced ST1 ATLL cells by flow cytometry. (B) Normalized live-cell numbers of sgRNA-transduced ATLL cells under the cocultivation with YT1. After the indicated incubation times, numbers of the live target ATLL cells were determined with flow cytometry by gating on propidium iodide− cells representing live cells and by gating on GFP+ cells representing sgRNA-transduced ATLL cells, which excluded GFP-negative effector YT1 cells. The number of beads normalized the number of live cells. The numbers at different E:T ratios were normalized by the one at the E:T ratio of 0:1. (C) Normalized live-cell numbers of sgCD58-transduced ATLL cells under the cocultivation with YT1. sgAAVS1-, sgCD48-, and sgCCR4-transduced ATLL cells are also shown for comparison. Data were obtained as shown in (B). (D) Normalized live-cell numbers of sgRNA-transduced ATLL cells under the cocultivation with YT1 in the presence of mogamulizumab. Data were obtained as shown in (B). (E) Schematic design of the animal study. (F) Tumor volume of irradiated YT1–NK-cell–treated or control tumors of ED40515(−) ATLL cells with sgAAVS1 or sgCD48#3 in NOG mice. Error bars represent the SEM of replicates. ∗P < .05, ∗∗P < .01, and ∗∗∗P < .001, Welch 2-sample t test. All experiments were repeated ≥2 times except for (F).
CD48 knockout renders ATLL cells resistant to YT1-mediated direct cytotoxicity. (A) Cell surface expression of CD48, CCR4, and CD58. Mean fluorescence intensity were evaluated in the sgRNA-transduced ST1 ATLL cells by flow cytometry. (B) Normalized live-cell numbers of sgRNA-transduced ATLL cells under the cocultivation with YT1. After the indicated incubation times, numbers of the live target ATLL cells were determined with flow cytometry by gating on propidium iodide− cells representing live cells and by gating on GFP+ cells representing sgRNA-transduced ATLL cells, which excluded GFP-negative effector YT1 cells. The number of beads normalized the number of live cells. The numbers at different E:T ratios were normalized by the one at the E:T ratio of 0:1. (C) Normalized live-cell numbers of sgCD58-transduced ATLL cells under the cocultivation with YT1. sgAAVS1-, sgCD48-, and sgCCR4-transduced ATLL cells are also shown for comparison. Data were obtained as shown in (B). (D) Normalized live-cell numbers of sgRNA-transduced ATLL cells under the cocultivation with YT1 in the presence of mogamulizumab. Data were obtained as shown in (B). (E) Schematic design of the animal study. (F) Tumor volume of irradiated YT1–NK-cell–treated or control tumors of ED40515(−) ATLL cells with sgAAVS1 or sgCD48#3 in NOG mice. Error bars represent the SEM of replicates. ∗P < .05, ∗∗P < .01, and ∗∗∗P < .001, Welch 2-sample t test. All experiments were repeated ≥2 times except for (F).
To evaluate direct NK cytotoxicity, the transduced ST1 ATLL cell line and the human YT1–NK cell line were coincubated with different E:T ratios. ST1 ATLL cells carrying sgCD48 survived better than the cells carrying control sgAAVS1, whereas there was no difference among the live cell numbers of ST1 cells carrying sgAAVS1, sgCCR4, and sgCD58 (Figure 2B [left panel] and Figure 2C [left panel]). These findings were also confirmed with the other ATLL cell lines, KK1 and Su9T01 (Figure 2B [middle and right panels] and Figure 2C [right panel]), although sgCD58 was not evaluated in KK1 because of its lack of CD58 expression (supplemental Figure 2A [right panel]). In contrast, in the culture condition with Moga (Figure 2D), Moga-mediated ADCC dominated, and CD48 appeared to not play any role in the ADCC, as expected. In ST1 cells, the survival advantage of CD48 knockout was canceled by the ectopic expression of a CD48 coding region engineered to be resistant to sgCD48 (supplemental Figure 2C-D), confirming the specificity of sgCD48. We further examined the role of CD48 using immunocompromised NOG mice inoculated with ED40515(−) ATLL cells with control sgAAVS1 or sgCD48#3. Control mice were inoculated only with ED40515(−) cells, whereas the treatment group was injected with YT1–NK cells and ED40515(−) cells (Figure 2E-F). Control sgAAVS1-infected ED40515(−) xenograft growth was significantly suppressed by the addition of YT1–NK cells, whereas sgCD48#3-infected ED40515(−) xenograft grew without suppression by YT1–NK cells. Collectively, these observations confirm that CD48 was an ATLL-intrinsic molecule that was responsible for direct cytotoxicity mediated by the YT1–NK cell line.
CD48 knockout renders ATLL cells resistant to human primary NK-cell–mediated direct cytotoxicity
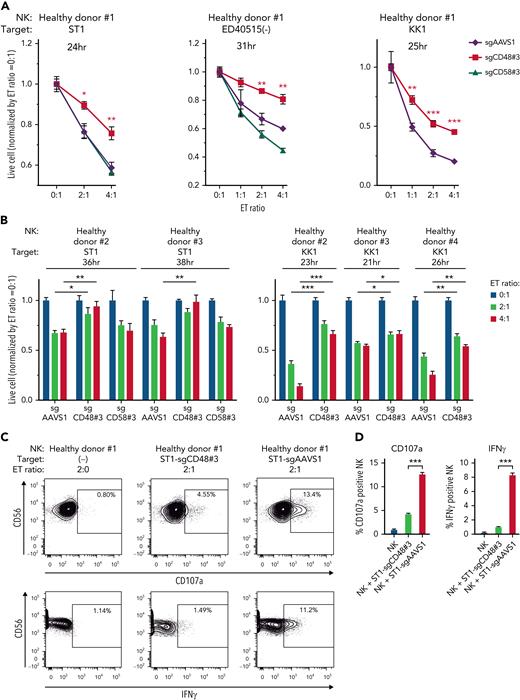
We then investigated whether CD48 knockout ATLL cell lines efficiently evade direct cytotoxicity mediated by human primary NK cells. Primary NK cells were isolated using PBMCs from a healthy donor (#1) and cocultured with ST1 ATLL cells (Figure 3A; supplemental Figure 3A). The number of live ST1 cells carrying sgCD48 was significantly higher than that of cells carrying control sgAAVS1 or sgCD58 (Figure 3A; supplemental Figure 3A [left panel]). We could confirm these findings in 2 other ATLL cell lines, ED40515(−) (Figure 3A; supplemental Figure 3A [middle panel]) (sgAAVS1, sgCD48, and sgCD58) and KK1 (Figure 3A; supplemental Figure 3A [right panel]) (sgAAVS1 and sgCD48). Moreover, we used NK cells from 3 other healthy donors (#2, #3, and #4) and obtained consistent results in that ATLL cells carrying sgCD48 survived significantly better than the cells carrying control sgAAVS1 (ST1 and KK1) and sgCD58 (ST1) (Figure 3B; supplemental Figure 3B). Since sgCD48-mediated knockout was not uniformly efficient in ATLL cells (Figure 2A; supplemental Figure 2A), we established KK1 and ED40515(−) cells with complete CD48 knockout via single-cell cloning from bulk sgCD48-transduced cells (supplemental Figure 2A-B) and evaluated their evasion from direct NK cytotoxicity. Cells with complete CD48 knockout demonstrated better survival than sgCD48-transduced bulk cells when cocultured with primary NK cells (supplemental Figure 3C). Further, we used an anti-CD48 blocking antibody instead of CD48 knockout and found that the antibody substantially blocked NK-cell–mediated direct toxicity to the ST1 ATLL cells (supplemental Figure 3D). The primary NK cell fractions expressing CD107a or IFNγ were decreased significantly when coincubated with ST1 carrying sgCD48 compared with those coincubated with ST1 carrying control sgAAVS1 (Figure 3C-D) (mean CD107a expressing fraction, 4.30% in sgCD48-ST1 vs 12.66% in sgAAVS1-ST1, P < .001; mean IFNγ expressing fraction, 1.03% in sgCD48-ST1 vs 8.33% in sgAAVS1-ST1, P < .001) (supplemental Figure 3E), indicating decreased NK-cell degranulation and activation. Collectively, these findings indicated that CD48 was an ATLL-intrinsic molecule that defined susceptibility to human NK-cell–mediated direct cytotoxicity.
CD48 knockout renders ATLL cells resistant to direct cytotoxicity of primary NK cells isolated from healthy donors. (A-B) Normalized live-cell numbers of sgRNA-transduced ATLL cells under the cocultivation with primary NK cells isolated from (A) healthy donor #1 and from (B) healthy donors #2, #3, and #4. Data were obtained as shown in Figure 2B. (C) Expression of CD107a or IFNγ in primary NK cells detected by flow cytometry. NK cells from healthy donor #1 were cocultivated without ST1 or with sgCD48- or sgAAVS1-transduced ST1 for 6 hours. (D) The mean percentages of CD107a or IFNγ-positive NK cells shown in (C) were demonstrated by the bar graphs. Error bars represent the SEM of replicates. ∗P < .05, ∗∗P < .01, and ∗∗∗P < .001, Welch 2-sample t test. All experiments were repeated ≥2 times except for (B).
CD48 knockout renders ATLL cells resistant to direct cytotoxicity of primary NK cells isolated from healthy donors. (A-B) Normalized live-cell numbers of sgRNA-transduced ATLL cells under the cocultivation with primary NK cells isolated from (A) healthy donor #1 and from (B) healthy donors #2, #3, and #4. Data were obtained as shown in Figure 2B. (C) Expression of CD107a or IFNγ in primary NK cells detected by flow cytometry. NK cells from healthy donor #1 were cocultivated without ST1 or with sgCD48- or sgAAVS1-transduced ST1 for 6 hours. (D) The mean percentages of CD107a or IFNγ-positive NK cells shown in (C) were demonstrated by the bar graphs. Error bars represent the SEM of replicates. ∗P < .05, ∗∗P < .01, and ∗∗∗P < .001, Welch 2-sample t test. All experiments were repeated ≥2 times except for (B).
A long-term competitive assay indicates a strong survival advantage in CD48 knockout ATLL cells under the pressure from NK-cell–mediated surveillance
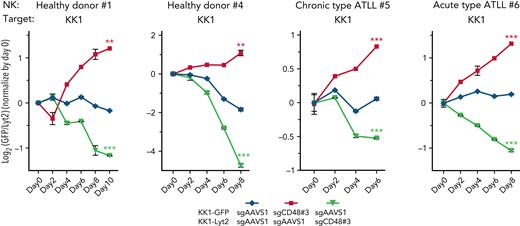
To evaluate the effect of CD48 loss in evading NK-cell–mediated cytotoxicity in a more precise manner during the prolonged observation time, we performed a competitive survival assay (Figure 4; supplemental Figure 4A). KK1 ATLL cells were transduced with sgCD48 together with a green fluorescent protein (GFP) reporter or with a control sgAAVS1 with a Lyt2 reporter. After puromycin selection for GFP and single-cell cloning for Lyt2, these 2 cell populations were mixed in equal numbers and incubated for 6 to 10 days. During the incubation period, human primary NK cells from a healthy donor #1 were added at the E:T ratio of 1:2 every 2 days to impart selective pressure. We monitored the ratio of these 2 cell populations by flow cytometry every 2 days. KK1 carrying sgCD48#3 outcompeted the cells carrying a control sgAAVS1 over time, leading to a 2.4-fold increase in the cell population of the former compared with that of the latter (Figure 4A, healthy donor #1, red line, P < .01). In a swapping experiment in which we used sgCD48#3-transduced KK1 coexpressing Lyt2 and a control sgAAVS1-infected KK1 coexpressing GFP, we obtained similar results (Figure 4, healthy donor #1, yellow line, P < .001). We repeated this competitive survival assay with an NK cell from another healthy donor #4 and observed again a threefold increase in the cell number of sgCD48#3-trunsduced KK1 cells compared with control sgAAVS1-transduced cells (Figure 4A, healthy donor #4, red line, P < .01). We also confirmed the same result in a swapping experiment (Figure 4A, healthy donor #4, yellow line, P < .001). We repeated these experiments using another sgCD48 (#2) and obtained similar results (supplemental Figure 4A).
Long-term competitive assay clarifies strong survival advantage in CD48 knockout ATLL cells. Long-term competitive assay by using primary NK cells isolated from healthy donor #1, healthy donor #4, chronic-type ATLL patient #5, and acute-type ATLL patient #6. Cells were mixed every 2 days at an E:T ratio of 1:2. The ratios of the GFP+ and Lyt2+ populations were normalized to the value at day 0. Growth curves represent the mean of 3 replicates. Error bars represent the SEM of replicates. ∗∗P < .01, and ∗∗∗P < .001, Welch 2-sample t test.
Long-term competitive assay clarifies strong survival advantage in CD48 knockout ATLL cells. Long-term competitive assay by using primary NK cells isolated from healthy donor #1, healthy donor #4, chronic-type ATLL patient #5, and acute-type ATLL patient #6. Cells were mixed every 2 days at an E:T ratio of 1:2. The ratios of the GFP+ and Lyt2+ populations were normalized to the value at day 0. Growth curves represent the mean of 3 replicates. Error bars represent the SEM of replicates. ∗∗P < .01, and ∗∗∗P < .001, Welch 2-sample t test.
We isolated primary NK cells from the PBMCs of 2 patients with ATLL with different clinical subtypes (#5 from chronic-type ATLL and #6 from acute-type ATLL) and used the NK cells for a competitive survival assay. The live sgCD48-transduced KK1 cells outgrew the control sgAAVS1-transduced cells when coincubated for 6 days with NK cells isolated from the patient with chronic-type ATLL (Figure 4, chronic-type ATLL #5, red line, P < .001) or for 8 days with NK cells isolated from the patient with acute-type ATLL (Figure 4, acute-type ATLL #6, red line, P < .001), respectively. We obtained similar results in the swapping assay with NK cells from the patient with chronic-type ATLL (Figure 4, chronic-type ATLL #5, yellow line, P < .001) or from the patient with acute-type ATLL (Figure 4, acute-type ATLL #6, yellow line, P < .001). These findings indicated that losing CD48 expression potentially conferred a potent survival advantage to ATLL cells under the persistent pressure from NK-mediated tumor surveillance, implicating a critical role for CD48 in the tumorigenesis of ATLL. Importantly, expression concentrations of 2B4 on NK cells were comparable in patients with ATLL and healthy donors (supplemental Figure 4B).
STAT5B regulates CD48 expression in ATLL cells
To address the regulatory mechanism of CD48 expression in ATLL cells, we performed chemical compound library screening with 157 chemical compounds covering multiple signaling pathways (supplemental Table 1). We treated the KK1 ATLL cell line with the chemical compound library for 24 hours, then evaluated the surface expression concentrations of CD48 by flow cytometry. Although most compounds did not affect the CD48 expression concentrations, 3 JAK inhibitors, ruxolitinib (JAK1/2 inhibitor), tofacitinib (pan-JAK inhibitor), and baricitinib (JAK1/2 inhibitor), suppressed CD48 expression with >2 standard deviations from average (Figure 5A). To confirm this screening result, we treated 9 ATLL cell lines with ruxolitinib and found that 5 lines showed a significant decrease in CD48 surface expression, and all of these were interleukin 2 (IL2)-dependent (Figure 5B; KK1, ED40515(+), ATL55T(+), TL-Om1, and KOB; supplemental Figure 5; KK1, ED40515(+), ATL55T(+)). In contrast, CD48 expression was not affected in 3 IL2-independent lines (ST1, ED40515(−), and Su9T01). These results indicate that IL2 signaling regulated CD48 expression in ATLL cells. It is well established that IL2 signaling activates STAT5 predominantly and also STAT3 partially through the phosphorylation of JAK1 and JAK3. To take this a step further, we investigated which molecules in the JAK/STAT pathway were critical in the IL2-mediated CD48 expression in ATLL cells. Although ruxolitinib treatment blunted phosphorylation of both STAT5B and STAT3 (Figure 5C), a more detailed molecular analysis using sgRNAs clarified that STAT5B, JAK1, and JAK3 (rather than STAT3, JAK2, and TYK2) were exclusively responsible for IL2-mediated CD48 expression in ATLL cells (Figure 5D-G). These results suggest that attenuated IL2/STAT5 signaling might be at least partially associated with CD48 reduction in ATLL cells.
STAT5 regulates CD48 expression in IL2-dependent ATLL cells. (A-B) Normalized cell surface CD48 expression by flow cytometry on (A) KK1 cells treated with compound library (2.5 μM) for 24 hours and (B) ATLL cell lines treated with ruxolitinib (2.5 μM) or dimethyl sulfoxide for 24 hours. (C) Immunoblot analysis of pSTAT3, STAT3, pSTAT5B, and STAT5B in ATLL cells treated with ruxolitinib (2.5 μM) for 24 hours. (D) Immunoblot analysis of CD48, JAK1, JAK2, JAK3, TYK2, STAT3, and STAT5B in sgJAK1, sgJAK2, sgJAK3, sgTYK2, sgSTAT3, and sgSTAT5B-transduced KK1 cells. The quantification of CD48 immunoblot bands, normalized to GAPDH and compared with sgAAVS1 control cells, is shown below the CD48 immunoblot. (E-F) Normalized cell surface CD48 expression on (E) sgJAK1, sgJAK2, sgJAK3, and sgTYK2, and (F) sgSTAT3- and sgSTAT5B-transduced KK1 cells. (G) Normalized cell surface CD48 expression by flow cytometry on sgSTAT5B-transduced ATLL cells. Error bars represent the SEM of replicates. ∗P < .05, ∗∗P < .01, and ∗∗∗P < .001, Welch 2-sample t-test.
STAT5 regulates CD48 expression in IL2-dependent ATLL cells. (A-B) Normalized cell surface CD48 expression by flow cytometry on (A) KK1 cells treated with compound library (2.5 μM) for 24 hours and (B) ATLL cell lines treated with ruxolitinib (2.5 μM) or dimethyl sulfoxide for 24 hours. (C) Immunoblot analysis of pSTAT3, STAT3, pSTAT5B, and STAT5B in ATLL cells treated with ruxolitinib (2.5 μM) for 24 hours. (D) Immunoblot analysis of CD48, JAK1, JAK2, JAK3, TYK2, STAT3, and STAT5B in sgJAK1, sgJAK2, sgJAK3, sgTYK2, sgSTAT3, and sgSTAT5B-transduced KK1 cells. The quantification of CD48 immunoblot bands, normalized to GAPDH and compared with sgAAVS1 control cells, is shown below the CD48 immunoblot. (E-F) Normalized cell surface CD48 expression on (E) sgJAK1, sgJAK2, sgJAK3, and sgTYK2, and (F) sgSTAT3- and sgSTAT5B-transduced KK1 cells. (G) Normalized cell surface CD48 expression by flow cytometry on sgSTAT5B-transduced ATLL cells. Error bars represent the SEM of replicates. ∗P < .05, ∗∗P < .01, and ∗∗∗P < .001, Welch 2-sample t-test.
CD48 expression is decreased in primary ATLL cells
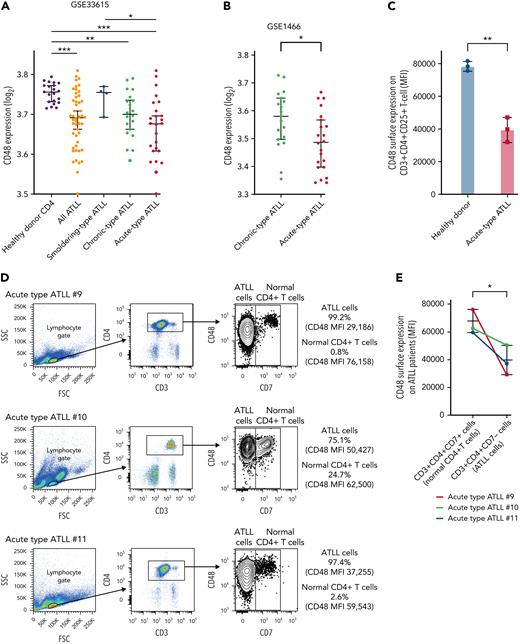
Having discovered a potent survival advantage of CD48 loss in ATLL cells, we next addressed whether CD48 expression is decreased in primary ATLL cells. We used a whole-genome mRNA expression microarray dataset (GSE 33615) comprising 50 ATLL cases with different clinical subtypes and normal CD4+ T cells from 21 healthy donors. CD48 mRNA expressions in ATLL samples were significantly lower than those in normal CD4+ T cells. Notably, a reduction in CD48 expression levels was linked to ATLL disease aggressiveness represented by 3 clinical subtypes of smoldering (indolent), chronic-type (less aggressive), and acute-type (aggressive) (Figure 6A). Moreover, the association of downregulation of CD48 expression along with increased clinical aggressiveness was also confirmed in another dataset comprising 19 chronic-type cases and 22 acute-type cases with statistical significance (Figure 6B, GSE 1466; P = .026). Our flow cytometry analysis confirmed that there was about a 50% reduction of CD48 protein on the cell surface of acute-type ATLL cells compared with normal CD4 T cells (Figure 6C). Moreover, cell surface expression of CD48 on neoplastic ATLL cells (CD3+CD4+CD7−) was significantly lower than that of bystander normal CD4 T cells (CD3+CD4+CD7+) in the samples of individual patients with ATLL (Figure 6D-E) while CD3+CD4+CD7− cells and CD3+CD4+CD7+ cells (both were normal CD4 T cells) in healthy donor-derived PBMCs expressed comparable concentrations of CD48 (supplemental Figure 6A-B). These findings in primary ATLL samples, together with our in vitro functional data (Figures 1-5), support the notion that decreased CD48 expression is involved in the disease progression of ATLL by modulating NK-cell–mediated ATLL surveillance.
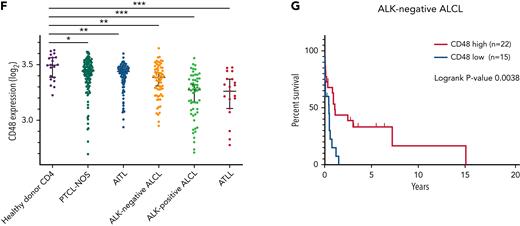
CD48 expression concentrations were decreased in parallel with ATLL disease aggressiveness. (A) CD48 mRNA expression in CD4 T cells purified from peripheral blood of healthy donors (n = 21), smoldering-type ATLL (n = 4), chronic-type ATLL (n = 20), and acute-type ATLL (n = 26). Data were obtained through a publicly available microarray dataset GSE33615. (B) CD48 mRNA expression in CD4 T cells purified from peripheral blood of chronic-type ATLL (n = 19) and acute-type ATLL (n = 22) from another publicly available microarray dataset GSE1466. (C) Cell surface CD48 expression by flow cytometry on CD3+CD4+CD25+ T cells in healthy donors (n = 3; healthy donor #1, #7, and #8) and acute-type ATLL patients (n = 3; acute-type ATLL #9, #10, and #11). (D) Cell surface CD48 expression using flow cytometry on ATLL cells or normal bystander CD4+ T cells in 3 patients with acute ATLL (#9, #10, and #11). Representative dot plots are indicated for the gating strategy for ATLL cells (CD3+CD4+CD7−) or normal bystander CD4+ T cells (CD3+CD4+CD7+). Mean fluorescence intensity (MFI) of CD48 was shown on the right side. (E) MFI of CD48 in ATLL cells or normal bystander CD4 T cells from (D) were plotted. (F) CD48 mRNA expression in CD4 T cells purified from peripheral blood of healthy donors (n = 20) and in lymph node biopsy samples of PTCL NOS (n = 144), AITL (n = 127), ALK− ALCL (n = 69), ALK+ ALCL (n = 53), and ATLL (n = 16) from a publicly available microarray dataset. (G) Kaplan-Meier curve for overall survival in ALK− ALCL with higher (n = 22) or lower (n = 15) CD48 expression values. The threshold was set as the median value of CD48 expression. P value of the log-rank test statistic is shown. Error bars represent median and 95% CI in (A), (B), and (F), and mean and 95% CI in (C) and (E). ∗P < .05, ∗∗P < .01, ∗∗∗P < .001, Welch 2-sample t-test.
CD48 expression concentrations were decreased in parallel with ATLL disease aggressiveness. (A) CD48 mRNA expression in CD4 T cells purified from peripheral blood of healthy donors (n = 21), smoldering-type ATLL (n = 4), chronic-type ATLL (n = 20), and acute-type ATLL (n = 26). Data were obtained through a publicly available microarray dataset GSE33615. (B) CD48 mRNA expression in CD4 T cells purified from peripheral blood of chronic-type ATLL (n = 19) and acute-type ATLL (n = 22) from another publicly available microarray dataset GSE1466. (C) Cell surface CD48 expression by flow cytometry on CD3+CD4+CD25+ T cells in healthy donors (n = 3; healthy donor #1, #7, and #8) and acute-type ATLL patients (n = 3; acute-type ATLL #9, #10, and #11). (D) Cell surface CD48 expression using flow cytometry on ATLL cells or normal bystander CD4+ T cells in 3 patients with acute ATLL (#9, #10, and #11). Representative dot plots are indicated for the gating strategy for ATLL cells (CD3+CD4+CD7−) or normal bystander CD4+ T cells (CD3+CD4+CD7+). Mean fluorescence intensity (MFI) of CD48 was shown on the right side. (E) MFI of CD48 in ATLL cells or normal bystander CD4 T cells from (D) were plotted. (F) CD48 mRNA expression in CD4 T cells purified from peripheral blood of healthy donors (n = 20) and in lymph node biopsy samples of PTCL NOS (n = 144), AITL (n = 127), ALK− ALCL (n = 69), ALK+ ALCL (n = 53), and ATLL (n = 16) from a publicly available microarray dataset. (G) Kaplan-Meier curve for overall survival in ALK− ALCL with higher (n = 22) or lower (n = 15) CD48 expression values. The threshold was set as the median value of CD48 expression. P value of the log-rank test statistic is shown. Error bars represent median and 95% CI in (A), (B), and (F), and mean and 95% CI in (C) and (E). ∗P < .05, ∗∗P < .01, ∗∗∗P < .001, Welch 2-sample t-test.
CD48 expression is decreased in other subgroups in aggressive peripheral T-cell lymphomas
Having a possible role of CD48 in the pathogenesis of ATLL, we analyzed CD48 expression levels among other aggressive peripheral T-cell lymphomas besides ATLL. For this issue, we used an integrated whole-genome mRNA expression microarray dataset comprising a total of 409 T-cell lymphoma samples (144 peripheral T-cell lymphomas, not otherwise specified [PTCL NOS], 127 angioimmunoblastic T-cell lymphomas [AITL], 69 ALK− anaplastic large-cell lymphomas [ALK− ALCL], 53 ALK+ anaplastic large-cell lymphomas [ALK+ ALCL], 16 ATLL and 20 CD4+ T cells from healthy donors).15-23 The amount of CD48 mRNA was significantly lower in PTCL NOS (P = .0375), AITL (P = .0077), ALK− ALCL (P = .0017), ALK+ ALCL (P < .0001), and ATLL (P < .0001) than those in the CD4+ T cells from healthy donors (Figure 6F). In particular, the amounts of CD48 mRNA in ALK+ ALCL and ATLL were significantly decreased compared with those in other mature T-cell lymphomas (P < .0001 and P < .0001, respectively). These results suggest that CD48 is likely involved in the pathogenesis of PTCL, especially ALK+ ALCL and ATLL.
In this dataset, survival data were available in PTCL NOS, AITL, and ALK− ALCL. When we set the median value of CD48 expression as a cutoff tentatively, ALK− patients with ALCL with lower CD48 expression showed inferior prognosis as compared with those with higher CD48 expression (P = .0038) (Figure 6G), whereas this was not the case with patients with PTCL NOS and AITL. Given the potential impact of decreased CD48 on the pathobiology of ALK− ALCL, we performed in vitro functional assays using a TLBR2 ALK− ALCL cell line. Downmodulation of CD48 expression by sgCD48 rendered TLBR2 cells resistant to NK cells from healthy donor #1 (supplemental Figure 6C). Altogether, our study suggests that CD48 downregulation may have a role in evading NK-cell–mediated immune surveillance in ALK+ and ALK− ALCL and ATLL.
Discussion
To discover ATLL cell-intrinsic molecules which possibly contribute to the escape from NK-cell–mediated cytotoxicity, we performed a genome-wide CRISPR knockout library screen. CD48 was identified in the top 5 enriched genes in this screen. The acquired resistance to NK-cell–mediated direct cytotoxicity in CD48 knockout ATLL cells was confirmed by using a YT1–NK cell line, primary NK cells from 4 healthy donors, and primary NK cells from 2 patients with ATLL. By using primary patient data, we showed that CD48 mRNA concentrations were downregulated in ATLL in parallel with disease aggressiveness, indicating the clinical relevance of CD48 in the pathogenesis of ATLL. Primary ATLL cells expressed surface CD48 protein in approximately 50% reduction (Figure 6C), which might be sufficient to confer a survival advantage, particularly when accumulated over the years. We found that disruption of the IL2/STAT5B axis decreased CD48 expression in IL2-dependent ATLL cell lines, mirroring the fact that primary ATLL cells rarely showed activated STAT524 and appeared unresponsive to IL-2 in a majority of ATLL cases, especially in the aggressive phase.25,26 Lymphoma cells in other aggressive PTCL subtypes also showed decreased concentrations of CD48 expression. ALK+ ALCL cells had almost an equivalent concentration of CD48 expression as ATLL cells. We found that lower CD48 expression was also associated with a worse prognosis in ALK− ALCL. The possible cause behind this finding was suggested by the essentiality of CD48 in NK-cell–mediated cytotoxicity with an ALK− ALCL patient-derived TLBR2 cell line. Collectively, the findings presented here demonstrate that CD48 expression is an important determinant for the NK-cell–mediated immune surveillance in certain aggressive PTCLs.
NK cells have been recently shown to be associated with clinical responses to PD-1 blockade in certain solid tumors and Hodgkin lymphoma.11,27,28 Notably, several studies pointed to direct NK-cell–mediated toxicity in the contribution to the enhanced antitumor immune reactivity by anti-PD1/PD-L1 checkpoint blockade.29-31 Anti-PD1 checkpoint blockade is currently under evaluation in aggressive T-cell lymphomas, including ATLL (NCT02631746 and UMIN000020601). Given that, our work presented here supports future evaluation of CD48 expression as a biomarker for checkpoint blockade therapies in aggressive T-cell lymphomas.
CD48 is constitutively expressed in hematopoietic cells. It was previously reported that CD48-null mice developed B-cell lymphoma because of microenvironment dysregulation.32 Other studies showed that acute myelogenous leukemia cells evade NK-cell surveillance by reducing CD4833,34 or potentially producing a soluble form.35 Although there was a conference abstract reporting the potential role of CD48 for NK-cell–mediated cytotoxicity in ALK+ ALCL,36 to our knowledge, this is the first journal article in lymphoma addressing the intrinsic role of CD48 in the evasion of NK-cell–mediated immune surveillance. NK cell activation is tightly regulated by a balance of highly diverse activating and inhibitory NK-cell receptors, suggesting the possibility that individual tumor cells may evolve their own mechanism to evade NK-cell–mediated surveillance. In this regard, it is noteworthy that CD48 loss was commonly observed in the acquired resistance to NK-cell–mediated killing in all 5 PTCL cell lines tested in this study (4 ATLL cell lines and 1 ALK− ALCL cell line).
NK cells are known to be synergistically activated upon coengagement of 2B4 with NKG2D and/or DNAM-1.37,38 In our CRISPR screen, the enrichments of NKG2D ligands (MICA, MICB, ULBP1, ULBP2, UBLP3, and RAETL1) and DNAM-1 ligands (PVRL1 and PVRL2) were minor and did not reach statistical significance in the MAGeCK algorithm (data not shown), implying molecular compensation among NKG2D ligands and DNAM-1 ligands. In contrast, our results suggest that CD48 dominated the 2B4-mediated NK-cell activation of ATLL cells. It remains to be clarified whether CD48 downregulation dampens the synergistic cooperation of the receptors.
In our CRISPR screening, HLA-E was ranked second among known NK-cell ligands (Figure 1D). HLA-E interacts with the inhibitory receptor NKG2A and the activating receptor NKG2C on NK cells, suggesting the dominant function of NKG2C in YT1 NK cells. The role of HLA-E in T-cell lymphoma cells for evasion from NK-cell killing may be worth analyzing in future studies.
A cell adhesion molecule CD58, a homolog of CD48, activates NK cells and T cells through the interaction with CD2. Previous studies suggested that CD58 was involved in immune evasion since somatic mutations and genomic loss of CD58 were frequently found in the malignant cells of patients with T-cell and B-cell lymphoma.2,39-45 However, CD58 knockout in ATLL cells did not affect sensitivity to NK-cell–mediated cytotoxicity in our CRISPR library screen and following functional experiments. Given that the role of CD58 in NK-cell–mediated cytotoxicity was functionally confirmed in B-cell lymphoma cells,39 CD58 might have differential roles in the pathogenesis of B- and T-cell lymphomas. This notion further highlights a critical role for CD48 among cell adhesion molecules in the context of T-cell lymphoma pathogenesis.
Acknowledgments
The authors thank Y. Yamada, T. Hata, N. Arima, and A.L. Epstein for cell lines and C. Yokoyama for technical assistance.
This research was supported by JSPS KAKENHI Grant Number JP18K08313 and JP21H02775, and research grants from The Princess Takamatsu Cancer Research Fund, SENSHIN Medical Research Foundation, and Takeda Science Foundation for M.N.; NIH R01 CA259188 and CA251674 for Y.Y.; the Platform Project for Supporting in Drug Discovery and Life Science Research (platform for drug discovery, informatics, and structural life science) from Japan Agency for Medical Research and Development (AMED) for K.M.; and by the Intramural Research Program of the National Institutes of Health, National Cancer Institute, Center for Cancer Research for T.A.W. This work was the result of using research equipment shared in Ministry of Education, Culture, Sports, Science and Technology (MEXT) Project for promoting public utilization of advanced research infrastructure (program for supporting the introduction of the new sharing system). Grant Number JPMXS0420100121.
Authorship
Contribution: M.C. designed and performed experiments, analyzed data, and wrote the manuscript; J.S. and Y.Y. designed and performed experiments and analyzed data; T.I. and N.T. performed experiments; H.G., L.P.P., S.H., and T.T. analyzed data; K.K., R.O., T.A., K.I., S.O., K.M., H.H., and M.M. contributed vital resources; T.A.W. designed and supervised research; and M.N. designed and performed experiments, analyzed data, wrote the manuscript, and supervised research.
Conflict-of-interest disclosure: The authors declare no competing financial interests.
Correspondence: Masao Nakagawa, Department of Hematology, Hokkaido University Faculty of Medicine, Kita 15, Nishi 7, Kita-ku, Sapporo 060-8638, Japan; e-mail: nakagawam@med.hokudai.ac.jp.
References
Author notes
The online version of this article contains a data supplement.
The publication costs of this article were defrayed in part by page charge payment. Therefore, and solely to indicate this fact, this article is hereby marked “advertisement” in accordance with 18 USC section 1734.


This feature is available to Subscribers Only
Sign In or Create an Account Close Modal