

Key Points
MH fusion impairs B-cell development and cooperates with NRASG12D mutation to trigger BCP-ALL.
MEF2D-DNA structure and identification of MEF2D fusion target genes reveal novel MEF2D-driven molecular mechanisms and targeted therapy.

Abstract
Recurrent MEF2D fusions with poor prognosis have been identified in B-cell precursor ALL (BCP-ALL). The molecular mechanisms underlying the pathogenic function of MEF2D fusions are poorly understood. Here, we show that MEF2D-HNRNPUL1 (MH) knock-in mice developed a progressive disease from impaired B-cell development at the pre–pro-B stage to pre-leukemia over 10 to 12 months. When cooperating with NRASG12D, MH drove an outbreak of BCP-ALL, with a more aggressive phenotype than the NRASG12D-induced leukemia. RNA-sequencing identified key networks involved in disease mechanisms. In chromatin immunoprecipitation–sequencing experiments, MH acquired increased chromatin-binding ability, mostly through MEF2D-responsive element (MRE) motifs in target genes, compared with wild-type MEF2D. Using X-ray crystallography, the MEF2D-MRE complex was characterized in atomic resolution, whereas disrupting the MH-DNA interaction alleviated the aberrant target gene expression and the B-cell differentiation arrest. The C-terminal moiety (HNRNPUL1 part) of MH was proven to contribute to the fusion protein’s trans-regulatory activity, cofactor recruitment, and homodimerization. Furthermore, targeting MH-driven transactivation of the HDAC family by using the histone deacetylase inhibitor panobinostat in combination with chemotherapy improved the overall survival of MH/NRASG12D BCP-ALL mice. Altogether, these results not only highlight MH as an important driver in leukemogenesis but also provoke targeted intervention against BCP-ALL with MEF2D fusions.
Introduction
Acute lymphoblastic leukemia (ALL), a group of hematologic malignancies caused by the clonal proliferation of lymphoid progenitor cells, is a worldwide health concern.1 According to the immunophenotype, ALL can be divided into 2 major subclasses: B-cell precursor ALL (BCP-ALL) and T-cell ALL. BCP-ALL accounts for about 80% of ALL cases and is often associated with various genetic lesions, including the oncogenic fusions derived from chromosomal translocations. It has been shown that the genetic lesions might interfere with a variety of cellular events, such as lymphoid development, cytokine receptors, RAS signaling, tumor suppression, and epigenetic controls.2 Over the past several years, recurrent fusions between MEF2D and distinct partner genes were identified in BCP-ALL by using RNA-sequencing (RNA-seq),3-6 with frequencies of 4.2% and 3.2% in adult and pediatric patients, respectively.7 Of note, patients with MEF2D fusions form a unique group with a pre-B cell immunophenotype, similar gene expression profiles, and a poor clinical outcome, with 5-year survival rates of 33.3% in children and 15.6% in adults.3 In addition, MEF2D fusions are frequently associated with hotspot point mutations in the NRAS gene, suggesting possible cooperation between the 2 genetic events in disease development.5
Until now, 9 different types of MEF2D fusions have been reported in BCP-ALL, namely MEF2D-BCL9, MEF2D-HNRNPUL1, MEF2D-DAZAP1, MEF2D-CSF1R, MEF2D-FOXJ2, MEF2D-STAT6, MEF2D-SS18, MEF2D-HNRNPH1, and MEF2D-HNRNPM.3-6,8-12MEF2D-HNRNPUL1(MH) and MEF2D-BCL9(MB) are the 2 most observed in patients. In all fusion variants, the N-terminal MEF and MADS-box domains (ie, residues 1-86 derived from wild-type [WT] MEF2D protein) are strictly conserved, suggestive of a pivotal role of this region in leukemogenesis. The WT MEF2D protein is a member of the myocyte enhancer factor 2 (MEF2) transcription factor (TF) family, which has been found to be important in the modulation of cell differentiation, survival, proliferation, and various adaptive responses.13-17 MEF2C and MEF2D, in particular, are highlighted as key components of the transcriptional complex that orchestrates B-cell development.18HNRNPUL1 encodes a nuclear RNA-binding protein of the heterogeneous nuclear ribonucleoprotein family that plays an important role in messenger RNA processing and transport, DNA double-strand break and repair,19 and histone gene transcription.20HNRNPUL1 showed high mutation frequencies in uterine corpus endometrial carcinoma and stomach adenocarcinoma, participating in cancer-related pathways.21 When fused to MEF2D, HNRNPUL1 retains domains that are involved in the interaction with TP53 and BRD7, and is believed to regulate transcription and RNA binding. Previous studies showed that the nuclear expression of MB and MH could cause aberrant regulation of HDAC9 and RAG1 resulting in a partial B-cell development arrest in vitro,3 whereas HDAC9 deregulation was capable of promoting development of lymphoproliferative disease and lymphoma in Eμ-HDAC9 mice.22 Furthermore, in bone marrow (BM) transplantation experiments, ∼50% of the mice that were administered the MB-expressing pro-B cells developed overt leukemia.4 These results led to early recognition of the leukemogenic activity of MEF2D fusions.
In the current report, using conditional MH knock-in mice as a model, we addressed the mechanisms at molecular, cellular, and organism levels underlying the transforming effect of MEF2D fusion on early BCPs, alone and in collaboration with NRASG12D. Using chromatin immunoprecipitation sequencing (ChIP-seq) analysis in human CD34 cells and X-ray crystallography, we investigated the molecular and structural features of MEF2D-responsive element (MRE) that underpin the MH-driven trans-regulation of target genes. We also designed experiments to explore the possible contribution of the C-terminal part of the MH fusion (MH-C) to partner recruitment and overall trans-regulatory activities. In addition, we evaluated the impact of blocking MH-DNA engagement on B-cell differentiation arrest and the potential effect of a histone deacetylase inhibitor (HDACi) on survival in MH/NRASG12D BCP-ALL mice.
Materials and methods
Mice generation and breeding
Mef2d-HNRNPUL1 (MH) conditional knock-in mice were obtained from the Nanjing Biomedical Research Institute of Nanjing University. The invertor cassette, which contained the complementary DNA (cDNA) sequences of human HNRNPUL1 exon 12-15, mouse exon 9 of Mef2d, and two mutant Lox P (Lox 66 and Lox71), was inserted into intron 8 of the mouse Mef2d locus by using CRISPR/Cas9 technology. When Cre recombinase was activated, the DNA sequence flanked by Lox66 and Lox71 was inverted, resulting in expression of the MH fusion gene. The insertion of the human HNRNPUL1 fragment was verified by polymerase chain reaction (PCR) using primers specific for the knock-in allele (supplemental Figure 1B [available on the Blood Web site]; supplemental Table 9). The Vav-cre and Mx1-cre mice were crossed with MH knock-in mice to generate MH-Vav and MH-Mx1 strains. For MH-Mx1 mice, polyinosinic–polycytidylic acid was injected at week 4 to induce the expression of MH fusion. In MH-Vav mice, MH expression was monitored by reverse transcriptase-PCR (RT-PCR) and western blot using MH-specific primers and antibody against Mef2d (ab 93257) (supplemental Figure 1C-D). For the secondary BM transplantation assay, total BM cells were isolated from the CD45.2 WT and MH-Vav donor mice (6-month). Then, 5 × 10⁶ cells per mice were transplanted into the irradiated CD45.1 recipient mice (700 cGy) through lateral tail vein injection. We checked the leukemogenic development in the peripheral blood (PB), BM, and spleen of the recipient mice by monitoring 10 months after transplantation.
The MH/NRASG12D mouse model was established similar to that described previously for B-ALL mice model construction.23,24 The CD19+ B lineage cells isolated from the BM of 8-week-old WT and MH-Vav donor mice using MACS (Miltenyi Biotec) were infected with Migr1-green fluorescent protein (GFP) (vehicle) or NRASG12D-Migr1-GFP (NRASG12D) retroviruses in Dulbecco’s modified Eagle medium supplemented with 5% fetal bovine serum, 5% WEHI-3 conditioned medium, interleukin-7 (10 ng/mL), and 8 μg/mL polyaniline. Six hours after transduction, 1 × 10⁶ CD19+ B cells with 2 × 10⁵ helper cells (total BM cells from syngeneic mice) were transplanted into sublethally irradiated (450 cGy) recipient mice. In the secondary or tertiary transplantation, 1 × 10⁶ BM cells from NRASG12D or MH/NRASG12D BCP-ALL mice of primary or secondary transplantations were transplanted into sublethally irradiated (450 cGy) recipient mice.
Mice used in this study were of C57BL/6 background and housed in pathogen-free circumstances in the Research Center for Experimental Medicine at Ruijin Hospital affiliated with the Shanghai JiaoTong University School of Medicine. All animal experiments, which were conducted following the institutional ethical guidelines of animal care, were approved by the Animal Care and Use Committee of Shanghai JiaoTong University School of Medicine.
RNA-seq data analysis
Paired-end RNA-seq reads from Illumina Hiseq X10 platform were mapped against the reference genome of mouse (mm10) and human (GRCH38) using open source software STAR (version 2.5.3, https://github.com/alexdobin/STAR/releases), and the mapped reads were then counted by using open source software HTSeq (version 0.9.1, https://pypi.org/project/HTSeq/). The normalized gene expression value and differentially expressed genes were both analyzed by using R package DESeq2. The genes differentially expressed were evaluated with strict criteria, in which the absolute log2(Foldchange) value was >1.5, and the adjusted P value was <.05 (false discovery rate, <0.05). Gene ontology (GO) analysis and scatter plot for differentially expressed genes were estimated by using R packages clusterProfiler and ggplot2, respectively. Gene Set Enrichment Analysis (GSEA) was performed by using the command line tool, and the input count matrix was normalized following the GSEA group’s recommendation. The parameter metric was set to “Signal2Noise,” and others were default.
ChIP-seq and data analysis
Then, 2 × 10⁷ CD34+ cells sorted from human cord blood containing the plasmids LEGO-iG2, LEGO-iG2-Flag-MH-fusion, or LEGO-iG2-Flag-MEF2D were collected. ChIP DNA was prepared by using the ChIP-IT High Sensitivity Kit (Active Motif). Immunoprecipitation was performed with the antibody against Flag (Proteintech). The ChIP-seq DNA libraries were constructed by using the VAHTS Universal Pro DNA Library Prep Kit (Vazyme) according to the manufacturer’s instructions. The libraries were sequenced on the NovaSeq 6000 (Illumina). For data analysis, we used the nextflow-based workflow nf-core/chipseq (version 1.2.1) to analyze raw ChIP-seq reads with the command “nextflow run nf-core/chipseq –input sampleinfo.csv -profile singularity –fasta GRCh38.primary_assembly. genome.fa–150 single_end –gtf gencode.v38.annotation.gtf –macs_gsize 2.7e9 –skip_fastqc –save_macs_pileup.”25 The core pipeline steps include: (1) adapter trimming, alignments of the raw reads using bwa; (2) mark duplicated reads using picard; (3) filtration and removing background reads using samtools, bedtools, and pysam; (4) creating normalized bigWig alignments using bedtools and bedGraphToBigWig for visualizations; (5) calling of broad/narrow peaks using MACS2; and (6) motif annotation of binding peaks using HOMER. More detailed information of the pipeline is available at https://github.com/nf-core/chipseq.
Protein purification of MEF2D2-95
The N-terminal residues 2-95 of human MEF2D and structure-based mutants were cloned into pET32m (Novagen), which belongs to the T7 expressing system. The restriction enzymes EcoRI and XhoI for subcloning were purchased from New England Biolabs. The 2 × SuperStar Plus PCR Mix was obtained from GenStar. The sequencing of recombined plasmid was conducted by Sangon. The WT MEF2D and mutant recombined plasmids were transformed into chemically competent Escherichia coli BL21 (DE3). The cultures were first incubated in a rotary shaker for 3 hours at 37°C (optical density at 600 nm = 0.6-0.8). Protein expression was induced with 0.5 mM β-d-1-thiogalactopyranoside at 16°C for 16 hours. The cells were harvested by centrifuging for 20 minutes at 4000 rpm and resuspended with the buffer containing 20 mM Tris-HCl pH 8.0, 100 mM NaCl. After centrifugation, the filtered supernatants were loaded onto a HisTrap (GE Healthcare) pre-equilibrated with the buffer consisting of 20 mM Tris-HCl pH 8.0, 100 mM NaCl. The MEF2D2-95 protein was first washed by using 20 mM Tris-HCl pH 8.0, 500 mM NaCl, and 20 mM imidazole, and further eluted with 150 mM imidazole. The His tag was then removed by thrombin (MilliporeSigma) cleavage. The protein samples were further purified by using the SP column (GE Healthcare), followed by a final polishing step using the gel filtration S100 column (GE Healthcare).
Crystallization and structural determination of MEF2D2-95-DNAMRE complex
The DNA sequences (5′-AACTATTTATAAGA-3′, in which the MRE site is underlined, and its complementary counterpart 5′-TTCTTATAAATAGT-3′) were purchased from Sangon. The concentration of DNA dissolved with sterilized water was 10 mM. After DNA renaturation, the double-stranded DNA was concentrated to 200 μg/μL before crystallization. The MEF2D-DNA complex was prepared by mixing the recombinant protein and MRE duplex at a 2:1 molar ratio at a final protein concentration of 12 mg/mL on ice for 30 minutes. Initial crystallization screening was developed by using the kits of JBScreen Classic 1-10 and JBScreen Kinase 1-4 (both, Jena Bioscience). Standard hanging drop crystal trials were conducted with a 100 μL reservoir in 48-well crystallization plates at 20°C. Each droplet consisted of 0.5 μL protein and 0.5 μL crystallization liquor. After optimization, cubic crystals were obtained in the buffer consisting of 25% (wt/vol) polyethylene glycol (PEG) monomethyl ether 2000 at 20°C.
The crystals of the MEF2D-DNA complex were cryo-protected by using Paratone-N oil (Hampton Research) and flash-frozen in liquid nitrogen. Diffraction data were collected on beamline BL17U at the Shanghai Synchrotron Radiation Facility. The diffraction data were processed, integrated, and scaled by using programs MOSFLM and SCALA.26 The initial phases were estimated by molecular replacement using the published MEF2 structure (PDB code, 6BYY) as a search template. REFMAC527 and PHENIX.REFINE,28 together with manual building implemented in COOT,26 were used to improve the initial phases. The final model contains 4090 atoms from residues/nucleotides and 6 water molecules. Ramachandran statistics estimated by PROCHECK29 showed that 85.1% and 14.6% of the atoms were in the most favored or allowed regions, respectively. The detailed structure refinement statistics are reported in supplemental Table 8. The MEF2D2-95-DNAMRE coordinates have been deposited into the Protein Database Bank with the entry code of 7X1N.
Biolayer interferometry assay
Biolayer interferometry measurements were done at 30°C by using an Octet RED96 instrument with the Streptavidin (SA) biosensors (ForteBio). The experiment was conducted with the 4-(2-hydroxyethyl)-1-piperazine ethanesulfonic acid (HEPES)-buffer saline (HBS), a buffer consisting of 10 mmol/L HEPES, 150 mmol/L NaCl, pH = 7.4, 150 mM NaCl, and 0.005% (vol/vol) Tween-20. The SA biosensors were used to immobilize the free MRE DNA. Then, the SA biosensors coated with MRE DNA were mixed with WT/mutant MEF2D2-95 at various concentrations ranging from 0.5 to 1024 μm. The HEPES-buffer saline with 0.005% Tween-20 (vol/vol), pH = 7.4 buffer without protein was used as negative control. The binding kinetics value was estimated by using an algorithm implemented in program ForteBio Data Analysis Version 7.1.
Mammalian two-hybridization assay
This assay was conducted by using the CheckMate Mammalian Two-Hybrid System (Promega) in 293T cells. To detect the interaction between MH, MEF2D, and MH-C to HDAC9 or P300, respectively, the cDNA of MH, MEF2D, and MH-C were cloned into pBIND vectors, while the cDNA of HDAC9 and P300-TAZ2 domain were engineered into pACT vectors. The 293T cells were cotransfected with pG5-luc, pACT-HDAC9/P300, and pBIND-MH/MEF2D/MH-C mixtures at a molar ratio of 1:1:1 using Lipofectamine 2000 (Invitrogen), respectively. For the dimerization detection of MEF2D and MH, the 293T cells were cotransfected with pG5-luc, pACT-MEF2D/MH, and pBIND-MEF2D/MH mixtures at a molar ratio of 1:1:1. After 48 hours’ culture, the transfected 293T cells were collected and lysed with lysis buffer. The Dual-Luciferase Reporter Assay System (Promega) was used to detect the relative luciferase activities.
In vivo drug experiment
Then, 1 × 10⁶ spleen cells from MH/NRASG12D BCP-ALL mice of secondary transplantations were transplanted into sublethally irradiated (450 cGy) recipient mice. The MH/NRASG12D tertiary recipient mice were subjected to the treatment of solvent (as control), 2.5 mg/kg panobinostat (Selleck, S1030), 0.15 mg/kg vincristine (VCR) (Selleck, S1241) plus 1 mg/kg dexamethasone (DEX) (Selleck, S1322), and panobinostat in combination with VCR + DEX, intraperitoneally for 4 cycles of 5-days-on/2-days-off after transplantation. Panobinostat was diluted in 2% dimethyl sulfoxide, 48% PEG 300, 2% Tween 80, and double-distilled water. VCR was diluted in double-distilled water. DEX was diluted in 5% dimethyl sulfoxide, 45% PEG 300, and double-distilled water.
More information concerning materials and methods used in this study are described in the supplemental Materials and Methods.
Results
Impaired B-cell development in MH knock-in mice and leukemogenic potential of MH fusion
To better understand the function of MEF2D fusions in deregulating B-cell development, we established conditional knock-in mouse models expressing the Mef2d-HNRNPUL1(MH) chimeric gene (supplemental Figure 1A-D). Via cross-breeding, we successfully obtained the MH-Vav mice (with MH being expressed immediately following birth) and MH-Mx1 mice (with conditional MH expression upon treatment with polyinosinic–polycytidylic acid at week 4 following birth). The resulting MH in knock-in mice shared 99.2% homology with those observed in patients with BCP-ALL. By RT-PCR, MH expression was confirmed in hematopoietic cells in BM, PB, and spleen but not in other organs (supplemental Figure 1E).
The signs of early abnormal hematopoietic development came from young (1-2 months following birth) to 8-month-old mice when MH-Vav and MH-Mx1 mice displayed reduced white blood cell (WBC) counts in PB compared with control mice (supplemental Figure 1F). Using fluorescence-activated cell sorter (FACS) analysis, a significant drop in B cells was observed in PB and BM (Figure 1A; supplemental Figure 1G-H). Scrutiny of B-lineage cells using markers, including B220, IgM, CD19, and CD43, confirmed a differentiation arrest at pre–pro-B cell stage in BM (Figure 1A; supplemental Figure 1H). Overall, 18.1% of the B220+IgM– B-cell population were B220+/CD43+/CD19– pre–pro-B precursors in the BM of WT mice. In marked contrast, the B-lineage differentiation was severely disrupted by MH fusion (64.9% and 53.8% pre–pro-B precursors in MH-Vav and MH-Mx1 mice, respectively). Consequently, MH mice produced much less pro-B, pre-B, immature B, and mature B cells in the BM. In the spleen, the fraction of IgM+/IgD+ mature B cells dropped from 74% in WT mice to ∼50% in MH mice (supplemental Figure 1I). The MH-Vav and MH-Mx1 mice displayed moderately enlarged spleens (supplemental Figure 1J), and pathologic data revealed an enlarged size splenic nodule in both mouse models (supplemental Figure 1K). Similarly, MH hematopoietic progenitor cells (Lineage–/cKitlow) failed to undergo B-lineage differentiation in cell culture favoring CD19+ cells (supplemental Figure 1L).


Abnormal B-cell differentiation and pre-leukemia symptoms in MH knock-in mice. (A) FACS characterization of pre–pro-B cells, pro-B cells, pre-B cells, immature B cells, and mature B cells in the BM of WT and MH-Vav mice at 6 months. Left panel: statistical summary. Right panel, FACS analysis of BM cells. The B220+/IgMlow were pooled and subjected to further FACS analysis by using markers CD19 and CD43. (B) PB monitoring of 12-month MH mice. (C) FACS analysis of PB cells using markers B220, CD3, and Mac-1. (D) Visualization of immature cells in BM. Left panel, statistical summary. Right panel, morphologic visualization. (E-F) Abnormal differentiation in hematopoietic stem cells. Left panel, statistical summary. Right panel, FACS analysis with various cell markers (supplemental Table 10). (G) Lin–, B220+, CD3+, and Mac-1+ populations in BM. (H) FACS analysis of B-, T-, and myeloid lineages in BM using markers B220/CD43/CD19, CD4/CD8, and Mac-1/Gr-1, respectively. (I-K) Macro-anatomic examination of pre-leukemia status in 12-month MH mice. Comparisons of lymph nodes (I) and spleen (J-K) between WT and MH mice. (L) Hematoxylin and eosin (HE)-stained histopathologic sections of WT and MH spleens, in which the B cells were immunohistochemically stained by using the antibody against B220. (M) FACS analysis of MH spleen cells using markers B220, CD3, and Mac-1. (N) FACS analysis of B220+ spleen cells using markers CD19, CD43, IgM, IgD, CD21, and CD23. Data are presented as mean ± standard error of the mean and were analyzed by using the t test. *P < .05, **P < .01, ***P < .001. CLP, common lymphoid progenitor; Hgb, hemoglobin; LMPP, lymphoid-primed MPP; LRP, lineage-restricted progenitor; LT-HSC, long-term hematopoietic stem cell; SSC, side scatter; ST-HSC, short-term hematopoietic stem cell.
Abnormal B-cell differentiation and pre-leukemia symptoms in MH knock-in mice. (A) FACS characterization of pre–pro-B cells, pro-B cells, pre-B cells, immature B cells, and mature B cells in the BM of WT and MH-Vav mice at 6 months. Left panel: statistical summary. Right panel, FACS analysis of BM cells. The B220+/IgMlow were pooled and subjected to further FACS analysis by using markers CD19 and CD43. (B) PB monitoring of 12-month MH mice. (C) FACS analysis of PB cells using markers B220, CD3, and Mac-1. (D) Visualization of immature cells in BM. Left panel, statistical summary. Right panel, morphologic visualization. (E-F) Abnormal differentiation in hematopoietic stem cells. Left panel, statistical summary. Right panel, FACS analysis with various cell markers (supplemental Table 10). (G) Lin–, B220+, CD3+, and Mac-1+ populations in BM. (H) FACS analysis of B-, T-, and myeloid lineages in BM using markers B220/CD43/CD19, CD4/CD8, and Mac-1/Gr-1, respectively. (I-K) Macro-anatomic examination of pre-leukemia status in 12-month MH mice. Comparisons of lymph nodes (I) and spleen (J-K) between WT and MH mice. (L) Hematoxylin and eosin (HE)-stained histopathologic sections of WT and MH spleens, in which the B cells were immunohistochemically stained by using the antibody against B220. (M) FACS analysis of MH spleen cells using markers B220, CD3, and Mac-1. (N) FACS analysis of B220+ spleen cells using markers CD19, CD43, IgM, IgD, CD21, and CD23. Data are presented as mean ± standard error of the mean and were analyzed by using the t test. *P < .05, **P < .01, ***P < .001. CLP, common lymphoid progenitor; Hgb, hemoglobin; LMPP, lymphoid-primed MPP; LRP, lineage-restricted progenitor; LT-HSC, long-term hematopoietic stem cell; SSC, side scatter; ST-HSC, short-term hematopoietic stem cell.
Although the reduced WBC count remained relative stable, the MH-Vav mice started to exhibit progressive anemia and thrombocytopenia at the age of 10 to 12 months (Figure 1B). The B220+ B cells in PB were barely detected, whereas the percentages of T cells and granulocytes were relatively increased in MH-Vav mice at 12 months (Figure 1C). Compared with the phenotypes at an early age (ie, 6 months), the gap of the B-cell numbers was greatly widened between WT mice and MH-Vav mice at 12 months, suggestive of a severe block in B-cell differentiation. In line with the pancytopenia in PB, the BM morphologic examination showed an accumulation of blasts with relatively large size and high nuclear/cytoplasmic ratio (18.6% on average) (Figure 1D). This was further supported by FACS analysis of BM cells, revealing a significant expansion of lineage-negative (Lin–) cells. Further investigation with well-established marker combinations showed strikingly increased populations of not only Lin–Sca1+cKit+ (LSK) cells corresponding to hematopoietic stem/progenitor cells but also short-term hematopoietic stem cells, multipotent progenitors (MPPs), lineage-restricted progenitors, and lymphoid-primed MPPs (Figure 1E-F). With regard to the lymphoid lineages, a significant reduction of B220+ B cells was detected (Figure 1G). Using B220/CD43/CD19 marker combination, most BCPs were pre–pro-B cells (Figure 1H). These data suggested that MH fusion could drive an aberrant proliferation of stem cells and progenitors of the hematopoietic system. In parallel to the abnormal hemogram and myelogram, MH-Vav mice displayed overt enlarged lymph nodes and splenomegaly (Figure 1I-K). Pathologic examination revealed that the splenic nodules in MH-Vav mice were enlarged in an irregular shape, with disappearance of normal follicular structure (Figure 1L). Although the proportion of B220+ cells was decreased in MH-Vav mouse spleen compared with the normal control (Figure 1M), their absolute number should be increased in view of the much enlarged volume of the organ. Immunohistochemical analysis showed B220+ cells primarily infiltrated the splenic nodules, whereas FACS analysis revealed that this population was composed of the B220+/CD19+/CD43+/IgM+/IgDlow/CD21–/CD23– immature B cells (Figure 1N). The B220+/CD19+/CD43+/IgM+ B cells were also increased in lymph nodes of MH-Vav mice (supplemental Figure 2A-B). Of note, in MH-Mx1 mice at 12 months, we also observed pancytopenia in PB (supplemental Figure 2C), an abnormal presence of blasts in BM (supplemental Figure 2D), splenomegaly, and enlarged lymph nodes (supplemental Figure 2E). Hence, both murine MH knock-in models developed a pre-leukemia phenotype at the age of 10 to 12 months.
Presuming the pre-leukemia phenotype originated from the hematopoietic stem cells/progenitors transformed by MH fusion, we conducted secondary BM transplantation experiments with BM cells from the primary MH-Vav mice (CD45.2) into sublethally irradiated recipient mice (CD45.1). As expected, the disease phenotypes of the donor mice were entirely recapitulated in the recipients. These included abnormalities in the PB (supplemental Figure 2F-H), B-cell development arrest with increased pre–pro-B cells in BM (supplemental Figure 2I-J), and aberrant expansion of BM LSKs, MPPs, lineage-restricted progenitors, and lymphoid-primed MPPs (supplemental Figure 2K-L). Moreover, the observations of splenomegaly and enlarged lymph nodes with B220+CD43+ B-cell infiltration (supplemental Figure 2M-N) in all recipients showed that these cells indeed originated from the abnormal BM BCPs in MH donors.
MH functioned as an abnormal TF that disrupts B-cell development
To understand how MH fusion TF might deregulate early BCP development and contribute to pre-leukemia transformation, we performed RNA-seq experiments in distinct B-lineage populations in samples from MH-Vav mice over the disease trajectory compared with WT counterparts. We started by examining the gene expression profiles of distinct BM BCPs: pre–pro-B cells (B220+ CD43+ CD19– IgM–), pro-B cells (B220+ CD43+ CD19+ IgM–), and pre-B cells (B220+ CD43− CD19+ IgM−) at the age of 6 months (MH-Vav mice, n = 2; WT mice, n = 2). The differentially expressed genes were evaluated with stringent criteria (ie, fold-change >1.5 and adjusted P value <.05). Among pre–pro-B cells, 193 upregulated genes and 165 downregulated genes were identified. In marked contrast, an obvious increase was observed in the number of deregulated genes in pro-B (1896) and pre-B (2352) stages (Figure 2A; supplemental Figure 3A; supplemental Tables 1-3).

MH-driven transcriptional deregulatory activity in B cells. (A) Genes deregulated in pre–pro-B, pro-B, and pre-B cells. Upregulated or downregulated genes are indicated by red and blue bars, respectively. The raw scatter plot is shown in supplemental Figure 3A. (B) Venn diagram indicating the overlap genes upregulated in pre–pro-B, pro-B, and pre-B cells. (C) Venn diagram indicating the overlap genes downregulated in pre–pro-B, pro-B, and pre-B cells. (D) Heatmap representation of MH modulated genes at different B-cell developmental stages in WT and MH-Vav mice (MH). The representative genes are labeled on the right of the heatmap. (E-F) GO analysis of MH-driven gene deregulations in pro-B cells. (G) Scatter plot of gene expression differences between sorted B220+CD19+IgM + spleen cells of WT and MH mice at 12 months. The normalized expression of each deregulated gene is shown in dots. (H) Quantitative RT-PCR validation of transcript levels of a number of deregulated genes in WT and MH mice. (I) Circos plot of the VHJH rearrangement in WT (n = 3) and MH (n = 3) mice at 12 months. Ribbon widths are proportional to the frequencies of rearrangement events. Diversity of the VHJH rearrangement in WT and MH mice is summarized in the far-right panel. Data are presented as mean ± standard error of the mean and were analyzed by using the t test. **P < .01, ***P < .001. RPM, reads per million.
MH-driven transcriptional deregulatory activity in B cells. (A) Genes deregulated in pre–pro-B, pro-B, and pre-B cells. Upregulated or downregulated genes are indicated by red and blue bars, respectively. The raw scatter plot is shown in supplemental Figure 3A. (B) Venn diagram indicating the overlap genes upregulated in pre–pro-B, pro-B, and pre-B cells. (C) Venn diagram indicating the overlap genes downregulated in pre–pro-B, pro-B, and pre-B cells. (D) Heatmap representation of MH modulated genes at different B-cell developmental stages in WT and MH-Vav mice (MH). The representative genes are labeled on the right of the heatmap. (E-F) GO analysis of MH-driven gene deregulations in pro-B cells. (G) Scatter plot of gene expression differences between sorted B220+CD19+IgM + spleen cells of WT and MH mice at 12 months. The normalized expression of each deregulated gene is shown in dots. (H) Quantitative RT-PCR validation of transcript levels of a number of deregulated genes in WT and MH mice. (I) Circos plot of the VHJH rearrangement in WT (n = 3) and MH (n = 3) mice at 12 months. Ribbon widths are proportional to the frequencies of rearrangement events. Diversity of the VHJH rearrangement in WT and MH mice is summarized in the far-right panel. Data are presented as mean ± standard error of the mean and were analyzed by using the t test. **P < .01, ***P < .001. RPM, reads per million.
Next, we determined the overlap of the deregulated genes in all 3 stages: 115 genes were upregulated, and 26 genes were downregulated (Figure 2B-C). Here, a number of B-lineage–related genes tended to display abnormally decreased expression in the BCP compartments upon effect of MH (Figure 2D) such as Ebf1, Pax5, Ikzf1, Bach2, and Rag1/2. The deregulation of pre–B-cell receptor (pre-BCR) components, including Igll1, Vpreb1, and Vpreb3, and the signal-transducing chains Cd79a was detected. Histone deacetylase (Hdac) family members, Hdac9 and Hdac1, were upregulated, in agreement with the previous reports on BCP-ALL patient samples with MEF2D fusions.3,5,7 Furthermore, the Ap1 family members Jun and Fos and early growth response factor Egr1/2 of immediate early genes (Iegs) were activated, which were repressed in Mef2c/Mef2d double knockout mice.18Vegfc, a member of the vascular endothelial growth factor family promoting lymphangiogenesis,30 angiogenesis, and endothelial cell growth,31 was upregulated in MH mice. Previously, high VEGFC expression was found in BCP-ALL patients with MEF2D fusions,7 and in acute myeloid leukemia with increased drug resistance and adverse prognosis.32
Next, to understand what pathways/networks might be deregulated by MH, we performed GO analysis of MH target genes at the pro-B stage. The activated genes were mainly enriched in cell adhesion molecules, the negative regulation of immune system process, the cytokine–cytokine receptor interaction, MAPK signaling pathway, transcriptional mis-regulation in cancer, angiogenesis, and Ras protein signal transduction (Figure 2E). Contrarily, genes related to V(D)J recombination, DNA repair, and regulation of Wnt signaling pathway were repressed (Figure 2F). Next, we addressed the gene expression profiles of B220+/CD19+/IgM+ splenic B cells in the pre-leukemia stage of MH-Vav mice at 12 months (n = 3) (Figure 2G; supplemental Table 4). A number of key TFs involved in B-cell differentiation, including Mef2c, Ebf1, Foxo1, Runx1, Bach2, Ikzf1, and Lef1, were severely suppressed (Figure 2H; supplemental Figure 3B). However, Hdac family members, including Hdac9, Hdac1, and Hdac4, were activated, together with the histone methyltransferase Ezh2, the apoptosis regulator Bcl2, and Vegfc, genes widely implicated in carcinogenesis.32-34
In agreement with the much-enhanced proliferative potential and infiltration ability of the immature B cells in spleen, the GO analysis showed that the upregulated genes were mainly involved in regulation of MAP kinase activity, positive regulation of Erk1 and Erk2 cascade, and cell cycle phase transition (supplemental Figure 3C). The downregulated genes were instead enriched in FoxO signaling pathway, B-cell differentiation, somatic recombination of immunoglobulin gene segments, and histone acetylation (supplemental Figure 3D). Compared with the high V(D)J recombination diversity in WT mice, the B cells from the enlarged spleen were of oligoclonal origin in that they displayed marked reduction of VHJH and VκJκ rearrangements, corroborating a pre-leukemia status (Figure 2I; supplemental Figure 3E). Meanwhile, the RNA-seq analysis of the expanded BM LSK cells at the pre-leukemia stage at 12 months showed a similar MH-driven deregulation profile, attested by the high expression of Hdac9 and Hdac7 (supplemental Figure 3F-G).
Taken together, the transcriptome features of abnormal cell compartments in the MH-Vav model at various disease stages showed that MH might serve as an important leukemogenic driver for malignant transformation through disrupting the development programs of BCPs.
MH and NRASG12D cooperation triggered severe BCP-ALL
Prompted by the observation that NRAS mutations were frequently detected in BCP-ALL with MEF2D fusions (supplemental Figure 4A; supplemental Table 5)3-7,10,35 and the activation of Ras protein signal transduction in MH mice, we established a MH/NRASG12D two-hit murine model described earlier to further address the leukemogenic activity of MH. CD19+ B-lineage cells isolated from the BM of 8-week-old WT mice and MH-Vav donor mice using MACS were infected with Migr1-GFP (vehicle) or NRASG12D-Migr1-GFP (NRASG12D) retroviruses. After transduction, 1 × 10⁶ CD19+ B-lineage cells with 2 × 10⁵ helper cells were transplanted into sublethally irradiated murine recipients. NRASG12D alone induced leukemia-related death in 4 of 6 mice during an 8-month observation period after transplantation, whereas all 4 MH/NRASG12D mice died of leukemia within 6 months; the difference in the survival curves between the 2 groups was significant (P = .044) (Figure 3A). Although markedly elevated WBC counts, anemia, and decreased platelets were observed in diseased animals in both groups, MH/NRASG12D mice exhibited significantly reduced hemoglobin levels than NRASG12D mice (P = .035) (Figure 3B), indicating a more profound lesion of hematopoiesis in the former group. Wright’s staining of cells from PB, BM, and spleen of MH/NRASG12D mice confirmed the presence of large amounts of lymphoblasts (Figure 3C). FACS analysis showed that the GFP-positive cells from the BM and spleen of MH/NRASG12D mice were CD19+B220+IgM–IgD– (Figure 3D; supplemental Figure 4B), a phenotype comparable to human BCP-ALL with MEF2D fusions. The predominance of BM by leukemic blasts and a huge splenomegaly with complete structural destruction in MH/NRASG12D was indicative of the disease virulence (Figure 3D-F). The CD19+ leukemic blasts also infiltrated liver (supplemental Figure 4C).

MH-fusion drove BCP-ALL in combination with NRASG12D mutation. (A) Kaplan-Meier survival analysis of WT, NRASG12D, MH, and MH/NRASG12D mice. The sample size (n) used in this study is indicated. (B) The WBC, hemoglobin (Hgb), and platelet levels of the MH/NRASG12D mice who died were compared with the WT, NRASG12D, and MH mice at the same age. (C) Morphologic analysis with Wright’s staining of the cells in PB, BM, and spleen of WT, NRASG12D, and MH/NRASG12D mice. (D) FACS analysis of cells in the BM. (E) Spleen sizes from WT, NRASG12D, MH, and MH/NRASG12D mice. (F) Hematoxylin and eosin (HE)-stained sections of the spleen derived from WT, NRASG12D, and MH/NRASG12D mice. Data are presented as mean ± standard error of the mean and were analyzed by using the t test. *P < .05, **P < .01.
MH-fusion drove BCP-ALL in combination with NRASG12D mutation. (A) Kaplan-Meier survival analysis of WT, NRASG12D, MH, and MH/NRASG12D mice. The sample size (n) used in this study is indicated. (B) The WBC, hemoglobin (Hgb), and platelet levels of the MH/NRASG12D mice who died were compared with the WT, NRASG12D, and MH mice at the same age. (C) Morphologic analysis with Wright’s staining of the cells in PB, BM, and spleen of WT, NRASG12D, and MH/NRASG12D mice. (D) FACS analysis of cells in the BM. (E) Spleen sizes from WT, NRASG12D, MH, and MH/NRASG12D mice. (F) Hematoxylin and eosin (HE)-stained sections of the spleen derived from WT, NRASG12D, and MH/NRASG12D mice. Data are presented as mean ± standard error of the mean and were analyzed by using the t test. *P < .05, **P < .01.
In the secondary or tertiary transplantation, 1 × 10⁶ BM cells from MH/NRASG12D BCP-ALL mice of primary or secondary transplantations were transplanted into sublethally irradiated recipient mice, leading to disease death within 3 months or 1 month, respectively (Figure 3A). In the NRASG12D model, the secondary transplantation experiment generated lethal leukemia within 4 months, significantly slower compared with the MH/NRASG12D model. To investigate the transcriptomes of MH in the two-hit setting, we determined the RNA-seq in GFP+/CD19+ BM B cells of MH/NRASG12D leukemic mice (n = 2). GSEA analysis showed that, compared with WT mice (n = 2), MH/NRASG12D B-ALL mice displayed significant upregulation of MYC_TARGETS and downregulation of MATURE_B_LYMPHOCYTE_UP gene categories (supplemental Figure 4D). Conversely, compared with NRASG12D (n = 2), the two-hit mice exhibited increased gene expression of DEACETYLATE_HISTONS (including Hdac1 and Hdac7) and NRAS_SIGNALING_UP, as well as decreased expression of B_LYMPHOCYTE_NETWORK (supplemental Figure 4E). Furthermore, the clonal features of VHJH and VκJκ rearrangements appeared more prominent in BM blasts from MH/NRASG12D mice compared with B-lineage cells of NRASG12D mice (supplemental Figure 4F-G). These results showed that MH and NRASG12D cooperatively drove a severe form of BCP-ALL.
Aberrant chromatin-binding ability of MH via MEF2D-MRE in hematopoietic cell context
To address how MH fusion proteins regulated their target genes differently when compared with WT MEF2D in the hematopoietic system, we expressed flag-tagged MH or flag-tagged MEF2D in CD34+ cells sorted from human cord blood and performed ChIP-seq using anti-Flag antibody. MH fusion displayed an increased ability to bind chromatin compared with MEF2D, as shown by more bound regions (8703 vs 7863) that were detected in the ChIP-seq data (Figure 4A; supplemental Tables 6-7). A de novo motif discovery algorithm implemented in program HOMER36 helped to uncover a consensus recognition sequence of CTATTTA(T)TA in MH and MEF2D target genes, which was termed MRE (Figure 4B). The MH-binding motif identified in CD34 cells was consistent with those observed in MH-overexpressed Reh cells (a cell line of BCP-ALL that is usually used for cellular and molecular studies on ALL35,37,38) by ChIP-seq (supplemental Figure 5A). In addition, ChIP-seq identified 1242 peaks with increased binding but only 83 peaks with reduced binding, assigned to MH fusion compared with MEF2D (Figure 4C). GO analysis showed that genes with increased binding to MH were concentrated in the pathways such as the RNA splicing, regulation of RNA stability, histone modification, transcription coregulator activity, and the adenosine triphosphate metabolic process (supplemental Figure 5B). When the increased binding signals of MH were scrutinized at the individual target gene level, some representative genes emerged, including the HDAC family members (HDAC9, HDAC4, and HDAC7) and TFs essential for B-lineage cell development (RUNX1, BACH2, IKZF1, HNRNPUL1, and VEGFC) (supplemental Figure 5C). Interestingly, when we performed a de novo search for motifs other than MRE using the increased binding peaks in MH-expressing CD34+ cells, several consensus motifs were unveiled that were previously reported in ZFX (zinc-finger protein family) and other known TFs associated with hematopoietic regulation such as MEF2C, RUNX1, MYB, PU.1, and WT1 (supplemental Figure 5D). These results suggested the possibility that MH might form productive regulatory complexes with these TFs to orchestrate B-cell development and leukemogenesis.

ChIP-seq analysis revealed MEF2D-MRE and crystallographic characterization of MEF2D-DNAMRE engagement. (A) Venn diagram illustrating the overlap between DNA regions bound by MH fusion or WT MEF2D, as identified by ChIP-seq analysis with anti-FLAG antibodies in CD34+ cells sorted from human cord blood. (B) MEF2D-MRE sequence. Motif analysis summarized the MEF2 DNA motifs found in the regions bound by MH or WT MEF2D. The ChIP-seq analysis with stable expression of MH fusion helped to uncover a consensus binding site in MH-driven transcriptional deregulation. (C) Density heatmap of MH and MEF2D binding peaks. Heatmap is shown for a region extending from −2 kb to 2 kb relative to the peak summit. Top, peaks with increased binding of MH compared with WT MEF2D. Bottom, peaks with decreased binding of MH compared with WT MEF2D. (D) Side view of the MEF2D2-95-DNAMRE complex. The crystal structure is shown in cartoon representation. The DNA-binding motifs R3/K4/K5 and R15/K23/K31 in the MEF2D are shown in ball and stick representations. The DNA nucleotides TATTTATA (ie, the MRE core) are labeled. The 2 subunits in MEF2D dimer are colored in magenta and cyan, respectively. (E) Vertical view of the MEF2D-DNA engagement. The protein is rendered according to the electrostatic charge in the surface, in which the positive and negative charges are shown in blue and red, respectively. (F) MEF2D tetramer and MRE crosslinking. Four MEF2D subunits are colored in magenta, cyan, yellow, and green, respectively. D63/L67/T70 in the tetrameric interface (boxed) are labeled and shown in stick representation.
ChIP-seq analysis revealed MEF2D-MRE and crystallographic characterization of MEF2D-DNAMRE engagement. (A) Venn diagram illustrating the overlap between DNA regions bound by MH fusion or WT MEF2D, as identified by ChIP-seq analysis with anti-FLAG antibodies in CD34+ cells sorted from human cord blood. (B) MEF2D-MRE sequence. Motif analysis summarized the MEF2 DNA motifs found in the regions bound by MH or WT MEF2D. The ChIP-seq analysis with stable expression of MH fusion helped to uncover a consensus binding site in MH-driven transcriptional deregulation. (C) Density heatmap of MH and MEF2D binding peaks. Heatmap is shown for a region extending from −2 kb to 2 kb relative to the peak summit. Top, peaks with increased binding of MH compared with WT MEF2D. Bottom, peaks with decreased binding of MH compared with WT MEF2D. (D) Side view of the MEF2D2-95-DNAMRE complex. The crystal structure is shown in cartoon representation. The DNA-binding motifs R3/K4/K5 and R15/K23/K31 in the MEF2D are shown in ball and stick representations. The DNA nucleotides TATTTATA (ie, the MRE core) are labeled. The 2 subunits in MEF2D dimer are colored in magenta and cyan, respectively. (E) Vertical view of the MEF2D-DNA engagement. The protein is rendered according to the electrostatic charge in the surface, in which the positive and negative charges are shown in blue and red, respectively. (F) MEF2D tetramer and MRE crosslinking. Four MEF2D subunits are colored in magenta, cyan, yellow, and green, respectively. D63/L67/T70 in the tetrameric interface (boxed) are labeled and shown in stick representation.
Structural characterization of MEF2D N-terminal motifs key to DNA binding
To gain more insight into the MEF2D-MRE interaction, we determined the crystal structure of MEF2D2-95-DNAMRE complex by using X-ray crystallography (Figure 4D; supplemental Table 8). Two molecules of the MEF2D2-95, which contains MEF and MADS-box domains,39-42 intertwined with each other, giving rise to a clamp-shape dimer. The N-terminal R3/K4/K5 loops protruded out from the central core like 2 long arms, engaging the interaction between MEF2D and the minor grooves of the DNA duplex. The MEF2D-MRE recognition was further stabilized by the intermittent insertions of the R15/K23/K31 side chains into the minor/major DNA grooves (Figure 4D; supplemental Figure 5E). In accordance with this finding, the electrostatic surface surrounding R15/K23/K31 was highly positively charged, facilitating the MEF2D-MRE engagement (Figure 4E). Furthermore, the MEF2D2-95 monomer, which could not fold into a complete structure by itself, was stabilized by another adjacent MEF2D2-95 monomer. This led to a symmetrical trans-dimerization, often observed in other MEF2 protein members.43-45 Unexpectedly, the crystal packing reported here revealed the presence of an MEF2D tetramer that might be required for the crosslinking of multiple MREs (Figure 4F). Via coiled-coil interaction mediated mainly by D63/L67/T70, two sets of MEF2D dimers could form a butterfly-like configuration and generate a multi-valence bridge for MRE crosslinking (Figure 4F; supplemental Figure 5F).
MEF2D-MRE interaction was indispensable for MEF2D fusion-driven trans-deregulation and B-cell differentiation arrest
To investigate the biophysical features of the MEF2D2-95-MRE complex, we tested protein–DNA interaction activity using a biolayer interferometry assay. When incubated with MRE DNA, the protein domain displayed tight binding affinity with a binding kinetics value of 1.1 μM (Figure 5A). Some double and triple aa substitutions in the binding interfaces significantly impaired MEF2D-MRE binding (Figure 5A; supplemental Figure 6A). We then investigated whether these structure-based mutants might have a disruptive impact on the aberrant TF activity of full-length MEF2D fusion using HDAC9 promoter or 3 × MEF binding site as a reporter3,5 by a luciferase experiment conducted in 293T cells (Figure 5B; supplemental Figure 6B-C). Indeed, the perturbations in the binding interfaces (ie, MH-R3A/K4A/K5A and MH-R15A/K23A/K31A) completely abrogated the trans-activation function of MH (Figure 5B; supplemental Figure 6B). In addition, mutations targeting the putative tetrameric interface (ie, MH-D63R and MH-D63A/L67A/T70A) also significantly, although to a less extent, reduced the trans-regulatory activity of MH. Using the same experimental conditions, we examined the trans-regulatory activities of MEF2D-BCL9 (MB) and obtained similar results (supplemental Figure 6C). Importantly, as monitored by in vitro B-cell differentiation assay,3 the MEF2D-MRE recognition was essential for aberrant function of MH (Figure 5C). In a control experiment, 69% of primary murine progenitors transfected with vehicle underwent B-cell differentiation in the favorable condition, whereas cells harboring MH displayed much less B-cell differentiation (∼18%). In comparison, MH-R3A/K4A/K5A and MH-R15A/K23A/K31A resumed the B-lineage differentiation back to a similar level as control (65% and 55%). The less recovery in B-cell differentiation (36%) by tetrameric mutant MH-D63A/L67A/T70A suggested a multilevel regulation in MH-driven transcriptional deregulation, in which the direct DNA binding might be the rate-limiting step, preceding oligomerization.

Structure-based analysis revealed molecular determinants of MEF2D-MRE complex formation in determining MEF2D fusion-driven trans-deregulation of target genes and B-cell differentiation arrest. (A) Biophysical characterization of MEF2D-MRE interaction. Various concentrations of recombinant MEF2D2-95 and mutants were subjected to biolayer interferometry characterization. The binding kinetics value was estimated with the assumption of 1:1 binding. (B) Luciferase assays using the HDAC9 promoter in 293T cells. The experiments were performed in the context of MH fusion and MH mutants. (C) In vitro B-cell differentiation assay. Left panel, the structure-based perturbations upon the MH-mediated cell arrest (boxed) were monitored by using mouse progenitor cells (Lin–/c-KitLow). Right panel, statistical summary. (D) Heatmap of genes that were differentially expressed under the effect of MH fusion and MH mutants in Reh cell lines as revealed by RNA-seq (n = 2). GO analysis of 905 MH upregulated (E) and 696 MH downregulated (F) genes in Reh cell lines expressing different MH constructs. *P < .05, **P < .01, ***P < .001. TGF-β, transforming growth factor-β.
Structure-based analysis revealed molecular determinants of MEF2D-MRE complex formation in determining MEF2D fusion-driven trans-deregulation of target genes and B-cell differentiation arrest. (A) Biophysical characterization of MEF2D-MRE interaction. Various concentrations of recombinant MEF2D2-95 and mutants were subjected to biolayer interferometry characterization. The binding kinetics value was estimated with the assumption of 1:1 binding. (B) Luciferase assays using the HDAC9 promoter in 293T cells. The experiments were performed in the context of MH fusion and MH mutants. (C) In vitro B-cell differentiation assay. Left panel, the structure-based perturbations upon the MH-mediated cell arrest (boxed) were monitored by using mouse progenitor cells (Lin–/c-KitLow). Right panel, statistical summary. (D) Heatmap of genes that were differentially expressed under the effect of MH fusion and MH mutants in Reh cell lines as revealed by RNA-seq (n = 2). GO analysis of 905 MH upregulated (E) and 696 MH downregulated (F) genes in Reh cell lines expressing different MH constructs. *P < .05, **P < .01, ***P < .001. TGF-β, transforming growth factor-β.
Based on the structural and functional characterization, we assumed that MRE recognition should be essential to the transforming activities of MEF2D fusions. To pin down the MEF2D fusion target genes with precision in human B-lineage cells, we performed a structure-based RNA-seq mining/cross-validation in Reh cells. The human MH and MH mutants were thus expressed in Reh cells (supplemental Figure 6D), and potential genes under direct regulation of MH were searched via comparison of RNA-seq data of the cell lines established through transfection with vehicle, MH, or various MH mutants (MH-R3A/K4A/K5A, MH-R15A/K23A/K31A, and MH-D63A/L67A/T70A) (n = 2 in each group). The heatmap of the differentially expressed genes (fold change >1.5 and adjusted P value <.05) compared with vehicle indicated that the MH group had a distinct gene expression profile, whereas the transcriptome profiles in mutant groups (MH-R3A/K4A/K5A and MH-R15A/K23A/K31A) were similar to that of the vehicle (Figure 5D). The tetrameric mutant MH-D63A/L67A/T70A also showed partially altered MH-driven trans-deregulation. With this BCP-ALL cell line background, we used the intersection/overlap between the upregulations/downregulations (MH vs vehicle) and downregulations/upregulations (MH mut vs MH) to screen, in a more specific way, the MH target genes (supplemental Figure 6E-F). GO analysis of the 905 activated overlap genes and 696 repressed overlap genes revealed that activated genes were mainly enriched in MAPK signaling pathway, regulation of cell morphogenesis, regulation of GTPase activity, transforming growth factor-β signaling pathway, JNK cascade, and regulation of protein binding (Figure 5E). Genes related to B-cell differentiation, BCR signaling pathway, B-cell activation, regulation of lymphocyte-mediated immunity, regulation of hemopoiesis, blood coagulation, and platelet activation were consistently downregulated (Figure 5F).
Contribution of C-terminal moiety of MH protein to MH mediated trans-regulation and cofactor recruitment
To understand the role that the C-terminus (HNRNPUL1 part) of MH (MH-C) might play in this leukemogenic driver, a series of deletion mutants were constructed (Figure 6A). Domain arrangement of full-length HNRNPUL1 protein and its fusion break point are shown in supplemental Figure 7A. In a luciferase experiment using HDAC9 promoter as reporter in 293T cells (Figure 6B), compared with full-length MH fusion, the complete C-terminal deletion (MH-ΔC) reduced its transactivation activity back to a level similar to that of WT MEF2D. We then checked the transcriptional expression of some of the well-established MH target genes in Reh cells with a RT-PCR experiment evaluating the effect of MH fusion and its C-terminal deletion derivatives (Figure 6C). Consistently, MH-ΔC failed to upregulate HDAC9 or to repress the B-cell development associated genes, including CD79A, CD79B, VPREB3, IL7R, and RAG1, suggesting an important role of HNRNPUL1 moiety in MH function. Among the deletion mutants, the MH-Δ336-384 showed partially altered MH-driven trans-deregulation, suggesting that this part of HNRNPUL1, which directly fused to MEF2D, might be more important. To address whether MH-C could modulate MH partner protein recruitment, we expressed flag-tagged–MEF2D, –MH, and –MH-C in 293T cells, followed by mass spectrometry (MS) analysis using anti-flag antibody. A Venn diagram suggested that most of the MEF2D-interacting proteins were also recognized by MH, reiterating a shared pattern between WT MEF2D and fusion counterpart (Figure 6D). More than 500 interacting partners were commonly observed in WT MEF2D, MH, and MH-C. Based on this finding, it was reasonable to envisage a cooperative mode between N- and C-terminal portions in MH upon cofactor recruitment. Conversely, the GO analysis showed that unique interacting proteins of MH compared with MEF2D were enriched in the pathways, including ribonucleoprotein complex biogenesis, RNA splicing, HDAC complex, signal transduction by p53 class mediator, regulation of cell growth, regulation of gene expression, and epigenetic regulation (Figure 6E).
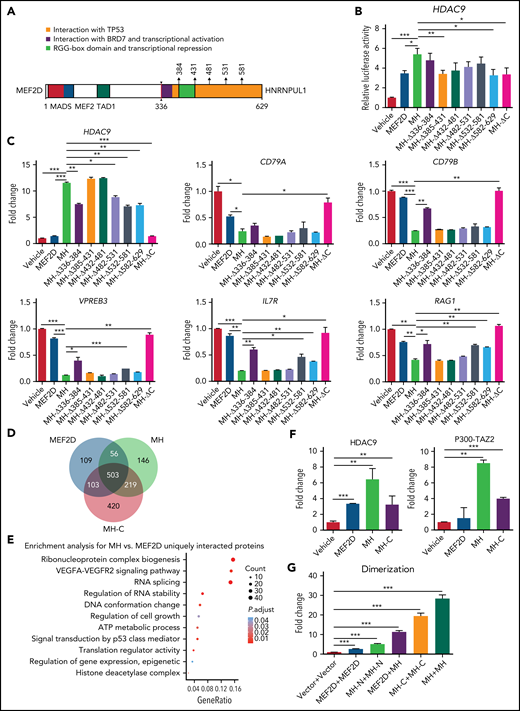
The regulatory role of the C-terminal moiety of MH fusion. (A) Schematic diagram of the construction of deletional mutations in the C-terminal MEF2D-HNRNPUL1. The amino acid positions used in this assay are arrowed and annotated. (B) Luciferase assay of MH fusion and its mutants using the HDAC9 promoter. (C) Quantitative RT-PCR of the messenger RNA levels of representative target genes in Reh cells expressing MH or its mutants. (D) Venn diagram indicating the overlap proteins that interacted with MEF2D, MH, and MH-C protein in an MS assay. (E) GO analysis of proteins with unique interaction to MH vs MEF2D in an MS assay. (F) Mammalian two-hybridization assay showing the interaction of MEF2D, MH, and MH-C with HDAC9 and P300-TAZ2 domain in 293T cells. (G) Mammalian two-hybridization assay showing the dimerization of MEF2D, MH-N, MH-C, and MH in 293T cells. Data are presented as mean ± standard error of the mean and are analyzed by using the t test. *P < .05, **P < .01, ***P < .001. VEGFA-VEGFR2, vascular endothelial growth factor A/vascular endothelial growth factor receptor-2.
The regulatory role of the C-terminal moiety of MH fusion. (A) Schematic diagram of the construction of deletional mutations in the C-terminal MEF2D-HNRNPUL1. The amino acid positions used in this assay are arrowed and annotated. (B) Luciferase assay of MH fusion and its mutants using the HDAC9 promoter. (C) Quantitative RT-PCR of the messenger RNA levels of representative target genes in Reh cells expressing MH or its mutants. (D) Venn diagram indicating the overlap proteins that interacted with MEF2D, MH, and MH-C protein in an MS assay. (E) GO analysis of proteins with unique interaction to MH vs MEF2D in an MS assay. (F) Mammalian two-hybridization assay showing the interaction of MEF2D, MH, and MH-C with HDAC9 and P300-TAZ2 domain in 293T cells. (G) Mammalian two-hybridization assay showing the dimerization of MEF2D, MH-N, MH-C, and MH in 293T cells. Data are presented as mean ± standard error of the mean and are analyzed by using the t test. *P < .05, **P < .01, ***P < .001. VEGFA-VEGFR2, vascular endothelial growth factor A/vascular endothelial growth factor receptor-2.
In agreement with the aforementioned findings, when MH-C alone was subjected to MS analysis, the MH-C interacting proteins were clustered in the pathways of ribonucleoprotein complex biogenesis, RNA splicing, regulation of RNA binding, regulation of gene expression, epigenetic, transcriptional regulation by TP53, protein tetramerization, and DNA repair complex (supplemental Figure 7B). The additional protein interaction with MH-C might be the structural foundation upon which MH displayed enhanced trans-regulatory activity compared with WT MEF2D (Figure 6D-E). We also tested this idea in the context of HDAC9 and P300, both being known to bind directly to MEF2 family members.46,47 As monitored by a mammalian two-hybridization assay in 293T cells, MH-C could bind to HDAC9 and P300-TAZ2 (Figure 6F), which might allow MH to display a stronger binding preference to both partners over the WT MEF2D. Furthermore, both WT MEF2D and the N-terminal portion of MH could form homodimers, whereas WT MEF2D could heterodimerize with MH, and MH-C showed a strong ability to form homodimers. In the presence of MH-C, MH tended more to form homodimers than WT MEF2D (Figure 6G), a critical intramolecular interaction that might enable MH to function as an aberrant TF and might further facilitate the formation of tetramers. These results provided evidence that the C-terminal moiety of MH protein might contribute to overall cofactor recruitment and trans-regulatory activity.
Targeted therapy of HDACi panobinostat with VCR + DEX improved survival of MH/NRASG12D BCP-ALL mice
The establishment of in vivo MH/NRASG12D murine BCP-ALL lines allowed us to explore targeted therapy against aberrant MEF2D fusion-driven transactivation. Because MEF2D fusion could significantly activate Hdac9 and Hdac1 in our MH knock-in mice and patients with BCP-ALL,3,5,7 an investigation of HDACis in MH/NRASG12D leukemic mice could be a trial of choice. We therefore tested the efficacy of the broad-spectrum HDACi panobinostat and 2 conventional chemotherapeutic agents, VCR and DEX, in the tertiary transplantation MH/NRASG12D mice. These mice were subjected to 4 treatment protocols: solvent (as control), 2.5 mg/kg panobinostat, 0.15 mg/kg VCR plus 1 mg/kg DEX, and the combination of panobinostat with VCR + DEX. After 2 cycles of drug administration, both panobinostat and VCR + DEX decreased the percentage of GFP+ cells in PB compared with the control group. However, the combination of panobinostat with VCR + DEX induced a much more significant reduction in PB GFP+ cell numbers (Figure 7A). FACS analysis of BM cells showed the similar tendencies of reduction of GFP+ B-lymphoblasts under the 3 treatment protocols, with the triad combination therapy achieving the most significant efficacy (Figure 7B). In marked contrast to the control, the panobinostat and VCR + DEX combination significantly alleviated the splenomegaly and hepatomegaly in MH/NRASG12D mice (Figure 7C; supplemental Figure 8A). This was also confirmed by hematoxylin and eosin staining of spleen and liver pathologic sections, with significantly reduced leukemia cell infiltration upon triad drug treatment (Figure 7D; supplemental Figure 8B). When survival curves were analyzed, panobinostat alone could not prolong the life span of leukemic mice, whereas VCR + DEX showed a significant but moderate improvement in survival compared with the control. Panobinostat in combination with VCR + DEX, however, was proven to be a relatively successful protocol that produced significantly longer survival compared with either panobinostat alone or with VCR + DEX (Figure 7E).
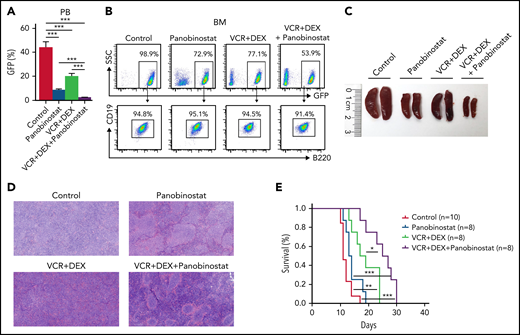
The combination treatment of panobinostat, VCR, and DEX significantly improved the overall survival of MH/NRASG12D BCP-ALL mice. (A) Percentage of GFP-positive cells in PB from MH/NRASG12D recipient mice treated with solvent (as control), panobinostat (2.5 mg/kg), VCR (0.15 mg/kg) plus DEX (1 mg/kg), and the combination of the 3 drugs, respectively, for 2 weeks of 5-days-on/2-days-off. (B) Flow cytometry analysis of BM cells from mice as described in panel A. (C) Spleen sizes from mice as described in panel A. (D) Hematoxylin and eosin–stained sections of the spleen described in panel C. (E) Kaplan-Meier survival curves of MH/NRASG12D recipient mice continuously administered solvent (as control), 2.5 mg/kg panobinostat, 0.15 mg/kg VCR and 1 mg/kg DEX, and the combination of panobinostat (2.5 mg/kg) and VCR (0.15 mg/kg) plus DEX (1 mg/kg), intraperitoneally for 4 cycles of 5-days-on/2-days-off. *P < .05, **P < .01, ***P < .001.
The combination treatment of panobinostat, VCR, and DEX significantly improved the overall survival of MH/NRASG12D BCP-ALL mice. (A) Percentage of GFP-positive cells in PB from MH/NRASG12D recipient mice treated with solvent (as control), panobinostat (2.5 mg/kg), VCR (0.15 mg/kg) plus DEX (1 mg/kg), and the combination of the 3 drugs, respectively, for 2 weeks of 5-days-on/2-days-off. (B) Flow cytometry analysis of BM cells from mice as described in panel A. (C) Spleen sizes from mice as described in panel A. (D) Hematoxylin and eosin–stained sections of the spleen described in panel C. (E) Kaplan-Meier survival curves of MH/NRASG12D recipient mice continuously administered solvent (as control), 2.5 mg/kg panobinostat, 0.15 mg/kg VCR and 1 mg/kg DEX, and the combination of panobinostat (2.5 mg/kg) and VCR (0.15 mg/kg) plus DEX (1 mg/kg), intraperitoneally for 4 cycles of 5-days-on/2-days-off. *P < .05, **P < .01, ***P < .001.
Discussion
MEF2D fusions were leukemogenic drivers
It is well recognized that chromosomal rearrangements and resultant chimeric genes or gene overexpression are drivers in leukemogenesis.48 The recent efforts using next-generation sequencing technologies in BCP-ALL have uncovered several new fusion genes, including the recurrent MEF2D fusions. In the present work, we conducted a multidimensional investigation of the MEF2D fusion-mediated pathogenesis using MH knock-in mice (MH-Mx1 and MH-Vav). Characterizations of phenotype changes revealed a disease progression trajectory from B-cell development blockage at a young age, to a pre-leukemia status at 10 to 12 months. RNA-seq analysis of the abnormal BCPs in BM and immature B cells infiltrating spleen at distinct disease stages allowed us to identify genes/pathways involved in the differentiation arrest, increased proliferation, and aberrant extramedullary infiltrating ability of the corresponding cell populations. Particularly, a number of pathways deregulated by MH fusion were found overlapped with Ras signal transduction, suggestive of intertwining of MH- and Ras-driven oncogenesis. The role of MH fusions should thus be placed in a stepwise disease mechanism framework, since MH/NRASG12D double genetic defects were required to induce acute leukemia. Our work has thus provided another two-hit model involving abnormal TFs and signaling molecules for a better understanding of leukemogenesis.48-50
Features of MEF2D-MRE recognition through structural biology analysis
Now that RNA-seq analysis of MH mice delineated the deregulation of gene expression profiles at various B-cell differentiation stages, we hypothesized that MEF2D fusions should function as abnormal TFs. Previous studies proposed that in MEF2A-D proteins, the N-terminal MEF and MADS-box domains are responsible for the recognition of the A/T-rich DNA motifs and the recruitment of transcription cofactors, including HDAC9.51 To understand precisely the trans-regulatory properties by MEF2D fusion, we have characterized the MEF2D-DNA engagement in atomic detail. As suggested by ChIP-seq analysis using CD34 cells, MH fusion preferred to bind a DNA sequence containing 5′-CTATTTA(T)TA-3′ signature MRE. This was confirmed by X-ray crystallographic characterization, in which the DNA binding was mainly mediated by 2 sets of RKK motifs in MEF2D. Our data showed that perturbations of MEF2D-DNA interfaces could impair DNA binding ability, resulting in aberrant MH-driven trans-regulation and B-cell differentiation arrest. As highlighted in our recent review,52 oligomerization of some key TFs seems to be an important regulator in carcinogenesis and targeted therapy. Oligomerization of chimeric TFs derived from chromosomal translocations not only enhances the nascent TF-DNA recognition but also helps to gain extra binding sites and functions beyond the WT counterparts. Here, we also observed an unexpected tetramerization of MEF2D2-95 upon MRE recognition. In addition to the homo-dimerization frequently observed in other MEF2 family proteins,41,53 MEF2D2-95 appeared to go a step further to give rise to a remarkable butterfly-shape configuration, in which the DNA-binding motifs (ie, R3/K4/K5 and R15/K23/K31) were located symmetrically on the sides of the MEF2D tetramer. This architecture seems to be important for the crosslinking of multiple MRE sites. In support of this, as monitored by luciferase assay and RNA-seq analysis, the putative tetrameric mutation D63R and D63A/L67A/T70A disrupted the trans-regulatory activity of MH and MB fusions (Figure 5B-D; supplemental Figure 6B-C). Our data may also provide clues to future drug design either against the MEF2D-MRE engagement or interfering with the tetramer formation of MEF2D fusion proteins.
Identification of MH target genes and evaluation of their potential therapeutic relevance
In this work, we were able to identify a large number of genes directly regulated by MH. Among these MEF2D fusion target genes, the most notable could be HDAC family members from both a biological and clinical perspective. It has been well established that MEF2 TFs bind the promoter region of HDAC9 gene and trans-activate its expression. Conversely, HDAC9 forms a complex with MEF2 TFs and exerts a function of corepressor on the transcription of its own coding gene, constituting thus a negative self-feedback regulatory loop.51 Several studies reported enhanced transcription of HDAC9 and HDAC1 genes in BCP-ALL with MEF2D fusions,3,5,7 a phenomenon recapitulated in our MH knock-in mice B-lineage cells. Here, we have shown a stronger binding ability of MH to HDAC9 promoter than WT MEF2D. Furthermore, MH exhibits much increased interaction not only with HDAC9 but also the co-activator P300 protein compared with WT MEF2D. The MS and mammalian two-hybridization assays suggested that the enhanced recruitment function might stem from the HNRNPUL1 fusion. Further investigations of MH-C showed that the C-terminal portion of the fusion could form homodimer, implicative of a promotive role for MH dimerization. In agreement with this finding, deletion of the C-terminal moiety in the oncogenic fusion abrogated MH-mediated transcription in the luciferase assay.
However, due to the lack of in vivo characterization, the current understanding of the C-terminal partner in leukemogenesis is rather preliminary. In future study, more vigorous investigations are required to understand the exact role of MH-C in disease development. Based on current data, it is not clear how HDAC9-MH-P300 might interact with each other, giving rise to the aberrant trans-deregulation observed in mice and patients. It is worth noting that in some settings of leukemia-associated TFs, such as PML-RARA in acute promyelocytic leukemia, the enhanced recruitment of cofactors such as P300 and others might drive the abnormal transcriptional expression of target genes.54 In a previous study, in vitro drug sensitivity assays using xenografted human leukemic cells showed that MEF2D-fusion might be sensitive to the HDACi panobinostat.5 Moreover, two HDACis, vorinostat and quisinostat, also displayed an inhibitory effect upon the primary cultured leukemic cells obtained from the MEF2D-BCL9 patient.6 Of note, both of these experiments were performed in vitro by using leukemia cell cultures but not in an animal model. In this study, we took advantage of the available animal model (ie, MH/NRASG12D BCP-ALL mice) to question whether an HDACi might be used to treat acute leukemia in vivo. In fact, panobinostat alone had a limited effect on leukemic cell proliferation in PB and BM and could not prolong the life span of the MH/NRASG12D BCP-ALL mice. However, when this HDACi was used together with chemotherapy agents, it significantly potentiated the effect of VCR + DEX, particularly in improving the survival of diseased animals. In the future, our mouse model can be used for screening drugs, either blocking protein products of key target genes of MEF2D fusions or disrupting MEF2D fusions/MRE complex, in an attempt to improve this BCP-ALL subtype with poor clinical outcome.
Acknowledgments
The authors thank Na Li and other personnel in beamlines BL17U/18U1/19U1 (Shanghai Synchrotron Radiation Facility/National Facility for Protein Science in Shanghai) for help during data collection, and the Center for High Performance Computing at Shanghai JiaoTong University for providing computing resources. They also thank Children’s Oncology Group TARGET, St. Jude Children’s Research Hospital, the Lund University Hospital, the Singapore and Malaysia MaSpore cohort, and JALSG (Japan Adult Leukemia Study Group) for providing the RNA-seq data.
This work was supported by research grants 81970132, 81770142, 81800140, and 81861148030 from the National Natural Science Foundation of China, the Shanghai Shenkang Hospital Development Center (SHDC2020CR5002), Shanghai Science and Technology Committee (20JC1410600), Innovative Research Team of High-Level Local Universities in Shanghai, Shanghai Collaborative Innovation Program on Regenerative Medicine and Stem Cell Research (2019CXJQ01), Shanghai Municipal Education Commission–Gaofeng Clinical Medicine Grant Support (20152504), the Innovation Foundation for Doctoral Students of Shanghai JiaoTong University School of Medicine (BXJ201815), and the Samuel Waxman Cancer Research Foundation.
Authorship
Contribution: G.M., Z.C., and S.-J.C. conceived and designed the experiments; J.H. coordinated and oversaw the bioinformatics data analysis; M.Z., H.Z., Z.L., Q.W., N.C., W.Z., D.M., L.B., Q.X., M.J., J.L., and Z.M.C. performed the experiments; M.Z., H.Z., Q.W., N.C., J.L., J.H., W.Z., D.M., L.B., Q.X., M.J., Z.L., Z.C., S.-J.C., and G.M. analyzed the data; M.Z., H.Z., N.C., D.M., J.H., and G.M. prepared the figures and manuscript; and G.M., Z.C., and S.-J.C. were responsible for project supervision and wrote the paper.
Conflict-of-interest disclosure: The authors declare no competing financial interests.
Correspondence: Guoyu Meng, Zhu Chen, and Sai-Juan Chen, State Key Laboratory of Medical Genomics, Shanghai Institute of Hematology, Rui Jin Hospital, Shanghai JiaoTong University School of Medicine, 197 Rui Jin Er Rd, Shanghai 200025, China; e-mails: guoyumeng@shsmu.edu.cn; zchen@stn.sh.cn; and sjchen@stn.sh.cn.
The RNA-seq data set and clinical information for the Children’s Oncology Group TARGET ALL project used in this work are available in the database of Genotypes and Phenotypes (accession number phs000218.v20.p7) and the European Genome Phenome archive (accession numbers EGAS00001000654 and EGAS00001001952).
The online version of this article contains a data supplement.

This feature is available to Subscribers Only
Sign In or Create an Account Close Modal