

Key Points
Patients with the neurological lysosomal storage disorder NP-CI have severely impaired CTL killing.

Abstract
Niemann-Pick disease type C1 (NP-C1) is a rare lysosomal storage disorder resulting from mutations in an endolysosomal cholesterol transporter, NPC1. Despite typically presenting with pronounced neurological manifestations, NP-C1 also resembles long-term congenital immunodeficiencies that arise from impairment of cytotoxic T lymphocyte (CTL) effector function. CTLs kill their targets through exocytosis of the contents of lysosome-like secretory cytotoxic granules (CGs) that store and ultimately release the essential pore-forming protein perforin and proapoptotic serine proteases, granzymes, into the synapse formed between the CTL and target cell. We discovered that NPC1 deficiency increases CG lipid burden, impairs autophagic flux through stalled trafficking of the transcription factor EB (TFEB), and dramatically reduces CTL cytotoxicity. Using a variety of immunological and cell biological techniques, we found that the cytotoxic defect arises specifically from impaired perforin pore formation. We demonstrated defects of CTL function of varying severity in patients with NP-C1, with the greatest losses of function associated with the most florid and/or earliest disease presentations. Remarkably, perforin function and CTL cytotoxicity were restored in vitro by promoting lipid clearance with therapeutic 2-hydroxypropyl-β-cyclodextrin; however, restoration of autophagy through TFEB overexpression was ineffective. Overall, our study revealed that NPC1 deficiency has a deleterious impact on CTL (but not natural killer cell) cytotoxicity that, in the long term, may predispose patients with NP-C1 to atypical infections and impaired immune surveillance more generally.
Introduction
The ubiquitously expressed endolysosomal protein Niemann-Pick C1 (NPC1) is a key mediator of low-density lipoprotein–derived cholesterol transport from the lysosome lumen to other cellular compartments.1,2 Biallelic deleterious mutations in NPC1 lead to the progressive fatal neurodegenerative disorder Niemann-Pick disease type C1 (NP-C1), in which unesterified cholesterol and sphingolipids accumulate in lysosomes and late endosomes, dysregulating lipid homoeostasis and adversely affecting many cell lineages.3 The most common and prominent disease features are neurological and may include ataxia, dystonia, vertical supranuclear gaze palsy, cognitive regression, and neuropsychiatric illness, with hepatosplenomegaly being the predominant visceral manifestation.4 The clinical severity of NP-C1 varies considerably, with some patients developing fatal systemic disease early in life and others (with milder manifestations) diagnosed in adolescence or even adulthood.5 Progress has recently been made in understanding the molecular impact of a handful of common mutations and their associations with disease phenotype, but the full spectrum of genotype-phenotype correlations for most of the reported mutations is unknown.6,7
Molecular and cellular studies of NPC1 deficiency have shown that the progressively increased lipid burden in the endolysosomes both affects the performance of this compartment and impairs autophagy8 as the cells accumulate autophagic vesicles.9-11 Despite the critical role that lysosomes and autolysosomes play in many immune functions, few studies have investigated the effect of NPC1 deficiency on immune cells,12-15 and no attention has been paid to CD8+ cytotoxic T lymphocytes (CTLs). These cells are a key component of adaptive immunity; they recognize and eliminate virus-infected or neoplastic cells16 through the cytotoxic granule (CG) exocytosis cell death pathway. The complete congenital loss of CTL cytotoxicity as a result of any of several gene mutations is almost invariably fatal in infancy, whereas partial loss of function is strongly associated with immune-mediated disorders later in life, many of which can be cryptic and difficult to diagnose.17 Intriguingly, these forms of CTL deficiency may present with unexplained hepatosplenomegaly or, less commonly, interstitial inflammatory lung disease.18
CGs are specialized acidic lysosome-like vesicles necessary for storage of a cocktail of essential cytotoxic effector molecules, proapoptotic serine proteases (granzymes [Gzms]), and the pore-forming protein perforin (Prf).19 Target-cell engagement triggers cytoskeletal rearrangements in the CTL that drive both the directional trafficking of CGs toward the immunological synapse (polarization) and their fusion with the plasma membrane, which enables the release of their cytotoxic cargo into the synaptic cleft. Once secreted, Prf binds to the target-cell membrane, then inserts itself and oligomerizes into large transmembrane pores,20-22 through which Gzms diffuse into the target-cell cytosol,21 where they initiate a variety of hierarchically arranged cell death pathways.23
Given that the CG-dependent secretory pathway is essential for CTL function, we posed a key question: does the disturbed lipid homoeostasis caused by NPC1 deficiency adversely affect CTL function by disrupting endolysosomal structure and function? By investigating primary T cells from patients with NP-C1 and transgenic Npc1−/− mice, we discovered that NPC1 deficiency dramatically impairs CTL-mediated cytotoxicity. Surprisingly, this was caused by lipid accumulation in CGs, which impaired the ability of Prf to disrupt the target-cell membrane, rather than by stalled autophagy. Our findings identify a previously unrecognized T-cell immune insufficiency in patients with NP-C1 and raise the possibility that other inborn errors of lysosomal lipid storage/trafficking may affect CTL function via a similar mechanism.
Methods
Mouse models
BL/6 and BL/6.OTI and BALB/c-Npc1m1N (Npc1−/−)24 mice were crossed with BALB/c mice, which are transgenic for a T-cell receptor specific to an epitope of hemagglutinin IYSTVASSL (BALB/c.CL4), resulting in Npc1−/−.CL4. Antigen-specific CD8+ T cells were generated using a standard protocol as previously described.25 Gene knockout (KO) using CRISPR/Cas9 was carried out as previously described.26 Proteins were overexpressed in primary mouse CTLs as previously described.20
CAR T cells
Human chimeric antigen receptor (CAR) T cells expressing human epidermal growth factor receptor 2 (HER2) CAR were generated from freshly isolated peripheral blood mononuclear cells as previously described.27
CTL/natural killer cell functional assays
Standard 4-hour chromium-51 release cytotoxicity and degranulation assays were conducted as previously described.27
Microscopy
The cells were imaged with a Nikon C2 confocal microscope equipped with 405-/488-/561-/640-nm laser diodes or a Zeiss Elyra PS.1 microscope. All images were processed using Fiji-ImageJ or Imaris 9.6 software. Volocity 3D Image Analysis software was used to calculate protein and lipid colocalization.28 Time-lapse microscopy was conducted as previously described.21 For transmission electron microscopy (TEM), cells were imaged with a JEOL 1400 Flash electron microscope and quantified with Fiji-ImageJ.29 Detailed settings and analyses are described in the data supplement.
Ethics
Studies were approved by the Peter MacCallum Cancer Centre Animal Ethics (#E655) and Human Ethics Committees (#01/14), Royal Children’s Hospital Human Ethics Committee (#33146A), and Royal Melbourne Hospital Human Ethics Committee (#2020.345).
Statistical analysis
Statistical analysis was carried out in Prism-8.1.1. For 2 groups, statistical significance was assessed using an unpaired t test or, in the absence of Gaussian distribution, Mann-Whitney U test. For >2 groups, we used 1-way analysis of variance with post hoc Bonferroni correction or, in the absence of Gaussian distribution, a Kruskal-Wallis test. *P < .05, **P < .01, ***P < .001, and ****P < .0001. Data are shown as mean ± standard deviation unless stated otherwise. Detailed methodology is provided in the data supplement.
Results
Npc1-deficient CTLs have reduced cytotoxicity but exhibit normal degranulation
To study the effect of Npc1 deficiency on CTL cytotoxicity, we used BALB/c-Npc1m1NJ mice that were also transgenic for a T-cell receptor (CL4) that recognizes the hemagglutinin peptide antigen IYSTVASSL30 presented on syngeneic (H-2d) major histocompatibility complex class I (Npc1−/−.CL4; supplemental Figure 1A). To assess the cytotoxicity of Npc1−/−.CL4 CTLs, we measured the death of (H-2d) CT-26 peptide-pulsed target cells in a 4-hour chromium-51 release assay. Approximately 10 times as many Npc1−/−.CL4 as Npc1+/+.CL4 CTLs were required to kill an equivalent number of target cells, indicating that the cytotoxicity of Npc1−/−.CL4 CTLs was reduced by >85% (Figure 1A). This was intrinsic to Npc1−/− CTLs (supplemental Figure 1B-D), which were indistinguishable from wild-type (WT) Npc1+/+.CL4 CTLs with respect to their proliferation and activation in response to antigen (supplemental Figure 1E-G). To validate these findings in a different mouse strain, we used CRISPR-Cas9 to disrupt (ie, knock out) Npc1 in primary BL/6.OTI CD8+ T cells (supplemental Figure 2A) and again observed >90% reduction in the killing of SIINFEKL-loaded EL-4 (H-2Kb) target cells by the Npc1-KO CTLs (Figure 1B; supplemental Figure 2B). Together, these results demonstrate that the loss of Npc1 has a direct and markedly negative impact on CTL cytotoxicity.
![Murine Npc1−/−.CL4 CTLs have reduced cytotoxic activity. (A) Chromium-51 (51Cr) release assay at the effector-to-target (E:T) ratios indicated shows >85% reduction in Npc1−/−.CL4 cytotoxic activity compared with Npc1+/+.CL4 CTLs, because equal killing efficiency was observed at 5:1 and 0.75:1 E:T ratios, respectively (shown with a dotted line). Values plotted are standardized to maximal killing observed in Npc1+/+.CL4 at 10:1 E:T ratio and set at 100% (average cytotoxicity at 10:1 E:T ratio was 54% ± 13% [mean ± standard deviation of n = 5 independent experiments]). Each value shown represents mean ± standard error of the mean (SEM; n = 5). (B) Npc1 gene was knocked out in primary CTLs by CRISPR/Cas9 (supplemental Figure 2A) 51Cr release assay using day-6 activated CTLs transfected on day 0 with nontargeting guide RNA (NT) and Npc1-targeting guide RNA (Npc1 KO), and target EL-4 cells at the E:T ratios indicated shows decreased cytotoxic activity of Npc1-KO cells. Values plotted are standardized to maximal killing observed in NT at 10:1 E:T ratio and set at 100% (average cytotoxicity at 10:1 E:T ratio was 82.6% ± 21.7% [mean ± SEM of n = 3 independent experiments]). (C) Confocal immunofluorescence microscopy shows colocalization of GzmB (green) and LAMP-1 (magenta). GzmB/Lamp1 colocalization (n = 3 biological replicates per genotype; right), mean biological replicates (inset), and number of CGs estimated by computational 3-dimensional re-creation (Imaris vesicles) based on GzmB staining. (D) Degranulation assay was conducted by coincubating CD8+ T cells with CT-26 targets in the presence or absence of the cognate antigenic peptide. CD8+ T-cell degranulation was assessed by measurement of LAMP-1 (CD107a) externalization on CD8+ T cells. Summary of degranulation assays using n = 5 Npc1+/+ and n = 9 Npc1−/− mice. (E) Total internal reflection fluorescence (TIRF) microscopy reveals that day-4 Npc1−/− CTLs release more GzmB than Npc1+/+ cells, when added to anti-CD3/CD28–coated coverslips. GzmB (blue) was detected by anti-GzmB Alexa 647; both cell types were sorted to achieve the same levels of expression of LifeAct mScarlet (red). Shown in each frame (separated by a white line) are 4 tiled images obtained at that time point. Scale bar, 10 μm. Full time course is shown in supplemental Figure 3 and in supplemental Movies 1 and 2. Detailed description of microscopy and analysis is provided in the data supplement. **P < .01. DAPI, 4′,6-diamidino-2-phenylindole; ns, not significant.](https://ash.silverchair-cdn.com/ash/content_public/journal/blood/139/12/10.1182_blood.2021013477/3/m_bloodbld2021013477f1.png?Expires=1765900007&Signature=3D0t-tia8oLhYu6XHndss81fyyGvXbb-~7AAgrRIJI6MEsupeelEwswwIQB-sqHf8fgrAFvXwYVdPN3mb61p7cH~EiV6FQK~zBseHL0R78H5QB9fc5OSNhMJ~Dk0gBSzAN9FQptIjtcEx~h2536ABSD3OyI59ZmphpMcYiuYwf56NA3Ksfb5O60lxveNxnVBP5lKIpYYvzGUL2dPMjbpGhsgkhAl2yaL20TyG5BgevPMC75sBBcxB5rh2YL4nzszNQV1oJMDV2uqEK7SguWClhzyCzSGL0r1HTrBogQC6xRT3T7ur1myPrzbeOHeMTK~ckS03GkV6LFdFq0651FxWQ__&Key-Pair-Id=APKAIE5G5CRDK6RD3PGA)
Murine Npc1−/−.CL4 CTLs have reduced cytotoxic activity. (A) Chromium-51 (51Cr) release assay at the effector-to-target (E:T) ratios indicated shows >85% reduction in Npc1−/−.CL4 cytotoxic activity compared with Npc1+/+.CL4 CTLs, because equal killing efficiency was observed at 5:1 and 0.75:1 E:T ratios, respectively (shown with a dotted line). Values plotted are standardized to maximal killing observed in Npc1+/+.CL4 at 10:1 E:T ratio and set at 100% (average cytotoxicity at 10:1 E:T ratio was 54% ± 13% [mean ± standard deviation of n = 5 independent experiments]). Each value shown represents mean ± standard error of the mean (SEM; n = 5). (B) Npc1 gene was knocked out in primary CTLs by CRISPR/Cas9 (supplemental Figure 2A) 51Cr release assay using day-6 activated CTLs transfected on day 0 with nontargeting guide RNA (NT) and Npc1-targeting guide RNA (Npc1 KO), and target EL-4 cells at the E:T ratios indicated shows decreased cytotoxic activity of Npc1-KO cells. Values plotted are standardized to maximal killing observed in NT at 10:1 E:T ratio and set at 100% (average cytotoxicity at 10:1 E:T ratio was 82.6% ± 21.7% [mean ± SEM of n = 3 independent experiments]). (C) Confocal immunofluorescence microscopy shows colocalization of GzmB (green) and LAMP-1 (magenta). GzmB/Lamp1 colocalization (n = 3 biological replicates per genotype; right), mean biological replicates (inset), and number of CGs estimated by computational 3-dimensional re-creation (Imaris vesicles) based on GzmB staining. (D) Degranulation assay was conducted by coincubating CD8+ T cells with CT-26 targets in the presence or absence of the cognate antigenic peptide. CD8+ T-cell degranulation was assessed by measurement of LAMP-1 (CD107a) externalization on CD8+ T cells. Summary of degranulation assays using n = 5 Npc1+/+ and n = 9 Npc1−/− mice. (E) Total internal reflection fluorescence (TIRF) microscopy reveals that day-4 Npc1−/− CTLs release more GzmB than Npc1+/+ cells, when added to anti-CD3/CD28–coated coverslips. GzmB (blue) was detected by anti-GzmB Alexa 647; both cell types were sorted to achieve the same levels of expression of LifeAct mScarlet (red). Shown in each frame (separated by a white line) are 4 tiled images obtained at that time point. Scale bar, 10 μm. Full time course is shown in supplemental Figure 3 and in supplemental Movies 1 and 2. Detailed description of microscopy and analysis is provided in the data supplement. **P < .01. DAPI, 4′,6-diamidino-2-phenylindole; ns, not significant.
Murine Npc1−/−.CL4 CTLs have reduced cytotoxic activity. (A) Chromium-51 (51Cr) release assay at the effector-to-target (E:T) ratios indicated shows >85% reduction in Npc1−/−.CL4 cytotoxic activity compared with Npc1+/+.CL4 CTLs, because equal killing efficiency was observed at 5:1 and 0.75:1 E:T ratios, respectively (shown with a dotted line). Values plotted are standardized to maximal killing observed in Npc1+/+.CL4 at 10:1 E:T ratio and set at 100% (average cytotoxicity at 10:1 E:T ratio was 54% ± 13% [mean ± standard deviation of n = 5 independent experiments]). Each value shown represents mean ± standard error of the mean (SEM; n = 5). (B) Npc1 gene was knocked out in primary CTLs by CRISPR/Cas9 (supplemental Figure 2A) 51Cr release assay using day-6 activated CTLs transfected on day 0 with nontargeting guide RNA (NT) and Npc1-targeting guide RNA (Npc1 KO), and target EL-4 cells at the E:T ratios indicated shows decreased cytotoxic activity of Npc1-KO cells. Values plotted are standardized to maximal killing observed in NT at 10:1 E:T ratio and set at 100% (average cytotoxicity at 10:1 E:T ratio was 82.6% ± 21.7% [mean ± SEM of n = 3 independent experiments]). (C) Confocal immunofluorescence microscopy shows colocalization of GzmB (green) and LAMP-1 (magenta). GzmB/Lamp1 colocalization (n = 3 biological replicates per genotype; right), mean biological replicates (inset), and number of CGs estimated by computational 3-dimensional re-creation (Imaris vesicles) based on GzmB staining. (D) Degranulation assay was conducted by coincubating CD8+ T cells with CT-26 targets in the presence or absence of the cognate antigenic peptide. CD8+ T-cell degranulation was assessed by measurement of LAMP-1 (CD107a) externalization on CD8+ T cells. Summary of degranulation assays using n = 5 Npc1+/+ and n = 9 Npc1−/− mice. (E) Total internal reflection fluorescence (TIRF) microscopy reveals that day-4 Npc1−/− CTLs release more GzmB than Npc1+/+ cells, when added to anti-CD3/CD28–coated coverslips. GzmB (blue) was detected by anti-GzmB Alexa 647; both cell types were sorted to achieve the same levels of expression of LifeAct mScarlet (red). Shown in each frame (separated by a white line) are 4 tiled images obtained at that time point. Scale bar, 10 μm. Full time course is shown in supplemental Figure 3 and in supplemental Movies 1 and 2. Detailed description of microscopy and analysis is provided in the data supplement. **P < .01. DAPI, 4′,6-diamidino-2-phenylindole; ns, not significant.
Reduced cytotoxicity was not due to deficient expression or storage of cytotoxic effector proteins Prf and GzmB, which were expressed at the same or higher level, respectively, in Npc1−/−.CL4 CTLs compared with Npc1+/+.CL4 cells (supplemental Figure 2C-D), and both proteins were colocalized in the same LAMP-1+ vesicular compartment (Figure 1C; supplemental Figure 2E). Next, we assessed the ability of Npc1−/−.CL4 CTLs to undergo CG exocytosis after cognate target-cell recognition. Unexpectedly, Npc1−/−.CL4 cells displayed significantly higher cell surface LAMP-1 levels (a marker of CTL degranulation) than Npc1+/+.CL4 CTLs after coincubation with cognate target cells (Figure 1D); this was probably in part due to higher LAMP-1 expression in Npc1−/− CTLs than in WT cells (supplemental Figure 2F). The loss of Npc1 also had no effect on the microtubule-organizing center or CG polarization toward the immune synapse (supplemental Figure 2G). Finally, Npc1-deficient CTLs were capable of secreting their CG content into the synapse; by using live-cell TIRF microscopy, we found that Npc1−/− CTLs released more GzmB than their WT counterparts (Figure 1E; supplemental Figure 3; supplemental Movies 1 and 2), consistent with the higher GzmB expression (supplemental Figure 2D) and more efficient degranulation (Figure 1D).
Overall, our findings left us with the paradox that Npc1−/−.CL4 CTLs have a dramatically diminished capacity to kill target cells but possess adequate levels of cytotoxic Prf and GzmB and functional cellular machinery for subcellular CG trafficking, membrane fusion, and exocytosis.
CGs of Npc1−/−.CL4 CTLs are confined in lipid-dense autophagic structures
While carrying out immunofluorescence confocal microscopy, we noticed that the CGs from Npc1−/−.CL4 CTLs were morphologically different from those in Npc1+/+.CL4 cells. As demonstrated by Prf and GzmB staining, Npc1−/−.CL4 CGs were enlarged and clustered in comparison with the typically discrete and punctate CGs found in Npc1+/+.CL4 CTLs (Figure 1C; supplemental Figure 2E). A computer-generated 3-dimensional reconstruction based on input microscopy data31 confirmed the CGs in Npc1−/−.CL4 CTLs to be significantly larger (Figure 2A), and there were also fewer per cell (Figure 1C). We hypothesized that the enlarged CGs might result from the increased endolysosomal lipid burden that characterizes Npc1-deficient cells.32 Staining with filipin III, which binds to nonesterified cholesterol (Figure 2B), or with fluorescent cholera toxin B confirmed that the Npc1−/−.CL4 CTLs contained many cholesterol-rich vesicles and that their CGs were enriched for GM1 and GzmB (Figure 2C-E), in stark contrast to Npc1+/+.CL4 CTLs, the CGs of which contained marginal levels of cholesterol and GM1 (Figure 2B-E).

Lipid accumulation in CGs of Npc1−/−.CL4 CTLs. (A) Confocal immunofluorescence microscopy shows GzmB-containing cytotoxic granules (green; top). Three-dimensional reconstruction of CGs (Imaris vesicles) based on GzmB staining, which allowed assessment of their diameter. Diameter of CTL CGs (pooled data from n = 3 Npc1+/+ and n = 4 Npc1−/− mice), diameter of CGs per cell (pooled data), and mean biological replicates (right). DAPI is shown in blue. (B) Confocal microscopy shows vesicles containing unesterified cholesterol stained with filipin III in Npc1−/− and Npc1+/+ CTLs. (C) Confocal immunofluorescence microscopy shows colocalization of GzmB (green) and fluorescent cholera toxin B (CTxB; magenta) in activated Npc1−/− and Npc1+/+ CTLs. Pearson correlation coefficient was used to quantify colocalization of GzmB and CTxB. (D) Total area of CTxB-labeled compartment (as shown in panel C) was assessed by accumulation of monosialotetrahexosylganglioside (GM1); mean biological replicates (inset; n = 6 Npc1+/+ and n = 7 Npc1−/−). (E) Colocalization of GzmB and CTxB (as shown in panel C) using overlap coefficient; biological replicates (inset; n = 3). Detailed description of microscopy and analysis provided in the data supplement. *P < .05, ***P < .001, ****P < .0001. DAPI, 4′,6-diamidino-2-phenylindole.
Lipid accumulation in CGs of Npc1−/−.CL4 CTLs. (A) Confocal immunofluorescence microscopy shows GzmB-containing cytotoxic granules (green; top). Three-dimensional reconstruction of CGs (Imaris vesicles) based on GzmB staining, which allowed assessment of their diameter. Diameter of CTL CGs (pooled data from n = 3 Npc1+/+ and n = 4 Npc1−/− mice), diameter of CGs per cell (pooled data), and mean biological replicates (right). DAPI is shown in blue. (B) Confocal microscopy shows vesicles containing unesterified cholesterol stained with filipin III in Npc1−/− and Npc1+/+ CTLs. (C) Confocal immunofluorescence microscopy shows colocalization of GzmB (green) and fluorescent cholera toxin B (CTxB; magenta) in activated Npc1−/− and Npc1+/+ CTLs. Pearson correlation coefficient was used to quantify colocalization of GzmB and CTxB. (D) Total area of CTxB-labeled compartment (as shown in panel C) was assessed by accumulation of monosialotetrahexosylganglioside (GM1); mean biological replicates (inset; n = 6 Npc1+/+ and n = 7 Npc1−/−). (E) Colocalization of GzmB and CTxB (as shown in panel C) using overlap coefficient; biological replicates (inset; n = 3). Detailed description of microscopy and analysis provided in the data supplement. *P < .05, ***P < .001, ****P < .0001. DAPI, 4′,6-diamidino-2-phenylindole.
To further understand the nature of the enlarged Npc1−/−.CL4 CGs, we used TEM and also observed large membrane-enclosed structures (Figure 3A, right) that resembled autolysosomes, previously observed in unstimulated splenocytes of Npc1−/− mice.33 We also noticed that some of these structures contained CGs with an electron-dense core (Figure 3B), which we previously showed to be essential for Prf and GzmB retention within CTLs.34 However, distinct from WT CTLs, Npc1−/−-deficient CGs were consistently located within the autophagosomal structures in Npc1−/−.CL4 CTLs. This led us to the hypothesis that the enlarged, lipid-packed organelles (Figure 2B-C) might correspond to the aberrant autolysosome-like structures observed by TEM (Figure 3A-B). To test this, we assessed the global autophagy marker LC3-B in Npc1+/+.CL4 and Npc1−/−.CL4 CTLs (Figure 3C). We found that both the intracellular level and the area per cell occupied by LC3-B were significantly increased in mutant compared with WT CTLs (Figure 3D), consistent with our TEM observations. Importantly, we also found a significant colocalization of GzmB and LC3-B in Npc1−/−.CL4 CTLs (Figure 3C-E), consistent with the encapsulation of CGs inside autolysosomes (Figure 3A-B). Taken together, these results suggest that Npc1−/−.CL4 CTLs undergo abnormal autophagy, which results in confinement of cholesterol, GM1, and Prf/GzmB-containing CGs within enlarged autolysosome-like structures.

CGs from Npc1−/−.CL4 CTLs are trapped inside enlarged autolysosome-like structures. (A) TEM images of activated Npc1−/− and Npc1+/+ CTLs (scale bar, 2 μm) and zoomed-in autolysosome-like structures (scale bar, 200 nm). (B) TEM images of autolysosome-like structures trapping dense-core granules (arrows) from Npc1−/− CD8+ T cells (scale bar, 500 nm). (C) Confocal immunofluorescence microscopy shows colocalization of GzmB (green) and autophagosomal marker LC3-B (magenta) in activated Npc1−/− and Npc1+/+ CD8+ T cells. Pearson correlation coefficient (bar graph) was used to quantify GzmB and LC3-B colocalization. (D) Total area of LC3-B–labeled structures (as shown in panel C); biological replicates (right). (E) Colocalization of GzmB/LC3-B was assessed using overlap coefficient; biological replicates (right). Detailed description of microscopy and analysis is provided in the data supplement. *P < .05, ***P < .001, ****P < .0001. DAPI, 4′,6-diamidino-2-phenylindole.
CGs from Npc1−/−.CL4 CTLs are trapped inside enlarged autolysosome-like structures. (A) TEM images of activated Npc1−/− and Npc1+/+ CTLs (scale bar, 2 μm) and zoomed-in autolysosome-like structures (scale bar, 200 nm). (B) TEM images of autolysosome-like structures trapping dense-core granules (arrows) from Npc1−/− CD8+ T cells (scale bar, 500 nm). (C) Confocal immunofluorescence microscopy shows colocalization of GzmB (green) and autophagosomal marker LC3-B (magenta) in activated Npc1−/− and Npc1+/+ CD8+ T cells. Pearson correlation coefficient (bar graph) was used to quantify GzmB and LC3-B colocalization. (D) Total area of LC3-B–labeled structures (as shown in panel C); biological replicates (right). (E) Colocalization of GzmB/LC3-B was assessed using overlap coefficient; biological replicates (right). Detailed description of microscopy and analysis is provided in the data supplement. *P < .05, ***P < .001, ****P < .0001. DAPI, 4′,6-diamidino-2-phenylindole.
Induced nuclear translocation of TFEB in Npc1−/− CTLs corrects the autophagic defect but does not restore cytotoxicity
We next explored whether confinement of the CGs within aberrant autolysosomes was responsible for the impaired cytotoxicity of Npc1−/−.CL4 CTLs. The enlargement and abnormal complexity of these organelles and the intracellular accumulation of LC3-B were consistent with stalled autophagic flux, which was previously reported in Npc1-deficient endothelial cells.10 Autophagic defects are associated with the abnormal expression and/or subcellular localization of the transcription factor EB (TFEB) in a number of neurodegenerative and lysosomal storage disorders.35 TFEB is a master regulator of lysosomal biogenesis and autophagy cross talk, coordinating key aspects of both pathways, including the formation and fusion of lysosomes and autolysosomes and the overall progression of autophagic flux.36,37 We therefore asked whether the accumulation of abnormal autophagic structures in Npc1−/− CTLs was associated with impaired TFEB expression and/or its nuclear translocation. We determined that in WT quiescent CD8+ T cells, TFEB is localized exclusively in the cytosol, but it shifts into the nucleus upon antigen stimulation, reaching its maximum nuclear presence by 72 hours (supplemental Figure 4A). Therefore, we assessed TFEB cellular localization in Npc1+/+ and Npc1−/− CTLs before and after 3 days of activation. Remarkably, western immunoblotting and immunofluorescence microscopy revealed that in stark contrast to WT CTLs, TFEB was excluded from the nuclear fraction in activated Npc1−/− cells (Figure 4A; supplemental Figure 4A-B, top).
![TFEB overexpression resolved autophagic arrest but not cytotoxic defect in Npc1-KO CTLs. (A) Subcellular localization of TFEB was determined by western immunoblotting in naïve and day-3 activated CD8+ T cells from Npc1−/−.CL4 and Npc1+/+.CL4 mice. (B) Confocal immunofluorescence microscopy shows morphological restoration of CGs after TFEB overexpression in Bl/6.OTI CTLs that had the Npc1 gene knocked out using CRISPR/Cas9 (Npc1 KO). The cells were also retrovirally transduced with an empty murine stem cell virus (MSCV) vector or with TFEB-flag and stained for intracellular GzmB (green) and Prf (magenta). (C) Diameter of CGs was estimated by computational 3-dimensional re-creation (Imaris vesicles) based on GzmB staining. Isolated Bl/6.OTI CD8+ T cells were either transfected with NT or guide RNAs that target the Npc1 gene and retrovirally transduced with an empty MSCV vector or TFEB-flag complementary DNA cloned into MSCV vector. (D) Area of LC3-B+ organelles per cell was assessed after Npc1 KO and TFEB overexpression, as shown in panel B. Individual experiments are shown in supplemental Figure 4D. (E) TEM of control and Npc1-deficient cells transduced with an empy vector or TFEB-flag (n = 30 cells from each group). Shown is mean ± standard error of the mean (SEM). Npc1+/+ cells were compared using Mann-Whitney test, and Npc1−/− cells were compared using 1-tailed unpaired t test (this was due to nonnormal and normal distributions, respectively). (F) TFEB overexpression had no effect on the colocalization of GzmB and cholera toxin B (CTxB) in Npc1-deficient cells. (G) TFEB overexpression had no effect on CTxB accumulation (per cell) in Npc1-deficient cells. Individual experiments are shown in panel F. (H) Chromium-51 release assay using (SIINFEKL) EL-4 target cells and genetically modified Bl/6.OTI CTLs (as per panel B) showed no restoration of CTL function after overexpression of TFEB in Npc1-KO cells; Npc1-KO-TFEB-flag-MSCV and Npc1-KO-MSCV CTLs showed near-identical cytotoxic activity. Values plotted are standardized to maximum killing observed in NT-empty MSCV cells at 10:1 effector-to-target (E:T) ratio and set at 100% (average cytotoxicity at 10:1 E:T ratio was 75.9% ± 18.9% [mean ± standard deviation of n = 3 independent experiments]). Each value shown represents mean ± SEM (n = 3). Detailed description of microscopy and analysis is provided in data supplement. *P < .05, ***P < .001, ****P < .0001. C, cytosolic; DAPI, 4′,6-diamidino-2-phenylindole; N, nuclear fractions; ns, not significant.](https://ash.silverchair-cdn.com/ash/content_public/journal/blood/139/12/10.1182_blood.2021013477/3/m_bloodbld2021013477f4.png?Expires=1765900007&Signature=qNLEsr18~bEnqhf34KqR50U4scq1k1fPP0l0OLTGTvFZZBt58Gz~RFZqWYqWUTdTc~sukJsfikZODlXJP7ptIM--LPa2b9j59DkNDWEXHf0GsOQ~Tp5f0kSfanzfLYxuiMRexJDb-WYe97qsO5YWdQ4j60mdRukQsKncVqpABnek0YWwsSmur7wejbDPsmSApxy6S7LzNfjDzhbUH00LiQwTBmP0hy1CpNryMKHQ06d9iiOfEFa7qlpIsyNR8vT77bfqCQer7eLIZxhZIxhdVHfYTBwMFWKWFBoyL55tIYRLItTr0PVzjkO4V79M-aDyApy4pV67R1qPINTSMcOs9w__&Key-Pair-Id=APKAIE5G5CRDK6RD3PGA)
TFEB overexpression resolved autophagic arrest but not cytotoxic defect in Npc1-KO CTLs. (A) Subcellular localization of TFEB was determined by western immunoblotting in naïve and day-3 activated CD8+ T cells from Npc1−/−.CL4 and Npc1+/+.CL4 mice. (B) Confocal immunofluorescence microscopy shows morphological restoration of CGs after TFEB overexpression in Bl/6.OTI CTLs that had the Npc1 gene knocked out using CRISPR/Cas9 (Npc1 KO). The cells were also retrovirally transduced with an empty murine stem cell virus (MSCV) vector or with TFEB-flag and stained for intracellular GzmB (green) and Prf (magenta). (C) Diameter of CGs was estimated by computational 3-dimensional re-creation (Imaris vesicles) based on GzmB staining. Isolated Bl/6.OTI CD8+ T cells were either transfected with NT or guide RNAs that target the Npc1 gene and retrovirally transduced with an empty MSCV vector or TFEB-flag complementary DNA cloned into MSCV vector. (D) Area of LC3-B+ organelles per cell was assessed after Npc1 KO and TFEB overexpression, as shown in panel B. Individual experiments are shown in supplemental Figure 4D. (E) TEM of control and Npc1-deficient cells transduced with an empy vector or TFEB-flag (n = 30 cells from each group). Shown is mean ± standard error of the mean (SEM). Npc1+/+ cells were compared using Mann-Whitney test, and Npc1−/− cells were compared using 1-tailed unpaired t test (this was due to nonnormal and normal distributions, respectively). (F) TFEB overexpression had no effect on the colocalization of GzmB and cholera toxin B (CTxB) in Npc1-deficient cells. (G) TFEB overexpression had no effect on CTxB accumulation (per cell) in Npc1-deficient cells. Individual experiments are shown in panel F. (H) Chromium-51 release assay using (SIINFEKL) EL-4 target cells and genetically modified Bl/6.OTI CTLs (as per panel B) showed no restoration of CTL function after overexpression of TFEB in Npc1-KO cells; Npc1-KO-TFEB-flag-MSCV and Npc1-KO-MSCV CTLs showed near-identical cytotoxic activity. Values plotted are standardized to maximum killing observed in NT-empty MSCV cells at 10:1 effector-to-target (E:T) ratio and set at 100% (average cytotoxicity at 10:1 E:T ratio was 75.9% ± 18.9% [mean ± standard deviation of n = 3 independent experiments]). Each value shown represents mean ± SEM (n = 3). Detailed description of microscopy and analysis is provided in data supplement. *P < .05, ***P < .001, ****P < .0001. C, cytosolic; DAPI, 4′,6-diamidino-2-phenylindole; N, nuclear fractions; ns, not significant.
TFEB overexpression resolved autophagic arrest but not cytotoxic defect in Npc1-KO CTLs. (A) Subcellular localization of TFEB was determined by western immunoblotting in naïve and day-3 activated CD8+ T cells from Npc1−/−.CL4 and Npc1+/+.CL4 mice. (B) Confocal immunofluorescence microscopy shows morphological restoration of CGs after TFEB overexpression in Bl/6.OTI CTLs that had the Npc1 gene knocked out using CRISPR/Cas9 (Npc1 KO). The cells were also retrovirally transduced with an empty murine stem cell virus (MSCV) vector or with TFEB-flag and stained for intracellular GzmB (green) and Prf (magenta). (C) Diameter of CGs was estimated by computational 3-dimensional re-creation (Imaris vesicles) based on GzmB staining. Isolated Bl/6.OTI CD8+ T cells were either transfected with NT or guide RNAs that target the Npc1 gene and retrovirally transduced with an empty MSCV vector or TFEB-flag complementary DNA cloned into MSCV vector. (D) Area of LC3-B+ organelles per cell was assessed after Npc1 KO and TFEB overexpression, as shown in panel B. Individual experiments are shown in supplemental Figure 4D. (E) TEM of control and Npc1-deficient cells transduced with an empy vector or TFEB-flag (n = 30 cells from each group). Shown is mean ± standard error of the mean (SEM). Npc1+/+ cells were compared using Mann-Whitney test, and Npc1−/− cells were compared using 1-tailed unpaired t test (this was due to nonnormal and normal distributions, respectively). (F) TFEB overexpression had no effect on the colocalization of GzmB and cholera toxin B (CTxB) in Npc1-deficient cells. (G) TFEB overexpression had no effect on CTxB accumulation (per cell) in Npc1-deficient cells. Individual experiments are shown in panel F. (H) Chromium-51 release assay using (SIINFEKL) EL-4 target cells and genetically modified Bl/6.OTI CTLs (as per panel B) showed no restoration of CTL function after overexpression of TFEB in Npc1-KO cells; Npc1-KO-TFEB-flag-MSCV and Npc1-KO-MSCV CTLs showed near-identical cytotoxic activity. Values plotted are standardized to maximum killing observed in NT-empty MSCV cells at 10:1 effector-to-target (E:T) ratio and set at 100% (average cytotoxicity at 10:1 E:T ratio was 75.9% ± 18.9% [mean ± standard deviation of n = 3 independent experiments]). Each value shown represents mean ± SEM (n = 3). Detailed description of microscopy and analysis is provided in data supplement. *P < .05, ***P < .001, ****P < .0001. C, cytosolic; DAPI, 4′,6-diamidino-2-phenylindole; N, nuclear fractions; ns, not significant.
It was recently shown that overexpression and enforced nuclear localization of TFEB can reduce autophagic vesicle accumulation in Npc1-deficeint epithelial cells,38 so we tested whether the same approach would restore cytotoxicity to Npc1-deficient CTLs. To induce the nuclear targeting of TFEB, we overexpressed TFEB in BL/6.OTI CTLs in which the Npc1 gene had been knocked out using CRISPR/Cas9 (supplemental Figure 4B, middle and bottom). Remarkably, TFEB overexpression restored the morphology of the CGs in Npc1-KO CTLs; they became indistinguishable from WT cells transfected with NT (Figure 4B-C; supplemental Figure 4C). This was accompanied by a significant reduction in the accumulation of LC3-B (Figure 4D; supplemental Figure 4D) and autolysosomes (Figure 4E), further suggesting the rescue of the autophagic defect. As expected, TFEB overexpression had no effect on the morphology of CGs in WT NT cells (Figure 4C-D; supplemental Figure 4C-E). However, despite the significant changes in Npc1-KO CTLs, the lipid accumulation within CGs remained unchanged (Figure 4F-G; supplemental Figure 4F), and the TFEB-overexpressing cells were still unable to kill target cells (Figure 4H).
Clearance of accumulated lipids restores the cytotoxic function of Npc1−/− CTLs
Given that inducing the nuclear translocation of TFEB largely normalized CG morphology but did not reverse cytotoxic impairment, we next hypothesized that abnormal lipid accumulation in the CGs of Npc1−/− CTLs might directly affect the function of the CTL cytotoxins. There is currently no US Food and Drug Administration–approved treatment for NP-C1, but a number of preclinical studies and clinical trials point to the therapeutic potential of 2-hydroxypropyl-β-cyclodextrin (HPβCD) in addressing the neurological symptoms of patients with NP-C1.39 Although its exact mechanism of action is debated, HPβCD reverses cholesterol and sphingolipid accumulation in the endolysosomes of Npc1-deficient cells.40 Under this premise, we treated CTLs derived from Npc1−/−.CL4 and Npc1+/+.CL4 littermates with HPβCD for 4 days. The drug had no detectable effect on Npc1+/+.CL4 CTLs (supplemental Figure 5A-B), but as anticipated, CGs from Npc1−/−.CL4 CTLs were cleared of intracellular GM1 clusters and cholesterol (Figure 5A; supplemental Figure 5A, right), with GzmB and cholera toxin B showing reduced colocalization after treatment (Figure 5A). In contrast, HPβCD treatment did not influence the autophagic defect of Npc1−/− CTLs; the size of CGs in Npc1−/−.CL4 CTLs (Figure 5B) and the accumulation of LC3-B (Figure 5C) remained unchanged. Despite this, and in sharp contrast to TFEB overexpression, HPβCD-induced lipid clearance completely restored the cytotoxicity of Npc1−/−.CL4 CTLs (Figure 5D). This finding supports our hypothesis that lipid accumulation may directly affect the function of CTLs. Considering that (1) Prf and GzmB are stored within LAMP-1+ vesicles in Npc1−/−.CL4 CTLs (Figures 1C and 4B), (2) the cells undergo normal degranulation (Figure 1D), and (3) pro-GzmB is processed to the active form and released (Figure 1E; supplemental Figure 2D; supplemental Movies 1 and 2), our attention turned to a key remaining potential cause of impaired cytotoxicity: the inability of CTLs to release phospholipid-dependent Prf or failure of Prf to form pores on the target-cell membrane.
![HPβCD depletes lipid clusters from CGs, unlocking Prf dysfunction and restoring cytotoxic activity of Npc1-deficient CTLs. (A) Confocal immunofluorescence microscopy shows efficient GM1 clearance (as determined by cholera toxin B [CTxB] staining) in Npc1−/−.CL4 CTLs upon their treatment with 1 mM of HPβCD for 4 days; cells were costained with GzmB antibodies (green) and CTxB (magenta). Scale bar, 3 μm. Overlap coefficient was used to quantify the colocalization of GzmB and CTxB in HPβCD-treated and control cells. (B) Diameter of CGs (per cell) was estimated by computational 3-dimensional re-creation (Imaris vesicles) based on GzmB staining. (C) Total area of LC3-B+ vesicles per cell. (D) Chromium-51 (51Cr) release assay using CT-26 target cells shows the recovery of cytotoxic activity of HPβCD-treated Npc1−/−.CL4 CTLs to the level of Npc1+/+.CL4 CTLs. Values plotted are standardized to maximum killing observed in untreated Npc1+/+.CL4 CTLs at 10:1 effector-to-target (E:T) ratio and set at 100% (average cytotoxicity at 10:1 E:T ratio was 64.2% ± 16.4% [mean ± standard deviation of n = 3 independent experiments). Each value shown represents mean ± standard error of the mean (SEM) of n = 3 independent experiments. (E) Representative montage of confocal time-lapse microscopy shows the formation of the immunological synapse between CTLs and target cells. CTLs were labeled with calcium fluorophore Fluo-4AM, and the increase of green fluorescence indicated calcium(2) ion (Ca2+) flux and formation of the functional synapse by CTLs. Cells were incubated in the presence of 100 μM of propidium iodide (PI),21 and target cell membrane permeabilization was determined by the PI blush (red) in the cytosol of target cells. Day-5 activated Bl/6.OTI CTLs used here were transfected either with NT or Npc1-targeting guide RNA (Npc1 KO), as described in Methods. Ca2+ flux and PI uptake were observed at 4:30 and 5:30 minutes in NT, respectively; Ca2+ flux was observed at 2:30 minutes in Npc1 KO, but there was no PI uptake detected through to the end of the montage at 38:30 minutes. Quantification of immunological synapses that result in PI blush are shown on the right. Immunological synapses were considered as any events with Ca2+ flux in CTLs (n = 2 biological replicates per group; n = 70 NT and n = 88 Npc1-KO synapses). Scale bar, 10 μm. (F) (i) Live-cell 3-dimensional confocal microscopy shows time-dependent secretion of ALFA-tagged Prf from Npc1+/+.CL4 cells after their addition to CD3/28-coated coverslips. LifeAct mScarlet is shown in red, and Prf was detected by anti-ALFA Atto-488 nanobodies added to the media (shown in green). Scale bar, 2 μm. Enlarged image at 12.5 minutes is shown in supplemental Figure 6B. (ii) TIRF microscopy shows that that Npc1+/+ and Npc1−/− CTLs secrete similar amounts of Prf when added to anti-CD3/CD28–coated coverslips. Both cell types were sorted to achieve similar levels of expression of LifeAct mScarlet and Prf ALFA. Shown in each frame (separated by a white line) are 4 tiled images obtained at that time point. Scale bar, 10 μm. (iii) Quantitative analysis of Prf ALFA release per cell as described in supplemental Figure 6C; shown are combined results from 3 independent experiments (supplemental Movies 3 [empty vector control (EV)], 4 (Npc1+/+), and 5 (Npc1−/−). (G) Four-hour 51Cr release assay shows that ALFA Prf overexpression increases the activity of Npc1+/+.CL4 but not Npc1−/−.CL4 CTLs (each value represents mean ± SEM of 3 independent experiments). Detailed description of microscopy and analysis is provided in the data supplement. *P < .05, ****P < .0001. DAPI, 4′,6-diamidino-2-phenylindole; ns, not significant.](https://ash.silverchair-cdn.com/ash/content_public/journal/blood/139/12/10.1182_blood.2021013477/3/m_bloodbld2021013477f5a.png?Expires=1765900007&Signature=fbdn0O1MduIknTNPc30W37UGvmSEPZhZ0Z5Ksge1YsRAxrFYfiTUzGDJ7tXZ6BRrl-JWDqQzZlcXHud0tzbbMv0ZdDS2OGCwQxzG9XDEL5FGK1LklHsMGLa752g63vDuFEI6ksAySPbA54eade-qmSlv5LrJP5XZMys-NlXdFl3TkDw1GzcPgOHkNUdwqFkqXSCPqxwJ5dZIowR0gmlz2V~X1wC6K8ESYIHOE2GALguK6GD-f3ITO9TDqhjfx7fS9vmMMt4kzAP5BwJCvWk4CmK2KQMamr42CxpILmtL01Z2wY49Gxo828TKDNrEF7mqSjoc1yn225hy1IeJptfrvA__&Key-Pair-Id=APKAIE5G5CRDK6RD3PGA)
![HPβCD depletes lipid clusters from CGs, unlocking Prf dysfunction and restoring cytotoxic activity of Npc1-deficient CTLs. (A) Confocal immunofluorescence microscopy shows efficient GM1 clearance (as determined by cholera toxin B [CTxB] staining) in Npc1−/−.CL4 CTLs upon their treatment with 1 mM of HPβCD for 4 days; cells were costained with GzmB antibodies (green) and CTxB (magenta). Scale bar, 3 μm. Overlap coefficient was used to quantify the colocalization of GzmB and CTxB in HPβCD-treated and control cells. (B) Diameter of CGs (per cell) was estimated by computational 3-dimensional re-creation (Imaris vesicles) based on GzmB staining. (C) Total area of LC3-B+ vesicles per cell. (D) Chromium-51 (51Cr) release assay using CT-26 target cells shows the recovery of cytotoxic activity of HPβCD-treated Npc1−/−.CL4 CTLs to the level of Npc1+/+.CL4 CTLs. Values plotted are standardized to maximum killing observed in untreated Npc1+/+.CL4 CTLs at 10:1 effector-to-target (E:T) ratio and set at 100% (average cytotoxicity at 10:1 E:T ratio was 64.2% ± 16.4% [mean ± standard deviation of n = 3 independent experiments). Each value shown represents mean ± standard error of the mean (SEM) of n = 3 independent experiments. (E) Representative montage of confocal time-lapse microscopy shows the formation of the immunological synapse between CTLs and target cells. CTLs were labeled with calcium fluorophore Fluo-4AM, and the increase of green fluorescence indicated calcium(2) ion (Ca2+) flux and formation of the functional synapse by CTLs. Cells were incubated in the presence of 100 μM of propidium iodide (PI),21 and target cell membrane permeabilization was determined by the PI blush (red) in the cytosol of target cells. Day-5 activated Bl/6.OTI CTLs used here were transfected either with NT or Npc1-targeting guide RNA (Npc1 KO), as described in Methods. Ca2+ flux and PI uptake were observed at 4:30 and 5:30 minutes in NT, respectively; Ca2+ flux was observed at 2:30 minutes in Npc1 KO, but there was no PI uptake detected through to the end of the montage at 38:30 minutes. Quantification of immunological synapses that result in PI blush are shown on the right. Immunological synapses were considered as any events with Ca2+ flux in CTLs (n = 2 biological replicates per group; n = 70 NT and n = 88 Npc1-KO synapses). Scale bar, 10 μm. (F) (i) Live-cell 3-dimensional confocal microscopy shows time-dependent secretion of ALFA-tagged Prf from Npc1+/+.CL4 cells after their addition to CD3/28-coated coverslips. LifeAct mScarlet is shown in red, and Prf was detected by anti-ALFA Atto-488 nanobodies added to the media (shown in green). Scale bar, 2 μm. Enlarged image at 12.5 minutes is shown in supplemental Figure 6B. (ii) TIRF microscopy shows that that Npc1+/+ and Npc1−/− CTLs secrete similar amounts of Prf when added to anti-CD3/CD28–coated coverslips. Both cell types were sorted to achieve similar levels of expression of LifeAct mScarlet and Prf ALFA. Shown in each frame (separated by a white line) are 4 tiled images obtained at that time point. Scale bar, 10 μm. (iii) Quantitative analysis of Prf ALFA release per cell as described in supplemental Figure 6C; shown are combined results from 3 independent experiments (supplemental Movies 3 [empty vector control (EV)], 4 (Npc1+/+), and 5 (Npc1−/−). (G) Four-hour 51Cr release assay shows that ALFA Prf overexpression increases the activity of Npc1+/+.CL4 but not Npc1−/−.CL4 CTLs (each value represents mean ± SEM of 3 independent experiments). Detailed description of microscopy and analysis is provided in the data supplement. *P < .05, ****P < .0001. DAPI, 4′,6-diamidino-2-phenylindole; ns, not significant.](https://ash.silverchair-cdn.com/ash/content_public/journal/blood/139/12/10.1182_blood.2021013477/3/m_bloodbld2021013477f5b.png?Expires=1765900007&Signature=LfSuLnmbAYGZRubNgbVjoWdNsOo-P2LwHUhsoHsFZ~0Tys0vaR1JrAbQxTT8g0Cr3J3VtCypD7f~RovxgSRvVGXq8vnsB6tAeli7vHSBWy4tAFuUBBFltj3opOgM3H-kAM3-Dmg3C6CVgoUSCsRb-GDywV9X5XRHsVi67YdvQZsRRh17P4sJbJJbHDzqhs1fqOgtN7wvNZoselgPoONKBifgNgtQ-lS12VYWW~-GbWzzdJtftcXLbGoT2v5aibRQQ00AIAQ6yyjOmD~p0zkim716Yrxm2yLwPni7PBO2T7IMcjhkR1cceb7zqgpzQ3kdgO2iKrqf1Oq4XYlLT2neIw__&Key-Pair-Id=APKAIE5G5CRDK6RD3PGA)
HPβCD depletes lipid clusters from CGs, unlocking Prf dysfunction and restoring cytotoxic activity of Npc1-deficient CTLs. (A) Confocal immunofluorescence microscopy shows efficient GM1 clearance (as determined by cholera toxin B [CTxB] staining) in Npc1−/−.CL4 CTLs upon their treatment with 1 mM of HPβCD for 4 days; cells were costained with GzmB antibodies (green) and CTxB (magenta). Scale bar, 3 μm. Overlap coefficient was used to quantify the colocalization of GzmB and CTxB in HPβCD-treated and control cells. (B) Diameter of CGs (per cell) was estimated by computational 3-dimensional re-creation (Imaris vesicles) based on GzmB staining. (C) Total area of LC3-B+ vesicles per cell. (D) Chromium-51 (51Cr) release assay using CT-26 target cells shows the recovery of cytotoxic activity of HPβCD-treated Npc1−/−.CL4 CTLs to the level of Npc1+/+.CL4 CTLs. Values plotted are standardized to maximum killing observed in untreated Npc1+/+.CL4 CTLs at 10:1 effector-to-target (E:T) ratio and set at 100% (average cytotoxicity at 10:1 E:T ratio was 64.2% ± 16.4% [mean ± standard deviation of n = 3 independent experiments). Each value shown represents mean ± standard error of the mean (SEM) of n = 3 independent experiments. (E) Representative montage of confocal time-lapse microscopy shows the formation of the immunological synapse between CTLs and target cells. CTLs were labeled with calcium fluorophore Fluo-4AM, and the increase of green fluorescence indicated calcium(2) ion (Ca2+) flux and formation of the functional synapse by CTLs. Cells were incubated in the presence of 100 μM of propidium iodide (PI),21 and target cell membrane permeabilization was determined by the PI blush (red) in the cytosol of target cells. Day-5 activated Bl/6.OTI CTLs used here were transfected either with NT or Npc1-targeting guide RNA (Npc1 KO), as described in Methods. Ca2+ flux and PI uptake were observed at 4:30 and 5:30 minutes in NT, respectively; Ca2+ flux was observed at 2:30 minutes in Npc1 KO, but there was no PI uptake detected through to the end of the montage at 38:30 minutes. Quantification of immunological synapses that result in PI blush are shown on the right. Immunological synapses were considered as any events with Ca2+ flux in CTLs (n = 2 biological replicates per group; n = 70 NT and n = 88 Npc1-KO synapses). Scale bar, 10 μm. (F) (i) Live-cell 3-dimensional confocal microscopy shows time-dependent secretion of ALFA-tagged Prf from Npc1+/+.CL4 cells after their addition to CD3/28-coated coverslips. LifeAct mScarlet is shown in red, and Prf was detected by anti-ALFA Atto-488 nanobodies added to the media (shown in green). Scale bar, 2 μm. Enlarged image at 12.5 minutes is shown in supplemental Figure 6B. (ii) TIRF microscopy shows that that Npc1+/+ and Npc1−/− CTLs secrete similar amounts of Prf when added to anti-CD3/CD28–coated coverslips. Both cell types were sorted to achieve similar levels of expression of LifeAct mScarlet and Prf ALFA. Shown in each frame (separated by a white line) are 4 tiled images obtained at that time point. Scale bar, 10 μm. (iii) Quantitative analysis of Prf ALFA release per cell as described in supplemental Figure 6C; shown are combined results from 3 independent experiments (supplemental Movies 3 [empty vector control (EV)], 4 (Npc1+/+), and 5 (Npc1−/−). (G) Four-hour 51Cr release assay shows that ALFA Prf overexpression increases the activity of Npc1+/+.CL4 but not Npc1−/−.CL4 CTLs (each value represents mean ± SEM of 3 independent experiments). Detailed description of microscopy and analysis is provided in the data supplement. *P < .05, ****P < .0001. DAPI, 4′,6-diamidino-2-phenylindole; ns, not significant.
HPβCD depletes lipid clusters from CGs, unlocking Prf dysfunction and restoring cytotoxic activity of Npc1-deficient CTLs. (A) Confocal immunofluorescence microscopy shows efficient GM1 clearance (as determined by cholera toxin B [CTxB] staining) in Npc1−/−.CL4 CTLs upon their treatment with 1 mM of HPβCD for 4 days; cells were costained with GzmB antibodies (green) and CTxB (magenta). Scale bar, 3 μm. Overlap coefficient was used to quantify the colocalization of GzmB and CTxB in HPβCD-treated and control cells. (B) Diameter of CGs (per cell) was estimated by computational 3-dimensional re-creation (Imaris vesicles) based on GzmB staining. (C) Total area of LC3-B+ vesicles per cell. (D) Chromium-51 (51Cr) release assay using CT-26 target cells shows the recovery of cytotoxic activity of HPβCD-treated Npc1−/−.CL4 CTLs to the level of Npc1+/+.CL4 CTLs. Values plotted are standardized to maximum killing observed in untreated Npc1+/+.CL4 CTLs at 10:1 effector-to-target (E:T) ratio and set at 100% (average cytotoxicity at 10:1 E:T ratio was 64.2% ± 16.4% [mean ± standard deviation of n = 3 independent experiments). Each value shown represents mean ± standard error of the mean (SEM) of n = 3 independent experiments. (E) Representative montage of confocal time-lapse microscopy shows the formation of the immunological synapse between CTLs and target cells. CTLs were labeled with calcium fluorophore Fluo-4AM, and the increase of green fluorescence indicated calcium(2) ion (Ca2+) flux and formation of the functional synapse by CTLs. Cells were incubated in the presence of 100 μM of propidium iodide (PI),21 and target cell membrane permeabilization was determined by the PI blush (red) in the cytosol of target cells. Day-5 activated Bl/6.OTI CTLs used here were transfected either with NT or Npc1-targeting guide RNA (Npc1 KO), as described in Methods. Ca2+ flux and PI uptake were observed at 4:30 and 5:30 minutes in NT, respectively; Ca2+ flux was observed at 2:30 minutes in Npc1 KO, but there was no PI uptake detected through to the end of the montage at 38:30 minutes. Quantification of immunological synapses that result in PI blush are shown on the right. Immunological synapses were considered as any events with Ca2+ flux in CTLs (n = 2 biological replicates per group; n = 70 NT and n = 88 Npc1-KO synapses). Scale bar, 10 μm. (F) (i) Live-cell 3-dimensional confocal microscopy shows time-dependent secretion of ALFA-tagged Prf from Npc1+/+.CL4 cells after their addition to CD3/28-coated coverslips. LifeAct mScarlet is shown in red, and Prf was detected by anti-ALFA Atto-488 nanobodies added to the media (shown in green). Scale bar, 2 μm. Enlarged image at 12.5 minutes is shown in supplemental Figure 6B. (ii) TIRF microscopy shows that that Npc1+/+ and Npc1−/− CTLs secrete similar amounts of Prf when added to anti-CD3/CD28–coated coverslips. Both cell types were sorted to achieve similar levels of expression of LifeAct mScarlet and Prf ALFA. Shown in each frame (separated by a white line) are 4 tiled images obtained at that time point. Scale bar, 10 μm. (iii) Quantitative analysis of Prf ALFA release per cell as described in supplemental Figure 6C; shown are combined results from 3 independent experiments (supplemental Movies 3 [empty vector control (EV)], 4 (Npc1+/+), and 5 (Npc1−/−). (G) Four-hour 51Cr release assay shows that ALFA Prf overexpression increases the activity of Npc1+/+.CL4 but not Npc1−/−.CL4 CTLs (each value represents mean ± SEM of 3 independent experiments). Detailed description of microscopy and analysis is provided in the data supplement. *P < .05, ****P < .0001. DAPI, 4′,6-diamidino-2-phenylindole; ns, not significant.
Npc1−/− CTL Prf fails to form pores on the target-cell membrane
To explore the possibility that the abnormal lipid homoeostasis in the CGs of Npc1-deficient CTLs could adversely affect Prf lytic function, we performed time-lapse confocal microscopy on Npc1-KO BL/6.OTI CTLs forming immune synapses with ovalbumin peptide-pulsed MC57 target cells. Labeling the CTLs with the Ca2+ fluorophore Fluo-4 allowed us to pinpoint the formation of a functional immune synapse (as shown by a spike in Ca2+ signaling in the CTL), while the addition of 100 μM of PI to the culture medium enabled us to detect Prf-mediated disruption of the target-cell membrane as revealed by PI uptake into the cytosol (ie, the PI blush).21 We found that although ∼90% of the functional immune synapses formed by NT CRISPR CTLs led rapidly to PI blush within the target-cell cytosol, the number was reduced to ∼30% in Npc1-KO BL/6.OTI CTLs (Figure 5E). The flux of PI across the target-cell plasma membrane at the point of the immunological synapse and into the target-cell cytosol depends on the transient formation of transient transmembrane Prf pores; our findings indicate that Prf was inducing less membrane damage in cells targeted by CTLs that lacked Npc1 protein. In turn, this strongly suggests that the impaired cytotoxicity of Npc1-deficient CTLs was caused either by the failure to release Prf or by its inactivation, most likely by the aberrantly accumulated lipids inside the secretory granules, which was reversed through the restoration of lipid homoeostasis by HPβCD (Figure 5; supplemental Figure 5).
The detection of Prf in mouse CTLs has been a major challenge in the field because of its relatively low abundance (by comparison with natural killer [NK] cells) and the lack of appropriate antibodies.41 It is equally challenging to tag Prf, because its carboxy terminus is required for exocytic trafficking and is then efficiently cleaved once it reaches the secretory granules.42 To address this, we developed a novel methodology for assessing Prf release from the lymphocytes in real time. We engineered an ALFA-tag (SRLEEELRRRLTE)43 at the N terminus of Prf, which we placed immediately after the cleavable signaling peptide, because we had predicted from our X-ray crystal structure of Prf44 that this small insertion would not interfere with protein folding or function. Indeed, reconstitution of Prf1−/−.BL/6.OT1 CTLs with ALFA-tag Prf restored CTL cytotoxicity (supplemental Figure 6A). We then cotransduced Npc1+/+.CL4 and Npc1−/−.CL4 CTLs with LifeAct mScarlet and ALFA Prf and used real-time TIRF microscopy to demonstrate the formation of an immune synapse on anti-CD3/28–coated glass cover slips (assessed by LifeAct, as described for Figure 1E) followed by the release of ALFA-tag Prf from the cells.
First, we validated that the antibodies detected only extracellular ALFA-tag Prf (Figure 5Fi-ii; supplemental Figure 6B; supplemental Movie 3, showing an empty vector control). Then, we assessed ALFA Prf release (using anti-ALFA Atto-488 nanobodies) from the transduced Npc1+/+ and Npc1−/− CTLs. Similar to our observations with GzmB (Figure 1E; supplemental Figure 3; supplemental Movies 1 and 2), there was a significant increase in Prf secretion from Npc1−/− cells (Figure 5Fii-iii; supplemental Figure 6B-C; supplemental Movies 4 and 5). These results strongly suggest that the failure of Prf to form pores on the target-cell membrane was not due to its retention inside secretory granules of Npc1−/− CTLs. Rather, Prf function was severely compromised by its packaging into the aberrant, lipid-rich granules characteristic of Npc1−/− CTLs.
To substantiate this observation further, we assessed whether overexpression of Prf in Npc1−/− CTLs would restore their function. Remarkably, although Prf overexpression increased the cytotoxic activity of WT Npc1+/+ cells, there was no effect on the cytotoxicity of Npc1−/− CTLs (Figure 5G). These findings strongly suggest that, uniquely, the perturbed secretory granules of Npc1-deficeint mice created an immunosuppressive environment through the inhibition of Prf function.
CD8+ CTLs of patients with NP-C1 have variable defects of cytotoxicity
The next critical question was whether our observations in murine CTLs are relevant to the human disease. To investigate this, we assessed both the CTL and NK cell function of several patients with NP-C1 (supplemental Tables 1 and 2). Consistent with a previous report,15 we found no difference in the cytotoxic activity of NK cells from patients with NP-C1 and those from healthy donors (HDs; supplemental Figure 7A). We then tested CTL activity in the same patients; cells were transduced to express an anti-HER2 CAR as a tool for avoiding the selection of very small populations of antigen-specific human cells, and their ability to kill HER2-overexpressing MDA-MB-231 breast cancer cells was assessed. The CTLs from 6 of 8 adolescent and adult patients with NP-C1 (P1 and P4-P8) killed the target cells as efficiently as those of a pool of HDs (n = 14; supplemental Figure 7B). However, the CTLs of P2 and P3 had dramatically reduced cytotoxic activity (Figure 6A). Consistent with our findings in mice (Figure 1D), higher surface exposure of CD107a (LAMP1) after degranulation was observed in P2 and P3 (supplemental Figure 7C). In contrast, patients such as P1, who had normal CTL activity, had similar CD107a exposure to that of HDs (supplemental Figure 7C). Immunofluorescence microscopy also revealed that the CGs were significantly larger in the CTLs of P2 and P3 compared with those of HDs (Figures 7B), with increase in size inversely correlated with cytotoxicity (Figure 6A-B). In addition, the CTLs of P2 and P3 (who had the lowest cytotoxicity) had fewer CGs per cell than those of P1 and HDs (supplemental Figure 7D). TEM analysis of CTLs revealed that cells derived from P2 and P3 had the largest and most numerous autolysosome-like structures (Figure 6C). Finally, dense core granules were virtually absent in the CTLs of P3 and were significantly reduced in the cells of P2 compared with HDs (supplemental Figure 7E).
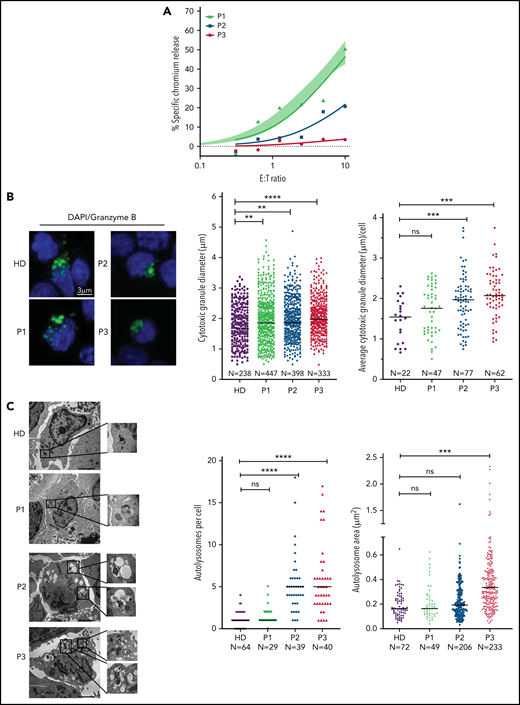
Cytotoxic defects in CTLs from adult patients with NP-C1 are in concordance with the increased formation of autolysosome-like structures. (A) Chromium-51 release assay of activated CTLs against MDA-MB-231 target cells at the effector-to-target (E:T) ratios indicated. Average of 8 HD CTL cytotoxicity assays is shown as shaded area (95% confidence interval). CTLs from patients with NP-C1 (P1-P3) display a spectrum of cytotoxic activities, from normal to severely impaired. (B) Confocal immunofluorescence microscopy shows GzmB (green) vesicles and DAPI (blue) in activated CTLs of HDs and patients with NP-C1. Diameter of CGs was estimated by the computational 3-dimensional reconstruction (Imaris vesicles) based on GzmB staining of CTLs from 2 HDs and 3 patients whose cells had distinctly different cytotoxic activity. (C) TEM images of activated CTLs (scale bar, 2 μm) and zoomed-in autolysosome-like structures (scale bar, 200 nm). Quantification of autolysosome-like structures per cell using n = 30 cells per HD or patient (middle). Quantification of the area of autolysosome-like structures based on GzmB staining (right). Detailed description of microscopy and analysis is provided in the data supplement. **P < .01, ***P < .001, ****P < .0001. DAPI, 4′,6-diamidino-2-phenylindole; ns, not significant.
Cytotoxic defects in CTLs from adult patients with NP-C1 are in concordance with the increased formation of autolysosome-like structures. (A) Chromium-51 release assay of activated CTLs against MDA-MB-231 target cells at the effector-to-target (E:T) ratios indicated. Average of 8 HD CTL cytotoxicity assays is shown as shaded area (95% confidence interval). CTLs from patients with NP-C1 (P1-P3) display a spectrum of cytotoxic activities, from normal to severely impaired. (B) Confocal immunofluorescence microscopy shows GzmB (green) vesicles and DAPI (blue) in activated CTLs of HDs and patients with NP-C1. Diameter of CGs was estimated by the computational 3-dimensional reconstruction (Imaris vesicles) based on GzmB staining of CTLs from 2 HDs and 3 patients whose cells had distinctly different cytotoxic activity. (C) TEM images of activated CTLs (scale bar, 2 μm) and zoomed-in autolysosome-like structures (scale bar, 200 nm). Quantification of autolysosome-like structures per cell using n = 30 cells per HD or patient (middle). Quantification of the area of autolysosome-like structures based on GzmB staining (right). Detailed description of microscopy and analysis is provided in the data supplement. **P < .01, ***P < .001, ****P < .0001. DAPI, 4′,6-diamidino-2-phenylindole; ns, not significant.
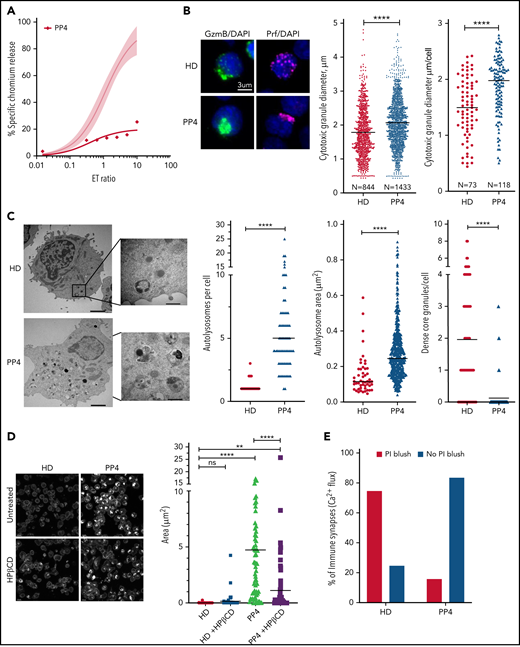

Restoration of cytotoxic activity of CTLs from pediatric patients with NP-C1 by HPβCD. (A) Chromium-51 (51Cr) release assay shows reduced cytotoxicity of CTLs from pediatric patients with NP-C1 at the effector-to-target (E:T) ratios indicated using MDA-MB-231 target cell. Average cytotoxic activity (95% confidence interval shown as shaded gray) of CTLs from 4 HDs. (B) Confocal immunofluorescence microscopy shows GzmB (green)/Prf (magenta) vesicles from an HD and PP4. DAPI is shown in blue. The Diameter of CGs was estimated by computational 3-dimensional re-creation (Imaris vesicles) based on GzmB staining of 2 HD samples and PP4. (C) TEM images show details of activated CTLs (scale bar, 2 μm) and zoomed-in autolysosome-like structures (scale bar, 500 nm). Number of autolysosome-like structures per cell (left), area of autolysosome-like structures per cell (middle), and number of dense-core granules per cell (n = 73 for HD control and n = 72 for PP4). (D) Confocal microscopy of activated CD8+ T cells shows vesicles containing unesterified cholesterol stained with filipin III. HD and PP4 cells were treated with 1 mM of HPβCD for 3 days. Filipin area per cell (right; analysis provided in supplemental Figure 9). (E) Quantification of immunological synapses between anti-HER2 CAR T cells and MDA-MB-231 targets that result in PI blush are shown. Immunological synapses were considered as any events with Ca2+ flux in CTLs (n = 35 HD and n = 19 PP4 synapses). (F) 51Cr release assay of activated HPβCD-treated CTLs killing MDA-MB-231 target cells shows a partial restoration of CTL cytotoxicity from PP4. Detailed description of microscopy and analysis is provided in the data supplement. **P < .01, ****P < .0001. DAPI, 4′,6-diamidino-2-phenylindole; ns, not significant.
Restoration of cytotoxic activity of CTLs from pediatric patients with NP-C1 by HPβCD. (A) Chromium-51 (51Cr) release assay shows reduced cytotoxicity of CTLs from pediatric patients with NP-C1 at the effector-to-target (E:T) ratios indicated using MDA-MB-231 target cell. Average cytotoxic activity (95% confidence interval shown as shaded gray) of CTLs from 4 HDs. (B) Confocal immunofluorescence microscopy shows GzmB (green)/Prf (magenta) vesicles from an HD and PP4. DAPI is shown in blue. The Diameter of CGs was estimated by computational 3-dimensional re-creation (Imaris vesicles) based on GzmB staining of 2 HD samples and PP4. (C) TEM images show details of activated CTLs (scale bar, 2 μm) and zoomed-in autolysosome-like structures (scale bar, 500 nm). Number of autolysosome-like structures per cell (left), area of autolysosome-like structures per cell (middle), and number of dense-core granules per cell (n = 73 for HD control and n = 72 for PP4). (D) Confocal microscopy of activated CD8+ T cells shows vesicles containing unesterified cholesterol stained with filipin III. HD and PP4 cells were treated with 1 mM of HPβCD for 3 days. Filipin area per cell (right; analysis provided in supplemental Figure 9). (E) Quantification of immunological synapses between anti-HER2 CAR T cells and MDA-MB-231 targets that result in PI blush are shown. Immunological synapses were considered as any events with Ca2+ flux in CTLs (n = 35 HD and n = 19 PP4 synapses). (F) 51Cr release assay of activated HPβCD-treated CTLs killing MDA-MB-231 target cells shows a partial restoration of CTL cytotoxicity from PP4. Detailed description of microscopy and analysis is provided in the data supplement. **P < .01, ****P < .0001. DAPI, 4′,6-diamidino-2-phenylindole; ns, not significant.
NP-C1 is usually more severe and can be fatal when it presents in childhood, because it generally involves mutations that affect critical protein domains.3,45,46 We asked whether the CTLs of pediatric patients with NP-C1 had greater cytotoxic impairment than those of adult patients (supplemental Table 2). Once again, we found NK cytotoxicity to be unaffected (supplemental Figure 8A). By contrast, patient-derived CTLs showed variable loss of cytotoxicity, even among patients who had inherited the same NPC1 mutations (PP1-PP3; supplemental Figure 8B). Notably, CTLs of PP4, the most severely affected patient, showed an almost complete loss of function (Figure 7A). Once again, we found that the loss of CTL activity was associated with CGs of increased diameter (Figure 7B; supplemental Figure 8C, cytotoxic granule diameter per cell), particularly in PP4 (mean CG volume, 3.5 μm3 vs 2 μm3 in HD CTLs). The number of CGs per CTL was similar in all patients, including PP4 (supplemental Figure 8D). However, reduced CTL cytotoxicity correlated with increased number and size of autolysosome-like structures (Figures 7C; supplemental Figure 8E), which again was most pronounced in PP4 (Figure 7C). TEM also revealed a significant decrease in dense core granules in CTLs derived from the same patient (Figure 7C). Critically, failure of patient CTLs to kill target cells was strongly associated with their failure to deliver functional Prf, as determined by the absence of PI fluorescence in target cells that had made authentic synapses with CTLs (Figure 7E). Supporting this, filipin III staining showed an increase in cholesterol-containing vesicles in the CTLs of PP4 compared with HD cells (Figure 7D, top; supplemental Figure 9). Finally, treating the CTLs of PP4 with HPβCD largely cleared cholesterol accumulation (Figure 7D) and rescued the cytotoxic defect (Figure 7F).
Discussion
We discovered that deficiency in the lysosomal cholesterol transporter NPC1 suppresses CTL cytotoxicity, both in patients with NP-C1 and in an authentic mouse model of the disease. Given that the life-threatening manifestations of NP-C1 usually involve severe neurological dysfunction, it is perhaps understandable that studies of cellular immunity have to this point been relatively limited. However, the findings of the current study make it clear that long-term care of children and young adults with NP-C1 should not ignore a potentially heightened susceptibility to diseases that rely on cellular immunity, especially serious viral infections. Furthermore, we identified and deconvoluted the cellular and biochemical changes occurring in CTLs and identified the primary reason for their reduced cytotoxicity: inactivation of Prf as a result of lipid accumulation in the cytotoxic secretory granules.
Despite the multiple cellular changes observed in NPC1-deficient CTLs, the reduced cytotoxicity was the result of the loss of Prf function (but not the failure of secretion); to our knowledge, the only previously reported cause of functional Prf failing to form pores on target cells within an immune synapse is its pharmacological inhibition.47 In the current study, loss of Prf activity might potentially have occurred at the pre- or postsynaptic level. After its release into the synapse, the first essential step of Prf in pore formation is its binding to the target-cell plasma membranes through its Ca2+-dependent C2 domain followed by its oligomerization into large pores.20,48 We postulate that Prf may have evolved to remain soluble while within the CGs or, alternatively, that the inner leaflet of the CG is shielded from Prf, possibly by heavily glycosylated LAMP proteins and/or the proteoglycan serglycin. In the case of NPC1 deficiency, lipid hyperaccumulation in the CGs may result in Prf being sequestered/inactivated and therefore no longer capable of forming pores on the target cell. It is also possible that the abnormally high concentration of lipids released from CGs within the synaptic space competes with lipids on the target-cell membrane as binding sites for Prf.
Previous studies have demonstrated that dysregulated autophagy and lysosome biogenesis are often traceable to dysfunction of the master regulator transcription factor TFEB. We discovered that whereas TFEB translocated into the nucleus upon the activation of WT CTLs, it remained in the cytoplasm in Npc1-deficient cells. Dense-core CGs were still formed in mutant CTLs (although this was not uniformly observed in patients with NP-C1), but they colocalized with enlarged autolysosomal structures. These unexpected observations suggest that TFEB plays distinct biological roles in CTLs and more commonly studied epithelial cells49; although TFEB still controls autophagy, it plays no appreciable role in the formation of dense-core CGs or in CTL cytotoxicity. Because targeting impaired autophagy has been proposed as a therapeutic strategy for NP-C1 and other lysosomal storage disorders,50,51 we expected that restoring TFEB expression and its nuclear targeting would rescue the cytotoxicity of Npc1−/− CTLs. However, the restoration of autophagic flux by TFEB was not accompanied by improved target-cell killing, and the CGs of Npc1−/− CTLs remained enriched with cholesterol/sphingolipids. To address the issue of CTL dysfunction pharmacologically, we treated the cells with HPβCD, which is currently being trialed in patients with NP-C1 because it promotes lysosomal lipid clearance and may also contribute to resolving autophagic defects.52 Indeed, HPβCD efficiently cleared lipid clusters in Npc1-deficient CTLs but did not restore the autophagic flux. Remarkably, CGs in the CTLs of pediatric patients with NP-C1 and murine Npc1-deficient CTLs showed a decreased lipid load and at least partially recovered their cytotoxic activity after HPβCD treatment. Overall, the restoration of lipid homeostasis seemed to be the primary mechanism responsible for the recovery of CTL cytotoxicity, whereas the clearance of aberrant autophagic bodies, a common target of NP-C1 therapies, had no appreciable impact. Ongoing intrathecal (was registered at www.clinicaltrials.gov as #NCT02534844) and systemic IV (#NCT02912793) clinical trials of HPβCD in patients with NPC1 are currently under way. It is expected that the latter study will mainly report on the efficacy of the drug for neurological symptoms of the disease, but a future trial might potentially consider extending the study to determine the impact of therapy on cellular immune function.
One previous study investigated NK cell function in Npc1−/− mice and patients with NP-C1 and, surprisingly, found a significant loss of cytotoxicity in the former but none in the latter.15 However, we were unable to reproduce these results and found that as with human cells, the cytotoxic activity of mouse NK cells was unaffected by the loss of the Npc1 gene, despite the cells sharing some of the phenotypic features of Npc1-deficient CTLs (supplemental Figure 10). Although NK cells and CTLs use very similar Prf-dependent cytotoxic mechanisms, their biologies are distinctly different.53 Indeed, the impact of NPC1 deficiency was far more pronounced in CTLs; NK cell activity remained unaffected in mice and patients, with virtually undetectable or severely reduced CTL cytotoxicity. Having explored many aspects of the effector mechanism, we conclude that the observed dichotomy was due to the suppression of Prf pore-forming activity specifically in CTLs but not in NK cells. This finding is unique, because in marked contrast, structural mutations in lymphocyte Prf tend to affect CTL and NK cell cytotoxicity to a similar extent.54
If some patients with NP-C1 retain only marginal CTL activity, how do they escape severe immune dysregulation? It has been demonstrated in acute mouse models that the presence of functional NK cells is more important for preserving immune homeostasis than the maintenance of functional CTLs.55 In contrast, impaired CTL immune surveillance in humans may predispose them to immunoregulatory disorders of varying severity, leading to unexpected/atypical clinical presentations such as interstitial lung disease, stunted growth, or hematological cancer.56,57 Interestingly, patients with another sphingolipidosis, Gaucher disease, develop B-cell lymphoma, visceromegaly, and hemophagocytic lymphohistiocytosis,58-61 all of which can be manifestations of Prf deficiency. More broadly, aberrant Prf function may be a feature of a range of lysosomal storage disorders; future laboratory and clinical studies should therefore consider immune insufficiency as a potential cause of any unexplained clinical symptoms of this vast family of diseases.
In conclusion, we discovered that NPC1 deficiency results in severely diminished CTL (but not NK cell) cytotoxicity and that the determining factor is aberrant lipid accumulation in CGs, which leads to Prf inactivation. Because CTLs seem to be highly sensitive to NPC1 deficiency and can be assessed functionally from a small blood sample, they represent an easily accessible source of cells for understanding NPC1 pathogenesis, testing novel therapies, and potentially devising surrogate assays to predict disease severity in individual cases, even neonates.
Acknowledgments
The authors thank Romain Laine (University College London) for assistance in developing and optimizing the live-cell total internal reflection fluorescence technique; the Centre for Advanced Histology and Microscopy, Core Flow Cytometry Facility, and Core Animal Facility (Peter MacCallum Cancer Centre); and the patients with NP-C1 and healthy donors for contributing samples.
This work was supported by a fellowship and grants 1128587 (I.V., J.A.T.), 1059126 (I.V.) and 2011020 (I.V., M.W., A.J.B.) from the Australian National Health and Medical Research Council, research grant funding from the Australian NP-C Disease Foundation, Inc. (Y.H.H.), a University of Melbourne postgraduate scholarship (D.C.), and a European Molecular Biology Organization fellowship (T.W.H.F.).
Authorship
Contribution: D.C., J.A.R.-S., T.N., V.R.S., Y.H.H., A.W.H., T.W.H.F., A.J.B., and I.V. designed and conducted experiments; N.S., D.B., H.P., and M.W. contributed to the clinical aspects of the study; N.D.Y. contributed to data analysis; M.W., J.A.T., A.J.B., and I.V. conceived and supervised the study; and D.C., M.W., J.A.T., A.J.B., and I.V. wrote the paper, with other contributions from other authors.
Conflict-of-interest disclosure: The authors declare no competing financial interests.
Correspondence: Ilia Voskoboinik, Peter MacCallum Cancer Centre, 305 Grattan St, Melbourne, 3000, Australia; e-mail: ilia.voskoboinik@petermac.org.
The online version of this article contains a data supplement.
The publication costs of this article were defrayed in part by page charge payment. Therefore, and solely to indicate this fact, this article is hereby marked “advertisement” in accordance with 18 USC section 1734.

This feature is available to Subscribers Only
Sign In or Create an Account Close Modal