

Key Points
EuroFlow standardized multiparameter flow cytometry improves identification, quantitation, and characterization of circulating Sézary cells.
Immunophenotypically distinct Sézary subsets are clonally related and share a transcriptomic signature indicating impaired T-cell function.

Abstract
Sézary syndrome (SS) is an aggressive leukemic form of cutaneous T-cell lymphoma with neoplastic CD4+ T cells present in skin, lymph nodes, and blood. Despite advances in therapy, prognosis remains poor, with a 5-year overall survival of 30%. The immunophenotype of Sézary cells is diverse, which hampers efficient diagnosis, sensitive disease monitoring, and accurate assessment of treatment response. Comprehensive immunophenotypic profiling of Sézary cells with an in-depth analysis of maturation and functional subsets has not been performed thus far. We immunophenotypically profiled 24 patients with SS using standardized and sensitive EuroFlow-based multiparameter flow cytometry. We accurately identified and quantified Sézary cells in blood and performed an in-depth assessment of their phenotypic characteristics in comparison with their normal counterparts in the blood CD4+ T-cell compartment. We observed inter- and intrapatient heterogeneity and phenotypic changes over time. Sézary cells exhibited phenotypes corresponding with classical and nonclassical T helper subsets with different maturation phenotypes. We combined multiparameter flow cytometry analyses with fluorescence-activated cell sorting and performed RNA sequencing studies on purified subsets of malignant Sézary cells and normal CD4+ T cells of the same patients. We confirmed pure monoclonality in Sézary subsets, compared transcriptomes of phenotypically distinct Sézary subsets, and identified novel downregulated genes, most remarkably THEMIS and LAIR1, which discriminate Sézary cells from normal residual CD4+ T cells. Together, these findings further unravel the heterogeneity of Sézary cell subpopulations within and between patients. These new data will support improved blood staging and more accurate disease monitoring.
Introduction
Sézary syndrome (SS) is an aggressive leukemic form of cutaneous T-cell lymphoma (CTCL) characterized by the presence of clonal mature CD4+ T helper (Th) cells that home to the skin and recirculate between lymph nodes and peripheral blood (PB). SS is defined by the clinical triad of (pruritic) erythroderma, generalized lymphadenopathy, and the presence of neoplastic, clonally related T cells in PB and skin.1,2 Diagnosing SS is challenging and often delayed because of nonspecific clinical and histopathological features that are also frequently seen in more prevalent benign erythrodermic skin disorders, such as chronic atopic dermatitis, psoriasis, pityriasis rubra pilaris, and idiopathic/drug-related erythroderma.3,4 Consequently, the detection of neoplastic cells, so-called Sézary cells, and the assessment of tumor burden in blood are imperative for diagnosis and become progressively relevant for disease staging, assessment of therapeutic effectiveness, disease progression, and prognosis.5-8
Traditionally, blood involvement has been manually assessed by microscopy, based on the detection of morphologically atypical mononuclear cells with characteristic convoluted cerebriform nuclei. Restricted by low sensitivity and considerable interobserver variability, this method is currently broadly replaced by flow cytometry (FC) immunophenotyping of Sézary cells in PB, which mostly relies on the loss of CD26 and CD7 cell surface markers.3,6,7,9,10 Recent work has made significant progress in immunophenotypic profiling of Sézary cells and recognized that Sézary cells exhibit heterogeneous phenotypes that surpass the aberrant expression of CD7 and CD26 markers alone.3,11-13 Additional markers proposed for the detection of Sézary cells include, among others, upregulated expression of CD158k, adhesion molecule CD164, and immune checkpoint receptor PD-1 (CD279).9,14-20 Furthermore, these FC studies have also provided novel insights into the cellular identity of Sézary cells and have questioned the long-standing hypothesis that Sézary cells originate from central memory, Th2 differentiated cells.13,21-28 Nevertheless, despite the extensive use in research and widespread implementation in clinical practice, current FC protocols lack standardization both technically and in the composition of the applied antibody panels, which complicates comparability between and within studies and laboratories. In addition, the in-depth characterization and classification of Sézary cells by FC is hampered by small sample size, the limited number of markers used, varying methodology, and profound diversity in Sézary cell (immunophenotypic) characteristics.12,25 Consequently, in the absence of a superior approach, the immunophenotypic criteria for Sézary cell counts remain unrevised.
To address these issues, we applied highly sensitive and standardized EuroFlow-based multiparameter FC (MFC) methods and tools for detailed immunophenotyping of a cohort of 24 patients with SS. EuroFlow is a consortium that has designed, developed, and validated standardized approaches for FC evaluation of hematological malignancies.29,30 We performed fluorescence-activated cell sorting (FACS) and RNA sequencing (RNA-seq) on purified phenotypically distinct Sézary and normal CD4+ T-cell subsets of the same patients and healthy controls (HCs). With this approach, we aimed to (1) define the immunophenotypic profile of Sézary cells using standardized FC approaches, (2) perform an in-depth characterization of SS cellular identity, (3) evaluate, in different phases of the disease, potential immunophenotypic changes over time, (4) study the transcriptome of phenotypically distinct Sézary cell subsets, and (5) discover novel Sézary-specific markers using gene expression data.
Methods
Patients, controls, and samples
We prospectively included a cohort of 24 patients with SS (12 men and 12 women; median age 68.5 years, range 52-85). Patient characteristics are summarized in Table 1. To evaluate potential immunophenotypic changes over time, 13 follow-up samples were obtained from 8 SS cases within 23 months after inclusion of the initial PB sample. All patients with SS were diagnosed by an expert panel of the Dutch Cutaneous Lymphoma Group and were included in the Dutch national registry for cutaneous lymphomas. Diagnoses were made in accordance with the World Health Organization and European Organization for Research and Treatment of Cancer classification before or at the time of inclusion in this study.1 A total of 10 age- and sex-matched HCs (6 men and 4 women; median age 60 years, range 47-62) were also included. This study was approved by the Medical Ethics Committee of the Leiden University Medical Center, and written informed consent was obtained from all individuals in line with the Declaration of Helsinki.
Clinical characteristics of patients with SS (n = 24) at blood sampling
| SS case | Interval diagnosis to study inclusion, mo | Age at sample inclusion, y | WBC × 109/L (Sysmex) | Treatment at blood sampling | Status last follow-up |
|---|---|---|---|---|---|
| 1 | 6 | 75 | 9.2 | Topical therapy | D+ |
| 2 | 44 | 64 | 7.8 | Topical therapy | A+ |
| 3 | 15 | 61 | 6.6 | Topical therapy, PUVA | A+ |
| FU1* | 35 | 63 | 6.5 | Topical therapy | |
| FU2 | 50 | 64 | 16.5 | Topical therapy, MTX, prednisone | |
| 4 | 22 | 68 | 6.0 | Topical therapy | A+ |
| 5 | 23 | 85 | 9.0 | Topical therapy | D+ |
| 6 | 15 | 72 | 14.9 | Topical therapy, prednisone | A+ |
| FU1 | 34 | 74 | 11.9 | Emollients | |
| 7 | 32 | 79 | 9.8 | Topical therapy, prednisone | D+ |
| 8† | 0 | 66 | 10.7 | Topical therapy | A+ |
| FU1 | 10 | 67 | 10.8 | Topical therapy | |
| FU2* | 17 | 67 | 10.5 | Topical therapy | |
| FU3 | 30 | 68 | 10.4 | Topical therapy, PUVA | |
| 9 | 46 | 77 | 5.7 | Topical therapy, MTX | A+ |
| FU1 | 66 | 78 | 10.9 | Topical therapy, prednisone, TSI | |
| 10† | 0 | 65 | 15.3 | Prednisone | D+ |
| 11 | 6 | 61 | 4.8 | PUVA, IFN-α | A+ |
| FU1 | 16 | 62 | 25.7 | Resminostat, CHOEP | |
| FU2 | 25 | 62 | 4.5 | Prednisone, mogamulizumab, gemcitabin | |
| 12† | 0 | 82 | 7.9 | Topical therapy, prednisone | A+ |
| FU1 | 18 | 84 | 7.3 | Topical therapy, prednisone, mogamulizumab | |
| 13† | 0 | 57 | 11.5 | Bath-PUVA | A+ |
| FU1 | 6 | 57 | 11.9 | Topical therapy, bath-PUVA | |
| 14† | 0 | 80 | 115.8 | Chlorambucil | D+ |
| 15 | 68 | 69 | 10.7 | Emollients | D+ |
| 16 | 2 | 67 | 11.7 | Topical therapy, IFN-α, prednisone | A+ |
| FU1 | 9 | 67 | 10.8 | Topical therapy, IFN-α, prednisone | |
| FU2 | 15 | 68 | 13.7 | Topical therapy, prednisone, mogamulizumab | |
| 17*,† | 0 | 77 | 7.4 | Topical therapy | A+ |
| 18 | 20 | 68 | 16.2 | CHOP, topical therapy | A+ |
| 19 | 130 | 72 | 6.0 | CHOP | D+ |
| 20† | 0 | 59 | 5.8 | Topical therapy, ciclosporin, bleach bath | A+ |
| 21 | 4 | 73 | 14.1 | Emollients | A+ |
| 22 | 1 | 61 | 11.2 | Topical therapy, prednisone, UVB | A+ |
| 23† | 0 | 52 | 10.4 | Prednisone | A+ |
| 24 | 21 | 83 | 8.9 | Topical therapy, prednisone | A+ |
Follow-up status of each patient is given as alive (A+) or died (D+) with SS.
CHOP, cyclophosphamide doxorubicin (Adriamycin) vincristine (Oncovin) prednisolone; FU, follow-up; IFN, interferon; PUVA, psoralen and UV light A; TSI, total skin electron irradiation; UVB, UV B; WBC, white blood cell.
In parallel, FACS experiment performed.
PB sample collected at the diagnostic stage.
EuroFlow-based immunophenotyping
EDTA-anticoagulated PB samples (n = 47) collected from patients with SS and HCs were freshly (<4 hours) processed and stained with 3 complementary EuroFlow antibody panels: lymphoid screening tube (LST), T-cell chronic lymphoproliferative disorder (T-CLPD, tube 1), and immune monitoring CD4+ T-cell tubes, composed of 27 different markers. (Panel information is detailed in supplemental Table 1, available on the Blood Web site, and was previously published.29,31) Instrumental setup and calibration, sample preparation, immunostaining, and data acquisition were performed according to EuroFlow standardized operating protocols.30 Per sample, ≥1.5 × 10⁵ events were measured on a BD FACSCanto II 3-Laser (LST, T-CLPD) and BD LSR-Fortessa X-20 4-Laser (immune monitoring CD4+ T cell) using FACSDiva software (BD Biosciences, San Jose, CA) at the Flow Cytometry Core Facility (Leiden University Medical Center, Leiden, The Netherlands; https://www.lumc.nl/research/facilities/fcf). Absolute cell counts were assessed in 31 of 47 PB samples using PerfectCount Beads (Cytognos SL, Salamanca, Spain) and following the manufacturer’s instructions. The Infinicyt software (Cytognos SL) was employed for MFC data analysis using the approaches and innovative tools that were previously described in detail.29,30
Statistical analysis of immunophenotypic data
Reference values (ie, percent of leukocytes and absolute counts/µL) were established for all leukocyte (sub)populations in PB and, in particular, for the CD4+ T-cell population (stratified in ≥86 subsets) based on 10 PB samples from HCs. Mann-Whitney U test was applied for the statistical comparison between cell populations of SS and HCs. Bland-Altman’s32 and linear regression analyses computed the concordance between conventional and EuroFlow-based gating strategies for Sézary cell measurements. Statistical analyses were carried out using GraphPad Prism Viewer 8.4.2 software applying a significance level of P < .05.
FACS and bulk RNA-seq of sorted CD4+ T-cell subsets
Additional PB samples were obtained from 3 patients with SS and 3 age- and sex-matched HCs for FACS. CD4+ T cells (≥15 × 106) or peripheral mononuclear cells (≥40 × 106; separated by Ficoll density gradient centrifugation) were stained with anti–human monoclonal antibodies: CD45-OC515 (Cytognos SL), CD3-APC, CD4-APCH7, CD2-BV650, CD26-BV605, CD7-FITC, CD183-PE, CD196-PECF594, CCR10-PerCPCy5.5 (BD Biosciences), CD28-BV421, and CD194-PECy7 (BioLegend, San Diego, CA) (supplemental Table 1). FACS procedure was conducted on an Aria-III cell sorter (BD Biosciences). FACS subsets (purity >95%) included Sézary CD4+ T-cell subsets (n = 6) from 3 patients with SS, phenotypically corresponding normal CD4+ T-cell subsets from the same patients (n = 3), and 3 HCs (n = 6) (supplemental Table 2). Subsequently, sorted cells were subjected to RNA isolation (<24 hours) using RNeasy Mini Kit (Qiagen, Hilden, Germany).
RNA-seq
Bulk RNA-seq was carried out by GenomeScan (Leiden, The Netherlands), and data processing and analysis were executed as described in detail in supplemental Methods. In brief, a fragment analyzer determined sample quality and concentration. Libraries were prepared using the NEBNext Ultra II Directional RNA Library Prep Kit for Illumina (E7760S/L; New England Biolabs, Ipswich, MA). Subsequently, ribosomal RNA was depleted (rRNA Depletion Kit, E6310; New England Biolabs) followed by RNA fragmentation and conversion to cDNA. A concentration of 1.1 nM cDNA was used for paired-end sequencing on NovaSeq6000 (Illumina, San Diego, CA). The Illumina data analysis pipeline RTA3.4.4 and Bcl2fastq v2.20 was applied for image analysis, base calling, and initial quality assessment.
Information regarding the identification of differentially expressed genes (DEGs) and pathway analyses are given in supplemental Methods.
Results
EuroFlow and conventional FC strategies yield different Sézary cell counts
With the application of EuroFlow MFC on the initial 24 SS samples, an aberrant CD4+ T-cell population was detected in all cases (Table 2). The identification of the Sézary cell population was based on the aberrant expression of SS-related, T-cell antigens and/or the overexpression or asynchronous expression of CD4+ T-cell delineating markers (ie, considering the whole phenotypic profile).4,29 Additionally, multidimensional plots were used to distinguish immunophenotypic aberrancies from the normal CD4+ T-cell counterpart, based on the expression of all parameters per antibody panel (supplemental Figure 1). The signatures of immunophenotypic features are given for each SS case and were defined as aberrancies that were sufficiently discriminatory between neoplastic and normal CD4+ T cells and displayed by most (>50%) neoplastic cells (Table 2).
Characteristic immunophenotypes and levels of circulating Sézary cells
| EuroFlow-based gating strategy | Conventional gating strategies | |||||||||||
|---|---|---|---|---|---|---|---|---|---|---|---|---|
| SS case | Signature immunophenotype of dominant Sézary cell population | CD4+/ CD8+ T-cell ratio | Sézary cells, % of CD4+ T cells | CD4+CD26−, % of Sézary cells | CD4+CD7−, % of Sézary cells | Sézary counts, cells per µL | Sézary cells, % of lymphocytes | Sézary cells, % of leukocytes | CD4+CD26−, % of CD4+ T cells | CD4+CD26− counts, cells per µL | CD4+CD7−, % of CD4+ T cells | CD4+CD7− counts, cells per µL |
| 1 | CD3lo CD4lo CD2lo/− CD7− CD26lo/− FSChigh | 7.7 | 71.4 | 55.8 | 98.8 | NP | 47.9 | 6.12 | 42.4 | NP | 72.0 | NP |
| 2 | CD45lo CD3lo CD4lo CD5lo CD26− | 34.3 | 90.5 | 97.0 | 0.1 | NP | 79.6 | 33.65 | 94.8 | NP | 2.7 | NP |
| 3 | CD3bright CD5lo CD2lo/− CD26lo/− | 21.0 | 88.6 | 88.2 | 1.3 | NP | 74.0 | 16.79 | 76.4 | NP | 3.0 | NP |
| 4 | CD4lo CD7− CD26− | 9.9 | 54.1 | 88.3 | 98.0 | NP | 41.1 | 4.72 | 64.1 | NP | 64.4 | NP |
| 5 | CD3− CD5lo | 4.1 | 56.9 | 1.1 | 32.4 | NP | 39.2 | 2.07 | 8.4 | NP | 26.4 | NP |
| 6 | CD3lo CD2lo/− CD7lo/− CD26lo/− | 14.1 | 86.5 | 73.2 | 96.4 | NP | 79.4 | 35.12 | 65.5 | NP | 84.2 | NP |
| 7 | CD3lo CD2lo/− CD7lo/− CD26lo/− FSChigh | 10.1 | 90.9 | 92.3 | 40.6 | NP | 78.3 | 31.78 | 89.9 | NP | 38.3 | NP |
| 8* | CD3lo CD2lo CD7lo/− CD26− FSChigh | 10.6 | 37.5 | 97.2 | 61.1 | NP | 23.2 | 4.07 | 41.4 | NP | 28.9 | NP |
| 9 | CD3lo CD5lo CD26− FSChigh | 3.1 | 34.5 | 95.1 | 1.4 | 217.2 | 21.7 | 3.71 | 72.2 | 453.6 | 29.0 | 182.4 |
| 10* | CD3bright CD2lo/- CD7−CD26− FSChigh SCChigh | 23.6 | 79.1 | 98.1 | 97.5 | 1 391.1 | 67.2 | 7.60 | 88.6 | 1 558.7 | 77.3 | 1 359.0 |
| 11 | CD3lo CD2lo | 11.7 | 24.6 | 7.4 | 2.8 | NP | 13.5 | 3.41 | 1.4 | NP | 1.2 | NP |
| 12* | CD3lo CD4lo CD2lo CD26− | 6.5 | 36.8 | 93.4 | 12.1 | NP | 21.5 | 2.61 | 54.2 | NP | 12.9 | NP |
| 13* | CD7− CD26− | 9.1 | 91.8 | 98.4 | 99.7 | 3 154.4 | 75.9 | 21.06 | 96.2 | 3 305.7 | 94.0 | 3 229.8 |
| 14* | CD3lo CD4lo CD7lo/− CD26lo/− | 72.6 | 99.4 | 95.9 | 96.5 | 12 409.0 | 97.9 | 86.46 | 95.8 | 11 953.0 | 96.0 | 11 979.1 |
| 15 | CD7lo/− CD26lo/− | 194.5 | 99.5 | 95.4 | 99.9 | 1 998.4 | 90.8 | 16.17 | 94.2 | 1 892.9 | 99.6 | 2 001.3 |
| 16 | CD26− FSChigh | 4.0 | 87.5 | 99.7 | 1.3 | 2 730.3 | 65.5 | 21.12 | 94.3 | 2 942.6 | 1.8 | 55.5 |
| 17* | CD45lo CD4lo CD5bright CD2lo/− CD7lo/− CD26− | 14.6 | 90.5 | 97.8 | 7.1 | 1 702.8 | 73.0 | 20.29 | 92.1 | 1 732.1 | 9.9 | 186.7 |
| 18 | CD2lo/− CD7lo/− CD26lo/− | 30.2 | 99.0 | 97.9 | 13.2 | 10 113.0 | 94.1 | 60.47 | 96.6 | 9 874.1 | 13.6 | 1 394.4 |
| 19 | CD3lo CD4lo CD2lo/− CD7− CD26− | 1.1 | 6.3 | 100.0 | 100.0 | 8.2 | 2.1 | 0.15 | 14.1 | 18.4 | 20.8 | 27.2 |
| 20* | CD45lo CD3lo CD2lo/− CD7lo/−CD26lo/− FSChigh | 11.7 | 27.2 | 73.5 | 12.5 | 334.4 | 21.8 | 4.91 | 31.8 | 390.6 | 9.7 | 119.5 |
| 21 | CD45lo CD3lo CD7lo/− CD26− | 40.3 | 91.8 | 99.5 | 69.1 | 8 403.7 | 82.9 | 57.94 | 94.3 | 8 624.5 | 69.9 | 5 942.3 |
| 22 | CD45lo CD3lo CD2lo/− CD7− CD26− FSChigh SCChigh | 13.6 | 52.0 | 92.3 | 95.7 | 288.6 | 35.6 | 2.10 | 53.8 | 298.5 | 51.9 | 287.7 |
| 23* | CD3bright CD4lo CD2lo/− CD7− CD26− FSChigh SCChigh | 7.2 | 76.3 | 99.5 | 92.0 | 378.7 | 52.7 | 3.07 | 80.6 | 399.8 | 75.3 | 373.8 |
| 24 | CD3lo CD2lo/− CD7lo/− CD26lo/− | 7.7 | 48.6 | 90.0 | 93.8 | 764.0 | 36.5 | 6.73 | 59.3 | 932.7 | 47.9 | 754.2 |
The signature immunophenotypic profile is defined by markers that showed significant aberrancies and were essential for Sézary cell identification (LST, T-CLPD panels). Markers with minor shifts in mean fluorescence intensity on Sézary cell populations compared with normal CD4+ T cells and that were redundant or not sufficiently informative for the distinction between these populations are not mentioned. Sézary cell percentages and counts (T-CLPD panel) are given as identified by EuroFlow or conventional gating strategies (CD4+CD26− or CD4+CD7−).
NP, not performed.
PB sample collected at the diagnostic stage.
In parallel, Sézary cell levels defined using EuroFlow-based strategy were compared with conventional gating strategies relying on the definition of Sézary cells as CD4+CD26− or CD4+CD7− T cells. This comparison yielded different tumor cell percentages and corresponding Sézary cell counts in most cases (Table 2). Of note, CD4+CD26− and CD4+CD7− gating strategies either over- or underestimated Sézary cell levels compared with EuroFlow-based strategy (Table 1; Figure 1). Bland-Altman’s analyses revealed moderate to low levels of agreement between both methods, most evidently at lower tumor percentages (Figure 1A-B). Corresponding linear regression analyses of Sézary cell measurements (as percentages of total CD4+ T cells) revealed a moderate (r2 = 0.70; P < .0001) to poor (r2 = 0.15; P = .06) association between EuroFlow-based and conventional gating strategies based on CD4+CD26− (Figure 1C) and CD4+CD7− (Figure 1D), respectively. In comparison, median values of CD4+CD26− and CD4+CD7− subsets in our cohort of HCs were calculated at 15.4% (range: 8.8-25.2) and 14.9% (range: 8.4-28.1) of total CD4+ T cells, respectively.

EuroFlow-based and conventional FC gating strategies yield different Sézary cell levels. Bland-Altman’s plots reveal the differences between Sézary cell percentages (of total CD4+ T cells) as calculated using conventional gating strategies (A; CD4+CD26− or B, CD4+CD7−) and EuroFlow approach (calculated percentages herein were based on the 8-color T-CLPD antibody panel). The difference (y-axis) between both methods is drawn against the average measures of both methods (x axis). The limits of agreement (dashed lines: mean difference ± 1.96 SD) are displayed. A y-value closer to 0 indicates a higher level of agreement. Compared with the CD4+CD26− approach, the calculated bias was −0.78, with a 16.9 standard deviation and 95% limits of agreement from −33.9 to 32.4. These differences decreased at higher tumor burden levels. Compared with the CD4+CD7− conventional method, Bland-Altman’s analysis calculated a considerable bias (−24.6) with 34.7 standard deviation and 95% limits of agreement from −92.6 to 43.4. Linear regression plots revealed an overall moderate (C) to poor (D) correlation between conventional and EuroFlow-based gating methods for assessing tumor burden in PB. Given are the slope plus standard error and r2, and the significance level is indicated.
EuroFlow-based and conventional FC gating strategies yield different Sézary cell levels. Bland-Altman’s plots reveal the differences between Sézary cell percentages (of total CD4+ T cells) as calculated using conventional gating strategies (A; CD4+CD26− or B, CD4+CD7−) and EuroFlow approach (calculated percentages herein were based on the 8-color T-CLPD antibody panel). The difference (y-axis) between both methods is drawn against the average measures of both methods (x axis). The limits of agreement (dashed lines: mean difference ± 1.96 SD) are displayed. A y-value closer to 0 indicates a higher level of agreement. Compared with the CD4+CD26− approach, the calculated bias was −0.78, with a 16.9 standard deviation and 95% limits of agreement from −33.9 to 32.4. These differences decreased at higher tumor burden levels. Compared with the CD4+CD7− conventional method, Bland-Altman’s analysis calculated a considerable bias (−24.6) with 34.7 standard deviation and 95% limits of agreement from −92.6 to 43.4. Linear regression plots revealed an overall moderate (C) to poor (D) correlation between conventional and EuroFlow-based gating methods for assessing tumor burden in PB. Given are the slope plus standard error and r2, and the significance level is indicated.
Sézary cells harbor remarkable inter- and intrapatient immunophenotypic heterogeneity
Comparative immunophenotypic analysis between Sézary cells and their normal CD4+ T-cell counterpart using EuroFlow-based MFC revealed substantial heterogeneity in the expression of different markers (Table 2; supplemental Figure 1). Overall, Sézary cells were characterized by diminished expression, measured as a decrease in median fluorescence intensity, of common lymphocyte antigen CD45 (5/24, 21%), T-cell lineage markers CD3 (15/24, 63%), CD4 (7/24, 29%), CD5 (4/24, 17%), CD2 (13/24, 54%), CD7 (13/24, 54%), and/or CD26 (22/24, 92%), the latter in combination with consistent positivity of CD28 costimulatory molecule. Of note, the percentage of Sézary cells per sample exhibiting loss of CD26 or CD7 antigen expression ranged from 1.13% to 100% and 0.05% to 100%, respectively. Additionally, Sézary cells had higher forward (9/24) and sideward (3/24) light scatter characteristics. Rare immunophenotypic findings included the increased expression of CD5 (1/24, 4%) or CD3 (3/24, 13%) and the complete loss of CD3 (1/24, 4%). Furthermore, the median fluorescence intensity of CD38 on Sézary cells was slightly decreased (n = 14) or increased (n = 2) as compared with normal CD4+ T cells. However, this marker harbored no sufficient discriminatory power in any of the cases (data not shown).
SS samples demonstrated a wide variety of possible immunophenotypic aberrancies (supplemental Figure 1). The most frequent immunophenotypic signature, CD3loCD4+CD2lo/−CD7lo/−CD26lo/−, was only seen in 4/24 cases (17%), reflecting interpatient immunophenotypic heterogeneity (Figure 2B). Moreover, within an individual sample, Sézary cells rarely represented a homogenous cell population with a fixed immunophenotypic aberrancy (Figure 2C). Instead, immunophenotypic features of individual samples were displayed among a variable percentage of neoplastic cells revealing intrapatient heterogeneity (Figure 2D). Of note, no particular immunophenotypic alterations could be associated with a specific type of treatment.

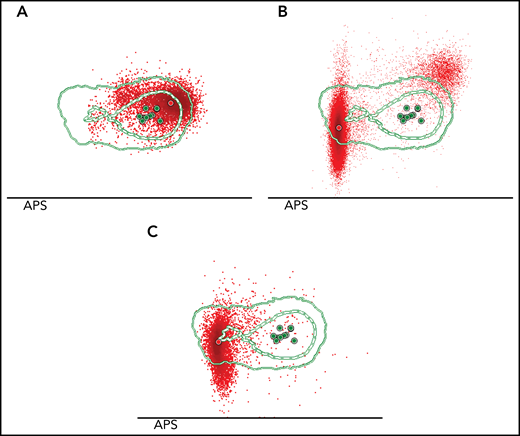
Sézary cells show heterogeneous phenotypes reflecting inter- and intrapatient diversity. (A) An automatic population separator (APS) plot based on all parameters included in the T-CLPD antibody panel showed the normal distribution of CD4+ T cells derived from 10 age- and sex-matched HCs (reference database). The green inner and outer lines represent, respectively, the first and second standard deviation of normal CD4+ T cells (green dots) and their corresponding population medians (larger green dots). (B) Phenotypically altered CD4+ T cells (red dots) from 24 patients with SS are depicted against the reference database and illustrate their heterogeneous and aberrant expression patterns compared with normal CD4+ T cells. Examples of 2 SS samples showing a tumor population with 1 homogeneous (C) or 2 immunophenotypically distinct (D) aberrancies.
Sézary cells show heterogeneous phenotypes reflecting inter- and intrapatient diversity. (A) An automatic population separator (APS) plot based on all parameters included in the T-CLPD antibody panel showed the normal distribution of CD4+ T cells derived from 10 age- and sex-matched HCs (reference database). The green inner and outer lines represent, respectively, the first and second standard deviation of normal CD4+ T cells (green dots) and their corresponding population medians (larger green dots). (B) Phenotypically altered CD4+ T cells (red dots) from 24 patients with SS are depicted against the reference database and illustrate their heterogeneous and aberrant expression patterns compared with normal CD4+ T cells. Examples of 2 SS samples showing a tumor population with 1 homogeneous (C) or 2 immunophenotypically distinct (D) aberrancies.
Likewise, the extent of inter- and intrapatient heterogeneity was further corroborated at the maturation and Th differentiation status. Accordingly, Sézary cells exhibited phenotypes corresponding with a wide range of Th differentiation subsets (Figure 3A; supplemental Figure 1). A Th2 phenotype was most regularly represented (21/24, 88%) and displayed on 2.19% to 85.31% of Sézary cells, followed by Th17 (12/24, 50%, displayed on 2.57% to 74.21%) and nonclassical Th phenotype CCR4+CCR10+ (12/24, 50%, displayed on 1.46% to 77.23%). Typically, Sézary cells were clustered as distinct populations with phenotypes matching predominantly 2 (46%; 11/24) or multiple (≥3 in 50%; 12/24) Th subsets at 1 single time-point measurement, thereby not considering small subsets (ie, displayed by <5% of Sézary cells). Notably, in line with previous studies, in most patients, Sézary cells highly expressed the skin-homing receptor CCR4 on variable but mostly high Sézary cell percentages, regardless of the concurrent and variable expression of other chemokine receptors.33-37
![Sézary cells exhibit a wide range of different Th and maturation phenotypes illustrative of inter- and intrapatient heterogeneity. (A) Reference data set of phenotypically defined classical and nonclassical Th subsets depicted in an APS plot based on the expression patterns of CD183, CD194, CD196, and CCR10 on (left) normal CD4+ T cells derived from 10 age- and sex-matched HCs with corresponding Th population medians (larger dots) and second standard deviation lines. To compare, 3 examples of samples from patients with SS, with Sézary cells (red) displaying phenotypes matching (from left to right) predominantly 1 (SS case 4; that of Th2 [77% of tumor cells]), 2 (SS case 1; CD194+CCR10+ [77%] and Th22 [20%]), or multiple (SS case 13; Th2 [60%], Th17 [21%], and Th22 [7%]) Th subsets at one single time-point measurement. (Right) Merged file of 24 SS initial samples exhibiting the aberrant and heterogeneous expression patterns of Sézary cells compared with the normal reference data set. Given are classical Th1 (CD183+), Th2 (CD194+), Th17 (CD194+CD196+), Th22 (CD194+CD196+CCR10+), Th1/Th17 (CD183+CD196+), and most common nonclassical CD194+CCR10+, CD183+CD194+, CD183+CD194+CD196+, CD183+CD194+CCR10+, and nonnaïve −CD183−CD194−CD196−CCR10− Th subsets. (B) An APS plot comparing the 5 main maturation stages of normally distributed CD4+ T-cell populations (2.0 standard deviation curve is shown) derived from 10 age- and sex-matched HCs with their corresponding medians (larger dots) for each maturation stage (left). Maturation stages were based on characteristic CD27, CD45RA, and CD62L expression patterns. Examples of 3 samples from patients with SS showing aberrant CD4+ T cells (small red dots) that exhibit predominantly (from left to right) (SS case 22) CM, (SS case 21) CM and TM, or (SS case 15) CM, TM, and PM phenotypes. (Right) All phenotypically aberrant CD4+ T cells from 24 samples from patients with SS merged into 1 file with their corresponding population medians (larger dots) of each patient sample. CM, central memory; N, naïve-like; PM, peripheral memory; TM, transitional memory.](https://ash.silverchair-cdn.com/ash/content_public/journal/blood/138/24/10.1182_blood.2021012286/5/m_bloodbld2021012286f3.png?Expires=1765895543&Signature=v~y7c9Q--tnGQFg2QCl4zSFO1ogJDaunAlhqV9abwYs8Kyzh4bhru4pNm6pjSF-VDmr0J6Sg58Is6GvLVG4~48R0V-ugfibJyl5~t8NXYbcxuiCS3yUdFjj1-MMnMH2KwTUkqah4iWWffbzlD7GGJbQVWpJp4vlVPj2VBARqIg9bStgFPvZ48kQgmUeb1NeRpCjdq0i82Gp1PRpgEQ4qbgo33vwJcLiqe~np~~ZNJ7I8vYd0Pd~-YUthcluaBRIm-xeY-lJ8ALF45ohQUN-QfdGIJe-t48PbYijxDUS4rFS-~MI9sP-pdIZtjTW1-EHOQvQNUlUMIZ8XoJ1Brddc8w__&Key-Pair-Id=APKAIE5G5CRDK6RD3PGA)
Sézary cells exhibit a wide range of different Th and maturation phenotypes illustrative of inter- and intrapatient heterogeneity. (A) Reference data set of phenotypically defined classical and nonclassical Th subsets depicted in an APS plot based on the expression patterns of CD183, CD194, CD196, and CCR10 on (left) normal CD4+ T cells derived from 10 age- and sex-matched HCs with corresponding Th population medians (larger dots) and second standard deviation lines. To compare, 3 examples of samples from patients with SS, with Sézary cells (red) displaying phenotypes matching (from left to right) predominantly 1 (SS case 4; that of Th2 [77% of tumor cells]), 2 (SS case 1; CD194+CCR10+ [77%] and Th22 [20%]), or multiple (SS case 13; Th2 [60%], Th17 [21%], and Th22 [7%]) Th subsets at one single time-point measurement. (Right) Merged file of 24 SS initial samples exhibiting the aberrant and heterogeneous expression patterns of Sézary cells compared with the normal reference data set. Given are classical Th1 (CD183+), Th2 (CD194+), Th17 (CD194+CD196+), Th22 (CD194+CD196+CCR10+), Th1/Th17 (CD183+CD196+), and most common nonclassical CD194+CCR10+, CD183+CD194+, CD183+CD194+CD196+, CD183+CD194+CCR10+, and nonnaïve −CD183−CD194−CD196−CCR10− Th subsets. (B) An APS plot comparing the 5 main maturation stages of normally distributed CD4+ T-cell populations (2.0 standard deviation curve is shown) derived from 10 age- and sex-matched HCs with their corresponding medians (larger dots) for each maturation stage (left). Maturation stages were based on characteristic CD27, CD45RA, and CD62L expression patterns. Examples of 3 samples from patients with SS showing aberrant CD4+ T cells (small red dots) that exhibit predominantly (from left to right) (SS case 22) CM, (SS case 21) CM and TM, or (SS case 15) CM, TM, and PM phenotypes. (Right) All phenotypically aberrant CD4+ T cells from 24 samples from patients with SS merged into 1 file with their corresponding population medians (larger dots) of each patient sample. CM, central memory; N, naïve-like; PM, peripheral memory; TM, transitional memory.
Sézary cells exhibit a wide range of different Th and maturation phenotypes illustrative of inter- and intrapatient heterogeneity. (A) Reference data set of phenotypically defined classical and nonclassical Th subsets depicted in an APS plot based on the expression patterns of CD183, CD194, CD196, and CCR10 on (left) normal CD4+ T cells derived from 10 age- and sex-matched HCs with corresponding Th population medians (larger dots) and second standard deviation lines. To compare, 3 examples of samples from patients with SS, with Sézary cells (red) displaying phenotypes matching (from left to right) predominantly 1 (SS case 4; that of Th2 [77% of tumor cells]), 2 (SS case 1; CD194+CCR10+ [77%] and Th22 [20%]), or multiple (SS case 13; Th2 [60%], Th17 [21%], and Th22 [7%]) Th subsets at one single time-point measurement. (Right) Merged file of 24 SS initial samples exhibiting the aberrant and heterogeneous expression patterns of Sézary cells compared with the normal reference data set. Given are classical Th1 (CD183+), Th2 (CD194+), Th17 (CD194+CD196+), Th22 (CD194+CD196+CCR10+), Th1/Th17 (CD183+CD196+), and most common nonclassical CD194+CCR10+, CD183+CD194+, CD183+CD194+CD196+, CD183+CD194+CCR10+, and nonnaïve −CD183−CD194−CD196−CCR10− Th subsets. (B) An APS plot comparing the 5 main maturation stages of normally distributed CD4+ T-cell populations (2.0 standard deviation curve is shown) derived from 10 age- and sex-matched HCs with their corresponding medians (larger dots) for each maturation stage (left). Maturation stages were based on characteristic CD27, CD45RA, and CD62L expression patterns. Examples of 3 samples from patients with SS showing aberrant CD4+ T cells (small red dots) that exhibit predominantly (from left to right) (SS case 22) CM, (SS case 21) CM and TM, or (SS case 15) CM, TM, and PM phenotypes. (Right) All phenotypically aberrant CD4+ T cells from 24 samples from patients with SS merged into 1 file with their corresponding population medians (larger dots) of each patient sample. CM, central memory; N, naïve-like; PM, peripheral memory; TM, transitional memory.
Subsequently, we defined the (corresponding) maturation stages of these functionally distinct Sézary cell subsets (Figure 3B; supplemental Figure 1). Overall, Sézary cells had a tendency toward the earlier stages of maturation, in particular, central memory (21/24, 88%) and naïve (15/24, 63%) phenotypes. However, all maturation stages, except terminally effector (TE), were represented and most samples were heterogeneous, containing Sézary cell clusters belonging to 2 (12/24, 50%) or multiple (ie, ≥3 in 6/24, 24%) maturation stages.
Immunophenotypic analysis reveals shifted distribution of immune cell populations in SS
We studied the distribution of circulating nontransformed leukocytes, which provided a detailed overview of the immunologic dynamics in the PB of patients with SS (Figure 4). The imbalanced immune homeostasis in SS was evidenced by significant reduction of absolute cell counts of CD8+ cytotoxic (P = .016), TCRαβ+ (P = .0001) and TCRγδ+CD4−CD8−/lo (P = .016) T cells, B cells (P = .042), and natural killer cells (P = .0073) in patients with SS compared with HCs (Figure 4A), whereas neutrophils (P < .0001) and monocyte plus dendritic cell (P = .0009) counts were significantly increased. Among normal residual CD4+ T cells, T follicular helper (TFH) (P = .0049) and Th1/Th17 (P = .0016) cells were significantly reduced in SS. Additionally, non-CD4+ T-cell population was shifted toward a TE maturation stage (P = .0090) (Figure 4B).

Distinct distribution of nontransformed leukocytes in PB of patients with SS and HCs. (A) Quantitation (absolute cell counts/µL) of whole blood innate and adaptive immune cell populations in SS initial samples (n = 14, for which absolute counts were assessed) and age- and sex-matched HCs (n = 10). (B) Relevant altered distribution (as % of given cell population on y-axis) of non-CD4+ and normal residual CD4+ T-cell subsets based on the data of initial SS samples (n = 24 for non-CD4+ and n = 21 for CD4+ T-cell subsets) compared with HC samples (n = 10). SS samples that contained <2% of normal residual CD4+ T cells (n = 3) were not included in the analysis due to decreased accuracy of cell subset classification. The medians (middle line) with corresponding 95% confidence intervals are given. Mann-Whitney U test was used for statistical analysis, and significance is noted as not significant (n.s.). *P < .05; **P < .01; ***P < .001; ****P < .0001. Treg, T regulatory cell.
Distinct distribution of nontransformed leukocytes in PB of patients with SS and HCs. (A) Quantitation (absolute cell counts/µL) of whole blood innate and adaptive immune cell populations in SS initial samples (n = 14, for which absolute counts were assessed) and age- and sex-matched HCs (n = 10). (B) Relevant altered distribution (as % of given cell population on y-axis) of non-CD4+ and normal residual CD4+ T-cell subsets based on the data of initial SS samples (n = 24 for non-CD4+ and n = 21 for CD4+ T-cell subsets) compared with HC samples (n = 10). SS samples that contained <2% of normal residual CD4+ T cells (n = 3) were not included in the analysis due to decreased accuracy of cell subset classification. The medians (middle line) with corresponding 95% confidence intervals are given. Mann-Whitney U test was used for statistical analysis, and significance is noted as not significant (n.s.). *P < .05; **P < .01; ***P < .001; ****P < .0001. Treg, T regulatory cell.
Immune monitoring by standardized MFC reveals tumor evolution
We explored immunophenotypic changes in time and thereby established the additional value of standardized MFC in immune monitoring of SS. Patients with SS were monitored for 36 months, during which time the clinical course varied considerably. Sequential PB sampling (n = 13) was performed in 8 patients with SS (median 1.5 follow-up samples, range 1-3). Four patients with SS maintained a stable disease course without clinical signs of progression and/or significant changes in therapy. In contrast, 4 other patients failed to respond to standard therapy (skin-directed therapy and prednisone) and presented with disease progression 7 to 23 months after the initial PB sample. Sézary cell phenotype remained relatively stable over time (n = 6, 46%) or revealed an evident phenotypic shift in either the expression of general Sézary identification markers and/or T-cell delineating markers (n = 7, 54%). Nonetheless, at least 1 major phenotypic aberrancy remained unaltered. Such a phenotypic shift is well illustrated by an SS case that was characterized by the clonal expansion of 2 phenotypically distinct T-cell populations, variably balanced throughout the course of the disease (Figure 5).
Sequential monitoring reveals shifts in Sézary cell immunophenotype correlated with disease progression. Three PB samples were collected at different disease stages from SS case 11. (A) The initial sample, isolated 6 months after diagnosis. MFC analysis showed 1 homogeneous tumor population characterized by the diminished expression of CD3 surface antigen. (B) The second PB sample was collected 16 months after diagnosis. At that time, the patient had experienced disease progression, and systemic treatment with CHOEP chemotherapy was initiated. Herein, the tumor population increased from 30% to 90% of the total CD4+ T-cell population, but this expansion was primarily based on the (dramatic) emergence of a novel Sézary cell tumor population characterized by a distinct immunophenotypic profile (CD3loCD4lo in combination with CD26negCD7negCD2lo) as compared with the preexisting tumor population, which was detectable but proportionally decreased over time. Treatment was insufficiently effective and was switched to mogamulizumab, a monoclonal antibody targeting CCR4. (C) At third sampling, 19 months after the first sample and now under treatment with mogamulizumab, the initial CD3lo tumor population was no longer detectable, and the newly emerged CD3loCD4lo tumor population was abundantly present compromising >90% of total CD4+ T cells.
Sequential monitoring reveals shifts in Sézary cell immunophenotype correlated with disease progression. Three PB samples were collected at different disease stages from SS case 11. (A) The initial sample, isolated 6 months after diagnosis. MFC analysis showed 1 homogeneous tumor population characterized by the diminished expression of CD3 surface antigen. (B) The second PB sample was collected 16 months after diagnosis. At that time, the patient had experienced disease progression, and systemic treatment with CHOEP chemotherapy was initiated. Herein, the tumor population increased from 30% to 90% of the total CD4+ T-cell population, but this expansion was primarily based on the (dramatic) emergence of a novel Sézary cell tumor population characterized by a distinct immunophenotypic profile (CD3loCD4lo in combination with CD26negCD7negCD2lo) as compared with the preexisting tumor population, which was detectable but proportionally decreased over time. Treatment was insufficiently effective and was switched to mogamulizumab, a monoclonal antibody targeting CCR4. (C) At third sampling, 19 months after the first sample and now under treatment with mogamulizumab, the initial CD3lo tumor population was no longer detectable, and the newly emerged CD3loCD4lo tumor population was abundantly present compromising >90% of total CD4+ T cells.
Gene expression analysis confirms the clonal origin of Sézary subsets
Detailed MFC analysis revealed that Sézary cells display extensive variation at the phenotypic level. Intrigued by these observations, we sought to explore the relationship between phenotypically distinct Sézary cell subsets at the gene expression level based on analyses of FACS immunophenotypically distinct CD4+ T-cell tumor subsets from patients with SS (n = 6) and the closest normal CD4+ T-cell counterparts from the same patients (n = 3) and 3 age- and sex-matched HCs (n = 6). For this purpose, a dedicated antibody panel was designed (supplemental Table 1).
We first verified that subsets that were isolated as Sézary cells based on their altered immunophenotype were clonal cells determined by their T-cell receptor (TR)–αβ repertoires (Figure 6), TRA-CDR3 and TRB-CDR3 sequences, using MiXCR software.38,39 By contrast, isolated normal CD4+ T-cell subsets from the same patient demonstrated a normal polyclonal repertoire of TR genes (supplemental Figures 2 and 3). The same approach proved that immunophenotypically distinct Sézary cell subsets, isolated from the same patient, shared the same TR rearrangement and were thus clonally related. Based on their unique TRA-CDR3 and TRB-CDR3 sequences, the rearrangement distribution was calculated for each sample. All Sézary tumor subsets harbored 1 dominant clone accounting for ≥98.6% of the total number of sequencing reads.
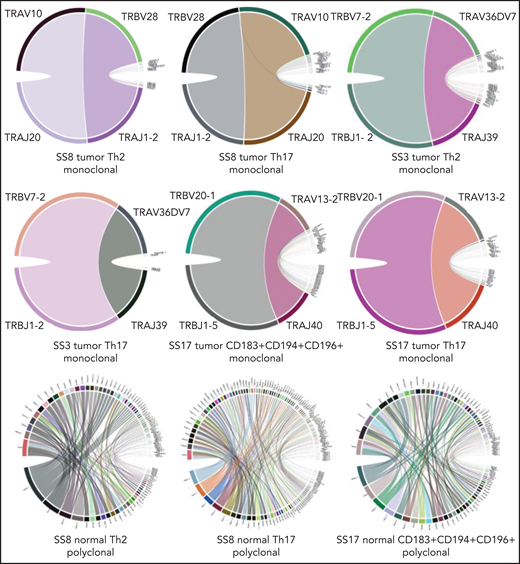
Circos plots confirming monoclonality of FACS Sézary tumor subsets given their monoclonal TRs of the α and β chains. By contrast, corresponding normal CD4+ T-cell subsets isolated from the same patients with SS revealed a typical polyclonal pattern. The extended figure of rearrangement patterns (circos plots), clonality distribution (pie charts), and sample information regarding TRA/TRB rearrangements and CDR3 sequences for all FACS CD4+ T-cell subsets are depicted in supplemental Figures 2 and 3 and supplemental Table 2, respectively.
Circos plots confirming monoclonality of FACS Sézary tumor subsets given their monoclonal TRs of the α and β chains. By contrast, corresponding normal CD4+ T-cell subsets isolated from the same patients with SS revealed a typical polyclonal pattern. The extended figure of rearrangement patterns (circos plots), clonality distribution (pie charts), and sample information regarding TRA/TRB rearrangements and CDR3 sequences for all FACS CD4+ T-cell subsets are depicted in supplemental Figures 2 and 3 and supplemental Table 2, respectively.
RNA-seq of purified Sézary cells reveals downregulated genes associated with TR function and development
Based on the RNA-seq data, we compared the global transcriptome of different FACS-purified subsets. Overall, a principal component analysis revealed the clustering of normal CD4+ T-cell subsets and the comparability between normal CD4+ T-cell populations from patients and HCs (Figure 7A). By contrast, a principal component analysis separated Sézary from normal CD4+ T-cell subsets, indicating considerable differences in the global transcriptomes of Sézary cells beyond functional properties alone. Immunophenotypically distinct Sézary subsets that were separately isolated from the same patient presented functional variation in between subsets, but the overall expression patterns were conserved across Sézary cell subsets, regardless of functional properties, given their display in close proximity.
![RNA-seq data reveal distinct transcriptional profiles of different FACS CD4+ T-cell populations and identify recurrent novel aberrancies. (A) Principal component (PC) analysis of the gene expression profiles displays clustering of normal FACS CD4+ T-cell populations regardless of donor (SS/HC, encircled in green) as opposed to Sézary subsets (encircled in red). (B) Heatmap (including log2CPM−2 to 10) shows that phenotypically functionally distinct CD4+ T-cell subsets (Th2 and Th17) derived from HCs harbor characteristic lineage-specifying gene expression profiles. This was most prominently observed in GATA3 and RORA/RORC genes that are known to prime naïve CD4+ T cells toward Th2 and Th17 functional subsets, respectively. To a less prominent extent, phenotypically distinct functional subsets isolated from the same patient with SS showed variation in the expression of lineage-specifying signature genes. (C) Volcano plot depicting the significantly DEGs in tumor populations from 3 patients with SS in comparison with phenotypically normal CD4+ T-cell populations from the same patients. Shown are log2 fold changes (FC) (x-axis) with selected genes highlighted. Dashed lines at −5 and 5 indicate the chosen log2FC cutoff values. (D) List of biological processes and corresponding significance [(−log10) adjusted P value] that are involved in SS based on gene ontology enrichment analysis conducted on the top up- and downregulated DEGs (log2FC ≥5, FDR <0.05) between tumor and normal subsets from patients with SS.](https://ash.silverchair-cdn.com/ash/content_public/journal/blood/138/24/10.1182_blood.2021012286/5/m_bloodbld2021012286f7.png?Expires=1765895543&Signature=diqsBK0TiR3AtfpD4XYwOnj7ZPThGW5j-mVB~ukMCxwgvv~f3vmErYQMDiDOMhRIiS-S1LQ10LRV5cl8YyK6OHkg3D1IOjKExMynb0yUHG3gNnJcWVMwVBIWX9NB2OoxFsri0CMlnPAkIUPEQ3IwOJk6p~ce4m6b3GI-kYkgx7G7HWX41KY9rPDi-xzHywYg54FgWFWx4~KSvjrAgnN2CBJgZ-~BtzkewAD94VuINYdknDjDDwPiyixwyOAYdSlNLOHvVHAuIhTzDbM3-VYFbP06f6xFX1e1fSSu5FNhHt5Qr2VrbY3Ni4kUHQ-vejx4n68cG9ZZ6JhJr-MOk9G2Ag__&Key-Pair-Id=APKAIE5G5CRDK6RD3PGA)
RNA-seq data reveal distinct transcriptional profiles of different FACS CD4+ T-cell populations and identify recurrent novel aberrancies. (A) Principal component (PC) analysis of the gene expression profiles displays clustering of normal FACS CD4+ T-cell populations regardless of donor (SS/HC, encircled in green) as opposed to Sézary subsets (encircled in red). (B) Heatmap (including log2CPM−2 to 10) shows that phenotypically functionally distinct CD4+ T-cell subsets (Th2 and Th17) derived from HCs harbor characteristic lineage-specifying gene expression profiles. This was most prominently observed in GATA3 and RORA/RORC genes that are known to prime naïve CD4+ T cells toward Th2 and Th17 functional subsets, respectively. To a less prominent extent, phenotypically distinct functional subsets isolated from the same patient with SS showed variation in the expression of lineage-specifying signature genes. (C) Volcano plot depicting the significantly DEGs in tumor populations from 3 patients with SS in comparison with phenotypically normal CD4+ T-cell populations from the same patients. Shown are log2 fold changes (FC) (x-axis) with selected genes highlighted. Dashed lines at −5 and 5 indicate the chosen log2FC cutoff values. (D) List of biological processes and corresponding significance [(−log10) adjusted P value] that are involved in SS based on gene ontology enrichment analysis conducted on the top up- and downregulated DEGs (log2FC ≥5, FDR <0.05) between tumor and normal subsets from patients with SS.
RNA-seq data reveal distinct transcriptional profiles of different FACS CD4+ T-cell populations and identify recurrent novel aberrancies. (A) Principal component (PC) analysis of the gene expression profiles displays clustering of normal FACS CD4+ T-cell populations regardless of donor (SS/HC, encircled in green) as opposed to Sézary subsets (encircled in red). (B) Heatmap (including log2CPM−2 to 10) shows that phenotypically functionally distinct CD4+ T-cell subsets (Th2 and Th17) derived from HCs harbor characteristic lineage-specifying gene expression profiles. This was most prominently observed in GATA3 and RORA/RORC genes that are known to prime naïve CD4+ T cells toward Th2 and Th17 functional subsets, respectively. To a less prominent extent, phenotypically distinct functional subsets isolated from the same patient with SS showed variation in the expression of lineage-specifying signature genes. (C) Volcano plot depicting the significantly DEGs in tumor populations from 3 patients with SS in comparison with phenotypically normal CD4+ T-cell populations from the same patients. Shown are log2 fold changes (FC) (x-axis) with selected genes highlighted. Dashed lines at −5 and 5 indicate the chosen log2FC cutoff values. (D) List of biological processes and corresponding significance [(−log10) adjusted P value] that are involved in SS based on gene ontology enrichment analysis conducted on the top up- and downregulated DEGs (log2FC ≥5, FDR <0.05) between tumor and normal subsets from patients with SS.
In addition, we confirmed phenotypically identified Th (functional) subsets by evaluating their corresponding lineage-specifying gene expression profiles (Figure 7B). Normal CD4+ T-cell subsets from HCs with a Th2 or Th17 phenotype expressed higher levels of GATA3 and RORA/RORC that are known to prime naïve CD4+ T cells toward Th2 and Th17 functional subsets, respectively. Likewise, Sézary subsets from the same patient showed different lineage-specifying profiles although they were less prominent compared with subsets from HCs.31,40
We identified 155 significant DEGs (avglog2FC ≥5; FDR <0.05), of which 98 genes were consistently downregulated and 57 were consistently upregulated in Sézary subsets, including multiple genes previously reported to be implicated in SS (Figure 7C; supplemental Table 3). In order of significance, DNM3OS, MET, GATA6, TWIST1, and DNM3 were upregulated and DPP4 (encoding for CD26) was downregulated, respectively.3,41-46 Overall, gene ontology enrichment analysis of these DEGs highlighted downregulated genes involved in adaptive immune response, whereas multiple cellular functions (including cell adhesion, migration, and signaling) were found among the upregulated genes (Figure 7D).47 Canonical pathway analysis through ingenuity pathway analysis identified 139 significant pathways (P < .05) based on DEGs (FDR <0.05; log2FC0−(−)5) (supplemental Figure 4).
Remarkably, the most significant DEG was THEMIS (thymocyte-expressed molecule involved in selection), an important regulator of thymocyte positive selection, which was specifically and consistently downregulated (log2FC = 10.4) in Sézary cells regardless of its phenotype. In line with this, another gene involved in the negative regulation of TR signaling, LAIR1, was significantly downregulated (log2FC = 6.1) in SS subsets. These results highlight a shared transcriptional profile associated with TR function in Sézary cells. We next sought to identify a core set of genes consistently and exclusively perturbed across Sézary cell subsets. Therefore, we computed the minimal fold change across tumor and normal subsets from patients with SS and HCs (supplemental Table 3). This approach corroborated that THEMIS has the absolute highest discriminatory power (minimal fold change >100) between Sézary and normal CD4+ T-cell subsets. Among others, LAIR1 and TMEM273 (minimal fold changes of 13.4 and 16.1, respectively) were included in the top 10 discriminatory DEGs.
Discussion
The heterogeneity of Sézary cells at the immunophenotypic level is increasingly acknowledged. Exploring heterogeneity is critical for the overall knowledge of SS pathogenesis, tumor evolution, and resistance to therapy. In turn, this is essential for the discovery of Sézary-specific targets and biomarkers that are potentially useful for diagnosis, treatment monitoring, and prognosis. Herein, we applied EuroFlow MFC technologies and tools to a large prospective cohort of patients with SS for highly sensitive and standardized identification, quantitation, and characterization of peripheral circulating Sézary cells and nontransformed leukocytes. Together with FACS and RNA-seq on purified Sézary and normal subsets, our in-depth analyses provided a thorough overview of the immunophenotypic and transcriptional profiles in SS.
Most of the debated topics and unresolved issues in the field of CTCL regard the definition and percentual limits for detection and quantitation of Sézary cells in PB (as diagnostic and treatment response criteria). In this study, we extensively demonstrated that conventional FC as currently used in clinical practice could either over- or underestimate tumor burden as compared with EuroFlow methodology. This is explained through the observation that fixed immunophenotypic aberrancies (CD4+CD26− and CD4+CD7−) were displayed by a variable percentage of neoplastic cells and the admixture of reactive and/or (functionally shifted) normal CD4+ T cells partly harboring similar phenotypes, respectively.48 Accordingly, a rational approach to differentiate Sézary cells should be initiated with the exclusion of normal cell populations in PB and the recognition of asynchronized and/or imbalanced representation of a particular cell population in the context of normal hematopoietic cell populations. Therefore, EuroFlow gating strategy focuses on the identification of aberrant cells based on the whole phenotypic parameters, which allowed for the detection of Sézary cells in all SS samples analyzed. Accordingly, in most cases (22/24, 92%), tumor cells demonstrated abnormal (usually dimmer vs normal counterpart) expression of markers other than the CD26−/lo and/or CD7−/lo, mainly involving a CD3lo, CD4lo, CD2−/lo, and, to a lesser extent, CD5lo and CD45lo profile, that clearly distinguished Sézary cells from normal/reactive CD4+ T cells. Nonetheless, Sézary cell identification remains challenging in some cases, and improvement can be reached by incorporating additional resolutive SS-specific markers.
Being intrigued by the extent of heterogeneity observed in SS and the need for additional SS-specific markers provided the rationale for a combined approach incorporating MFC and bulk RNA-seq transcriptomic analysis covering phenotypically distinct neoplastic (Sézary) and normal CD4+ T cells. Differently from other studies involving transcriptome profiling of SS samples,11,49,50 we sought to unravel heterogeneity not only between but also within patients and therefore included phenotypically distinct Sézary cell populations and, in parallel, isolated phenotypically related normal CD4+ T-cell subsets from the same patients with SS and HCs. Our gene expression data demonstrated that phenotypically distinct Sézary cell populations from the same patient are clonally related given their identical TRA- and TRB-CDR3 sequences. This observation suggests that in SS a common progenitor cell can mature and differentiate along the T-cell pathway and generate the outgrowth of phenotypically distinct tumor populations or is evidence for phenotypic plasticity of a matured T-cell clone. In support of these hypotheses, although the predominant immunophenotype of Sézary cells is central memory, all maturation stages (except TE) are observed in most patients. This is substantially different in mycosis fungoides, a CTCL type assumed to derive from skin-resident effector memory T cells.48
We discovered, among other findings, the transcriptional downregulation of THEMIS and LAIR1, which are involved in TR function.52,52 These genes were recently implied in the pathogenesis of adult T-cell leukemia-lymphoma, a lymphoma that is clinically closely related to SS.53 Further experiments will be required to functionally and biologically characterize these genes and address their potential as diagnostic, therapeutic, and/or prognostic biomarkers.
Sequential monitoring of PB by MFC was performed in 8 patients with SS and uncovered that Sézary cell immunophenotype is subject to changes because cell surface protein expression can be reversely acquired and lost during the disease course. These observations suggest that Sézary cells might be in continuous evolution and adaptation as a result of a spontaneous takeover of dominant subclone(s), possibly after (epi)genomic instability or reflect phenotypic plasticity, or they may also be in part due to therapies that differently target subclones, inducing the emergence of new or expansion of existing subclones that are resistant to therapy, thereby causing relapse.11 Therefore, FC measurements should be performed routinely to actively monitor early escape mechanisms that require adaptation in therapy regimens. A fully standardized methodology using EuroFlow-based MFC is thereby a prerequisite for making direct comparisons possible; in this sense, it should be emphasized that the presence of phenotypic changes during SS evolution is at odds with conventional FC approaches that define neoplastic cells based on immunophenotypic aberrancies of fixed markers. Additionally, the application of MFC goes beyond diagnostic and monitoring utility. Together with better characterization of patients’ biology, MFC analysis could be applied to select patients eligible for novel immunotherapeutic treatment strategies because their efficacy is likely to correlate with their targeted membrane expression on Sézary cells.
The altered levels of innate and adaptive circulating leukocytes in patients with SS provide evidence of the impaired immune homeostasis and contribute to an increased risk of opportunistic infections. Interestingly, the concurrent decrease in levels of circulating TFH and B cells hint at an impaired loop of humoral immunity because TFH cells play a critical role in the activation and differentiation of antigen-specific B cells into memory and plasma cells.54 Furthermore, the accumulation of TE T cells is possibly linked to the dysregulation of T-cell homeostasis. A better understanding of biological mechanisms underlying these shifts helps in selecting treatments that not only restore normal counts but also improve the normal distribution within immune cell populations in PB of patients with SS.
Our approach of integrating MFC, FACS, and RNA-seq provided important insights into inter- and intrapatient heterogeneity and helped obtain additional Sézary-specific markers that could prove its diagnostic and/or prognostic use in future research. We demonstrated the importance of using advanced standardized MFC to precisely detect neoplastic Sézary cells and robustly and reproducibly study immunophenotypic aberrancies measured at single time points and prospectively, which was otherwise impossible. We anticipate that the outcomes of this explorative study can form the basis for larger validation studies aiming to revise international diagnostic and treatment response FC criteria and improve diagnosis, monitoring, treatment, and prognosis in SS.
Acknowledgments
The authors thank the patients and healthy controls who participated in the study. The authors gratefully acknowledge the Flow Cytometry Core Facility (FCF) of Leiden University Medical Center, Leiden, The Netherlands (https://www.lumc.nl/research/facilities/fcf), coordinated by K. Schepers and M. Hameetman and run by the FCF operators E. F. E. de Haas, J. P. Jansen, D. M. Lowie, S. van de Pas, and G. I. J. Reyneveld (Directors: F. J. T. Staal and J. J. M. van Dongen) for technical support and cell-sorting assistance. The authors thank I. Z. M. Kreuger and W. Phan from the Department of Dermatology, Leiden University Medical Center, Leiden, The Netherlands, for assisting in sequencing analyses.
This work was funded by Kyowa Kirin. This work was supported by the EuroFlow Consortium, which received support from the FP6-2004-LIFESCIHEALTH-5 program of the European Commission (grant LSHB-CT-2006-018708) as Specific Targeted Research Project. The EuroFlow Consortium is part of the European Scientific Foundation for Hemato-Oncology, a Scientific Working Group (SWG) of the European Hematology Association (EHA).
Authorship
Contribution: S.N., M.H.V., J.J.M.v.D., C.P.T., J.A., and A.O. conceived and designed the study; S.N., M.H.V., J.J.M.v.D., C.P.T., J.A., A.O., and T.v.H. participated in discussions and interpretation of the data and results; S.N. performed experiments and analyzed flow cytometry data; A.J.v.d.S.-G., C.T., J.J.O.-L., and W.H.Z. assisted with experiments or data analysis; H.M., D.C., and T.B.K. performed bioinformatic analysis; and the manuscript was written by S.N. and critically revised by all authors who agreed on the final version of the manuscript.
Conflict-of-interest disclosure: The authors declare no competing financial interests.
Correspondence: Safa Najidh, Department of Dermatology, Leiden University Medical Center, 2333 ZA Leiden, The Netherlands; e-mail: s.najidh@lumc.nl.
The RNA-seq data reported in this article have been deposited in the European Genome-Phenome Archive (accession number EGAS00001005229).
The online version of this article contains a data supplement.
There is a Blood Commentary on this article in this issue.
The publication costs of this article were defrayed in part by page charge payment. Therefore, and solely to indicate this fact, this article is hereby marked “advertisement” in accordance with 18 USC section 1734.

This feature is available to Subscribers Only
Sign In or Create an Account Close Modal