

Key Points
STAT5B but not STAT5A drives self-renewal in hematopoietic (HSCs) and leukemic stem cells (LSCs).
STAT5B-induced self-renewal in LSCs can be blocked by interfering with its downstream target CD9.

Abstract
The transcription factors signal transducer and activator of transcription 5A (STAT5A) and STAT5B are critical in hematopoiesis and leukemia. They are widely believed to have redundant functions, but we describe a unique role for STAT5B in driving the self-renewal of hematopoietic and leukemic stem cells (HSCs/LSCs). We find STAT5B to be specifically activated in HSCs and LSCs, where it induces many genes associated with quiescence and self-renewal, including the surface marker CD9. Levels of CD9 represent a prognostic marker for patients with STAT5-driven leukemia, and our findings suggest that anti-CD9 antibodies may be useful in their treatment to target and eliminate LSCs. We show that it is vital to consider STAT5A and STAT5B as distinct entities in normal and malignant hematopoiesis.
Introduction
The term signal transducer and activator of transcription 5 (STAT5) defines 2 distinct genes: STAT5A and STAT5B. Their collective role has been extensively studied in healthy and malignant hematopoiesis, but there have been few attempts to distinguish between STAT5A and STAT5B. The 2 transcription factors share more than 90% homology at the protein level, with differences mainly in the Src-homology 2 and transactivation domains, which are required for activation.1 STAT5B appears to be the dominant protein in lymphoid cells and BCR/ABL-driven leukemia,2-6 but this finding is usually accounted for by the higher levels of STAT5B in differentiated hematopoietic cells. The 2 proteins have similar levels in hematopoietic stem cells (HSCs),1 and the combined deletion of both STAT5 genes in murine and human HSCs shows their key role in regulating self-renewal and quiescence.7-10
Leukemic stem cells (LSCs) are able to self-renew and to cause relapse in hematopoietic malignancies, so their elimination represents a major therapeutic goal.11 Hematopoietic malignancies frequently display enhanced STAT5 signaling, initiated either by STAT5B gain-of-function (GOF) mutations12-18 or through upstream oncogenic kinases. In the LSC-dependent diseases chronic myeloid leukemia (CML), acute myeloid leukemia (AML), or myeloproliferative neoplasm (MPN), examples include BCR/ABLp210, FLT3-internal tandem duplications (FLT3-ITD), or JAK2V617F, where disease development requires STAT5 signaling.19-22 It remains enigmatic why STAT5B and not STAT5A is mutated and whether the oncogenes activate both.
The tetraspanin CD9 is expressed on HSCs and is a marker for enhanced repopulation capacity.23 Stem cell–maintaining thrombopoietin (TPO) signaling has been linked to elevated levels of CD9,24 and stem cells of B-lineage precursor acute lymphoblastic leukemia (BCP-ALL) and AML have higher levels of CD9 than HSCs.25-28 CD9-high AML LSCs represent a subgroup of cells with the potential to promote tumor growth and to reconstitute human AML in immunocompromised mice.29 CD9 has been suggested to be a negative prognostic marker in pediatric BCP-ALL,30 and it is associated with poor complete remission.27 Conflicting results have been reported for AML,26,31 highlighting the importance of understanding the role of CD9 in leukemia.
We now show that STAT5A and STAT5B have different functions in both HSCs and LSCs and emphasize the importance of distinguishing between the two. STAT5B alone can regulate self-renewal and quiescence. Using single cell RNA-Seq, we defined a STAT5B-specific stem cell signature and identified CD9 as a STAT5B target linked to self-renewal. We also show that CD9 is a marker for an unfavorable prognosis in FLT3-ITD+ leukemia. Blocking the elevated CD9 levels in STAT5-driven LSCs (FLT3-ITD+, BCR-ABLp210+, and JAK2V617F+) induces cell death and differentiation while sparing HSCs. We show that the STAT5B–CD9 axis regulates self-renewal in LSCs suggesting novel therapeutic opportunities and provide an explanation for the prevalence of STAT5B GOF mutations in hematopoietic diseases.
Methods
All critical materials and resources are listed in supplemental Table 1, available on the Blood Web site.
Primary patient-derived samples
Data of bone marrow (BM) sample donors are listed in supplemental Table 2. All patients provided written informed consent. Biobanking and studies on patient samples were approved by the Ethics Committee of the Medical University of Vienna (034/2008 and 1184/2014).
Mice
Stat5a−/−,32Stat5b−/−,33 cS5Ahi,34 STAT5BN642H,12 JAK2V617F,35,36 vav1-Cre,37 C57BL/6N, Ly5.1+ [B6.SJL-Ptprca], and NSG mice (NOD.Cg-Prkdcscid Il2rgtm1Wjl/SzJ; The Jackson Laboratory) were bred and maintained under pathogen-free conditions at the Institute of Pharmacology and Toxicology, University of Veterinary Medicine Vienna, Vienna, Austria. NOG-F mice (NOD.Cg-Prkdcscid Il2rgtm1Sug/JicTac) were purchased from Taconic Biosciences. All animal experiments were conducted in 6- to 10-week-old mice. All procedures were approved by the institutional ethics and animal welfare committee and the national authority according to §§26ff. of the Animal Experiment Act, Tierversuchsgesetz 2012-TVG 2012 (BMBWF-68.205/0106-V/3b/2019; GZ BMWF-68.205/0093-WF/V/3b/2015 [Amendment BMBWF-68.205/0091-V/3b/2019]; GZ BMWF-68.205/0103-WF/V/3b/2015; and GZ 68.205/0174-V/3b/2018 [Amendment: 2020-0.050.677]).
CD9 blocking experiments: patient samples
Patient-derived BM mononuclear cells were treated with 2 µg/mL CD9 blocking antibody (aCD9) or immunoglobulin G (IgG) antibodies in liquid culture or serial colony formation assays. A detailed description can be found in the supplemental Methods.
Statistics
The appropriate statistical method was used based on testing for normal distribution and homogeneity of variance. Tests were performed using GraphPad Prism. The statistical test is indicated in the corresponding figure legend.
Results
Unlike STAT5A, STAT5B is important for the dormancy of HSCs
We used mice lacking Stat5a32 or Stat5b33 to investigate the roles of the individual STAT5 proteins. Although BM cellularity and LSK (Lin−, Sca-1+, c-kit+) cell numbers remain unaffected by comparing the deletion of either gene, HSCs (containing the most dormant and long-term HSCs) and multipotent progenitor (MPP) 1 and 5 cells (more cycling and myeloid/lymphoid prone)38,39 are significantly reduced in Stat5b−/− mice (Figure 1A-B; supplemental Figure 1A-C). Levels of STAT5A are unaltered in the absence of STAT5B in HSCs and vice versa, showing that there are no compensatory regulatory mechanisms (supplemental Figure 1D).
![STAT5B, but not STAT5A, has an important role in HSC dormancy. (A-B) HSC flow cytometry analyses of wt, Stat5a−/−, or Stat5b−/− BM. (A) Representative FACS plots showing HSC/multipotent progenitor (MPP)1 (CD150+CD48−), MPP2 (CD150+CD48+), MPP3/4 (CD150−CD48+), and MPP5 (CD150−CD48−) cell populations gated on LSK cells. (B) Relative quantification of HSC, MPP1-5, and LSK cells (n ≥ 6; mean ± standard error of the mean [SEM]). HSC subpopulations: HSC (LSK, CD34−CD48−CD150+CD135−), MPP1 (LSK, CD34+CD48−CD150+CD135−), MPP2 (LSK, CD34+CD48+CD150+CD135−), MPP3 (LSK, CD34+CD48+CD150−CD135−), and MPP4 (LSK, CD34+CD48+CD150−CD135+). (C-F) Single cell RNA-Seq of FACS-sorted LSK cells of WT, Stat5a−/−, or Stat5b−/− BM (n = 3 pooled/genotype). (C) Experimental workflow. (D) Force-directed graphs of WT, Stat5a−/−, or Stat5b−/− LSKs, color code as shown in supplemental Figure 1C. (E) Changes in HSC_1 and HSC_2 cluster sizes of Stat5a−/− or Stat5b−/− relative to WT. (F) Absolute differences in the percentage of cells expressing known genes associated with dormant HSCs39,41-43 in pooled clusters HSC_1 and HSC_2 of Stat5a−/− or Stat5b−/− compared with WT. (G-H) HSC cell cycle analyses of WT, Stat5a−/−, or Stat5b−/− BM. (G) Representative FACS plots (KI67/DAPI) of HSC/MPP1 with gating strategy and indicated percentages, and (H) quantification of cell cycle phase distributions of HSC/MPP1 cells (n = 5; mean ± SEM). Levels of significance were calculated using 1-way analysis of variance (ANOVA) (B,H). *P < .05; **P < .01; ***P < .001.](https://ash.silverchair-cdn.com/ash/content_public/journal/blood/138/23/10.1182_blood.2021010980/3/m_bloodbld2021010980f1.png?Expires=1767705740&Signature=jAb4XHk9hBQFIA4rB~RSR5zBH2UHj8NXNBbvIxFJNHIIA1NxL~-wnFep3figMTGIkvaSYqvhx2xXAFEXt2Mdwn4CeehNbW07cOqjlAyt~hajQJbLR9kQF7MNacb3UuEQJYYJYFjOYSgUVc17iRZOgQZ4RPooEKsjG4hzgNOGhHs4WGtCwjNtAqXWTWEnkNxO4BilAeNncmILNFs8Z3mrct3OzC5YHiZ1WHOU-2CkRS1pEdRArrp485KvQ3EjQm1z6CTRpEPJdWApX3G5elVF77Min68R0P2aj2ktmvSmP5exAwsh6c3gOG7LPy1AAULHiuhj9lHjgfrXz-jgIYAPYw__&Key-Pair-Id=APKAIE5G5CRDK6RD3PGA)
STAT5B, but not STAT5A, has an important role in HSC dormancy. (A-B) HSC flow cytometry analyses of wt, Stat5a−/−, or Stat5b−/− BM. (A) Representative FACS plots showing HSC/multipotent progenitor (MPP)1 (CD150+CD48−), MPP2 (CD150+CD48+), MPP3/4 (CD150−CD48+), and MPP5 (CD150−CD48−) cell populations gated on LSK cells. (B) Relative quantification of HSC, MPP1-5, and LSK cells (n ≥ 6; mean ± standard error of the mean [SEM]). HSC subpopulations: HSC (LSK, CD34−CD48−CD150+CD135−), MPP1 (LSK, CD34+CD48−CD150+CD135−), MPP2 (LSK, CD34+CD48+CD150+CD135−), MPP3 (LSK, CD34+CD48+CD150−CD135−), and MPP4 (LSK, CD34+CD48+CD150−CD135+). (C-F) Single cell RNA-Seq of FACS-sorted LSK cells of WT, Stat5a−/−, or Stat5b−/− BM (n = 3 pooled/genotype). (C) Experimental workflow. (D) Force-directed graphs of WT, Stat5a−/−, or Stat5b−/− LSKs, color code as shown in supplemental Figure 1C. (E) Changes in HSC_1 and HSC_2 cluster sizes of Stat5a−/− or Stat5b−/− relative to WT. (F) Absolute differences in the percentage of cells expressing known genes associated with dormant HSCs39,41-43 in pooled clusters HSC_1 and HSC_2 of Stat5a−/− or Stat5b−/− compared with WT. (G-H) HSC cell cycle analyses of WT, Stat5a−/−, or Stat5b−/− BM. (G) Representative FACS plots (KI67/DAPI) of HSC/MPP1 with gating strategy and indicated percentages, and (H) quantification of cell cycle phase distributions of HSC/MPP1 cells (n = 5; mean ± SEM). Levels of significance were calculated using 1-way analysis of variance (ANOVA) (B,H). *P < .05; **P < .01; ***P < .001.
STAT5B, but not STAT5A, has an important role in HSC dormancy. (A-B) HSC flow cytometry analyses of wt, Stat5a−/−, or Stat5b−/− BM. (A) Representative FACS plots showing HSC/multipotent progenitor (MPP)1 (CD150+CD48−), MPP2 (CD150+CD48+), MPP3/4 (CD150−CD48+), and MPP5 (CD150−CD48−) cell populations gated on LSK cells. (B) Relative quantification of HSC, MPP1-5, and LSK cells (n ≥ 6; mean ± standard error of the mean [SEM]). HSC subpopulations: HSC (LSK, CD34−CD48−CD150+CD135−), MPP1 (LSK, CD34+CD48−CD150+CD135−), MPP2 (LSK, CD34+CD48+CD150+CD135−), MPP3 (LSK, CD34+CD48+CD150−CD135−), and MPP4 (LSK, CD34+CD48+CD150−CD135+). (C-F) Single cell RNA-Seq of FACS-sorted LSK cells of WT, Stat5a−/−, or Stat5b−/− BM (n = 3 pooled/genotype). (C) Experimental workflow. (D) Force-directed graphs of WT, Stat5a−/−, or Stat5b−/− LSKs, color code as shown in supplemental Figure 1C. (E) Changes in HSC_1 and HSC_2 cluster sizes of Stat5a−/− or Stat5b−/− relative to WT. (F) Absolute differences in the percentage of cells expressing known genes associated with dormant HSCs39,41-43 in pooled clusters HSC_1 and HSC_2 of Stat5a−/− or Stat5b−/− compared with WT. (G-H) HSC cell cycle analyses of WT, Stat5a−/−, or Stat5b−/− BM. (G) Representative FACS plots (KI67/DAPI) of HSC/MPP1 with gating strategy and indicated percentages, and (H) quantification of cell cycle phase distributions of HSC/MPP1 cells (n = 5; mean ± SEM). Levels of significance were calculated using 1-way analysis of variance (ANOVA) (B,H). *P < .05; **P < .01; ***P < .001.
To determine the individual effects of STAT5A and STAT5B on the transcriptional profiles of rare HSC subpopulations, we performed droplet-based single cell RNA-Seq (10× Genomics) of 30 000 fluorescence-activated cell sorter (FACS)-sorted LSK cells from wild-type (WT), Stat5a−/−, and Stat5b−/− mice (Figure 1C). A Louvain clustering analysis of the integrated data from all cells identified 15 distinct clusters. We used differential gene expression analysis to define marker genes for each cluster and annotated the clusters for distinct types of hematopoietic progenitor cells by manual review of marker genes39-42 (Figure 1D; supplemental Figure 1E-G; supplemental Table 3). We validated our clustering analyses by means of label transfer from an independent dataset.43 A total of 90.6% of our cells were classified as LSK cells, and the cluster annotations were confirmed (supplemental Figure 1H-I).
The HSC_1 and HSC_2 clusters are defined by gene signatures reminiscent of the expression profiles of dormant HSCs (Figure S1J). These clusters are smaller in Stat5b−/− mice compared with the other genotypes (Figure 1D-E). The single cell RNA-Seq data reflect the flow cytometry analysis, confirming that the most dormant HSCs are drastically reduced in Stat5b−/− mice. In addition to HSC genes known to be regulated by STAT5 (Mpl, Cited2, etc),44 we found that genes39-42 and gene sets45 marking dormant HSCs are expressed less in Stat5b−/− HSCs (but not in Stat5a−/−: some of them were even higher expressed in Stat5a−/− HSCs; Figure 1F; supplemental Figure 1K).
Consistent with reduced numbers of dormant stem cells, Stat5b−/− HSC_1 and HSC_2 clusters show elevated S and G2M molecular cell cycle scores (supplemental Figure 1L). The elevated cell cycle activity is recapitulated ex vivo in Stat5b-deficient HSCs (Figure 1G-H). The data indicate that Stat5a and Stat5b have nonredundant functions in HSC dormancy.
STAT5B drives HSC self-renewal
We next investigated the functional consequences of the alterations in Stat5b-deficient HSCs. FACS-sorted Stat5b−/− LSK cells proliferate significantly slower than WT and Stat5a−/− LSK cells and start to exhaust within 15 days (supplemental Figure 2A). Single cell assays of HSCs recapitulated the findings: Stat5b−/− cells have a drastically reduced potential for clonal outgrowth and LSK cell expansion (Figure 2A-B; supplemental Figure 2B). Replating assays confirmed the diminished self-renewal potential of Stat5b-deficient BM cells (supplemental Figure 2C). Conversely, retroviral overexpression of Stat5b but not of Stat5a in FACS-sorted LSK cells confers a growth advantage and allows the cells to retain the surface markers indicative of HSCs (Figure 2C; supplemental Figure 2D-E).
![STAT5B drives HSC self-renewal. (A-B) Single HSC assay using cell surface markers (lineage− [CD3, CD19, CD11b, Gr-1, Ter-119], c-kit+, Sca-1+, CD150+, CD48−). (A) Schematic of single cell in vitro cultures. Single HSC/MPP1 cells of WT, Stat5a−/−, or Stat5b−/− BM were FACS-sorted into individual wells and assessed for proliferation and surface marker expression after 10 days of culture. (Bi) Quantification of clonal outgrowth (n = 74/genotype). (Bii) Representative FACS plots of LSK gatings and quantification of total LSK cell numbers (n = 74/genotype, whiskers: Tukey). (C) STAT5A (STAT5A-green fluorescent protein [GFP]) or STAT5B (STAT5B-GFP) overexpression in LSK cells, EV (empty vector-GFP) was used as control. Competitive growth analyses over 28 days (n = 5/genotype, mean ± SEM). (D-F) 5-FU recovery assays of WT, Stat5a−/−, or Stat5b−/− mice. (D) Experimental workflow. (EF) Representative FACS plots of LSK gatings of lineage negative BM cells (E) and quantification of LSK cells and HSC/MPP1 cells 8 days after 5-FU injection (n ≥ 5/genotype, mean ± SEM). (G-I) Serial transplantation assays of WT, Stat5a−/−, or Stat5b−/− BM cells (F). (G) Experimental workflow: 5 × 10⁶ BM cells (Ly5.2+) were injected into lethally irradiated recipient mice (Ly5.1+) and reinjected 8 weeks after. TP (transplantation). (H) Representative LSK gatings of lineage negative BM cells 8 weeks after first and fourth transplantation. (I) Quantification of WT, Stat5a−/−, and Stat5b−/− LSK and HSC/MPP1 cells 8 weeks after fourth transplantation (n ≥ 6/genotype, mean ± SEM). Levels of significance were calculated using Fisher’s exact test (Bi) or 1-way ANOVA (Bii,F,I) or 2-way ANOVA (C). *P < .05; **P < .01; ****P < .0001.](https://ash.silverchair-cdn.com/ash/content_public/journal/blood/138/23/10.1182_blood.2021010980/3/m_bloodbld2021010980f2.png?Expires=1767705740&Signature=3SB0-4ZV670wBPSsC8IfCnUHuhk5FuvCMrdNHiCGO66ORbVuK371uwnhc032xzumkQjbesRC~-1iTt69hq0ym4NRozL-f40WZRA2PmK2Zdz0lH3HvWxR1WZcJ~k30Ma3Q9XavV7syvMa-vfFquP-AkL-v58RfuW8C7VVzG5GdINSW01emYCesA8QgRoddpPauA9zBdBvB33menkCctAOb5wPMtHDpXk3KbzB2dKjjd1iD49RhjcLS4~Vd8Mos5OU2yv9TmuSP~wtdqoGCnyArDB9ZLgMUnUWG6Jjo-g47oI9He6neKox8ENgRCE7EKOZ4SV8uSPCMjT07GHNOdgzBQ__&Key-Pair-Id=APKAIE5G5CRDK6RD3PGA)
STAT5B drives HSC self-renewal. (A-B) Single HSC assay using cell surface markers (lineage− [CD3, CD19, CD11b, Gr-1, Ter-119], c-kit+, Sca-1+, CD150+, CD48−). (A) Schematic of single cell in vitro cultures. Single HSC/MPP1 cells of WT, Stat5a−/−, or Stat5b−/− BM were FACS-sorted into individual wells and assessed for proliferation and surface marker expression after 10 days of culture. (Bi) Quantification of clonal outgrowth (n = 74/genotype). (Bii) Representative FACS plots of LSK gatings and quantification of total LSK cell numbers (n = 74/genotype, whiskers: Tukey). (C) STAT5A (STAT5A-green fluorescent protein [GFP]) or STAT5B (STAT5B-GFP) overexpression in LSK cells, EV (empty vector-GFP) was used as control. Competitive growth analyses over 28 days (n = 5/genotype, mean ± SEM). (D-F) 5-FU recovery assays of WT, Stat5a−/−, or Stat5b−/− mice. (D) Experimental workflow. (EF) Representative FACS plots of LSK gatings of lineage negative BM cells (E) and quantification of LSK cells and HSC/MPP1 cells 8 days after 5-FU injection (n ≥ 5/genotype, mean ± SEM). (G-I) Serial transplantation assays of WT, Stat5a−/−, or Stat5b−/− BM cells (F). (G) Experimental workflow: 5 × 10⁶ BM cells (Ly5.2+) were injected into lethally irradiated recipient mice (Ly5.1+) and reinjected 8 weeks after. TP (transplantation). (H) Representative LSK gatings of lineage negative BM cells 8 weeks after first and fourth transplantation. (I) Quantification of WT, Stat5a−/−, and Stat5b−/− LSK and HSC/MPP1 cells 8 weeks after fourth transplantation (n ≥ 6/genotype, mean ± SEM). Levels of significance were calculated using Fisher’s exact test (Bi) or 1-way ANOVA (Bii,F,I) or 2-way ANOVA (C). *P < .05; **P < .01; ****P < .0001.
STAT5B drives HSC self-renewal. (A-B) Single HSC assay using cell surface markers (lineage− [CD3, CD19, CD11b, Gr-1, Ter-119], c-kit+, Sca-1+, CD150+, CD48−). (A) Schematic of single cell in vitro cultures. Single HSC/MPP1 cells of WT, Stat5a−/−, or Stat5b−/− BM were FACS-sorted into individual wells and assessed for proliferation and surface marker expression after 10 days of culture. (Bi) Quantification of clonal outgrowth (n = 74/genotype). (Bii) Representative FACS plots of LSK gatings and quantification of total LSK cell numbers (n = 74/genotype, whiskers: Tukey). (C) STAT5A (STAT5A-green fluorescent protein [GFP]) or STAT5B (STAT5B-GFP) overexpression in LSK cells, EV (empty vector-GFP) was used as control. Competitive growth analyses over 28 days (n = 5/genotype, mean ± SEM). (D-F) 5-FU recovery assays of WT, Stat5a−/−, or Stat5b−/− mice. (D) Experimental workflow. (EF) Representative FACS plots of LSK gatings of lineage negative BM cells (E) and quantification of LSK cells and HSC/MPP1 cells 8 days after 5-FU injection (n ≥ 5/genotype, mean ± SEM). (G-I) Serial transplantation assays of WT, Stat5a−/−, or Stat5b−/− BM cells (F). (G) Experimental workflow: 5 × 10⁶ BM cells (Ly5.2+) were injected into lethally irradiated recipient mice (Ly5.1+) and reinjected 8 weeks after. TP (transplantation). (H) Representative LSK gatings of lineage negative BM cells 8 weeks after first and fourth transplantation. (I) Quantification of WT, Stat5a−/−, and Stat5b−/− LSK and HSC/MPP1 cells 8 weeks after fourth transplantation (n ≥ 6/genotype, mean ± SEM). Levels of significance were calculated using Fisher’s exact test (Bi) or 1-way ANOVA (Bii,F,I) or 2-way ANOVA (C). *P < .05; **P < .01; ****P < .0001.
These findings are fully consistent with the results of in vivo experiments. Stat5b−/− mice exposed to the chemotherapeutic agent 5-fluoruracil (5-FU) react with a drastic reduction in HSCs and LSK cells compared with WT and Stat5a−/− mice (Figure 2D-F; supplemental Figure 2F). We also observed increased apoptosis and an enhanced entry to the cell cycle in Stat5b−/− HSCs (supplemental Figure 2G-I). Additional evidence for the unique role of STAT5B in stem cell self-renewal comes from serial BM transplantation assays (Figure 2G). We observed a significantly and gradually decreased repopulation of Stat5b−/− HSCs and LSK cells within 4 serial transplantations, whereas Stat5a−/− cells showed slightly enhanced numbers of HSCs and LSK cells without reaching statistical significance (Figure 2H-I; supplemental Figure 2J). The transplantation experiments exclude the possibility that the effects of Stat5b deletion are predominantly niche related, thereby confirming that STAT5B has an intrinsic role as the main driver of HSC self-renewal.
Selective STAT5B activation drives the self-renewal of HSCs
Several cytokines mandatory for the maintenance and self-renewal of HSCs, such as TPO,46,47 induce STAT5 activation by the JAK-dependent phosphorylation of STAT5A Y694 and/or STAT5B Y699 (pYSTAT5). Phosphorylation leads to STAT5 dimerization, nuclear translocation, and transcriptional activity.1 We found pYSTAT5 is highest in HSC/MPP1 cells and declining gradually in MPP2 and MPP3/4 cells (Figure 3A; supplemental Figure 3A). This pattern is reflected by the expression of prototypical STAT5 target genes such as Socs2 and Cish in an independent RNA-Seq dataset of FACS-sorted HSC subpopulations39 (supplemental Figure 3B). Our single cell RNA-Seq data reveal reduced expression of Socs2 and Cish in Stat5b−/− HSC_1 and HSC_2 clusters but unaltered levels in Stat5a−/− compared with WT (Figure 3B).
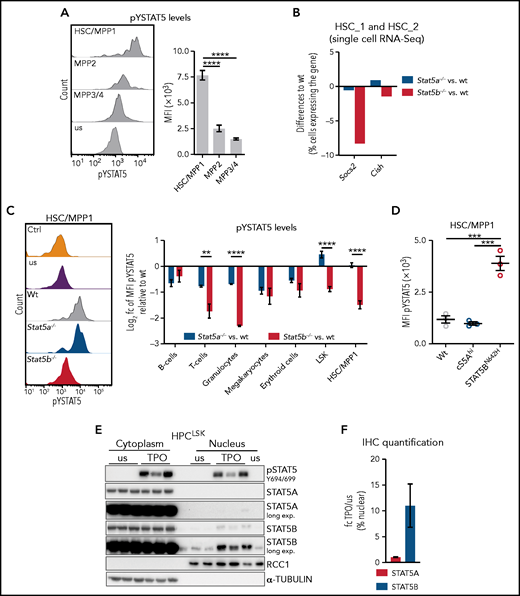
Selective STAT5B activation in HSCs drives self-renewal. (A) Flow cytometric analysis of pYSTAT5 levels in HSC subpopulations. Representative histograms of pYSTAT5 signal in WT HSC/MPP1, MPP2, and MPP3/4 20 minutes after TPO stimulation or unstimulated (us) (i) and the quantification of the MFI pYSTAT5 signal (n ≥ 5, mean ± SEM) (ii). (B) Quantification of cells expressing Socs2 or Cish in pooled HSC_1 and HSC_2 clusters (single cell RNA-Seq) of Stat5a−/− or Stat5b−/− relative to WT. (C) Flow cytometric analysis of pYSTAT5 levels in different cell types of WT, Stat5a−/−, and Stat5b−/− BM after respective stimulations for 20 minutes. (i) Representative histograms of pYSTAT5 signal of HSC/MPP1 cells after TPO stimulation; antibody isotype staining (Ctrl) and unstimulated (us) are shown as control. (ii) B220+ B and CD3+ T cells were stimulated with IL-7 and IL-2; Gr1+CD11b+ granulocytes were stimulated with GM-CSF; CD41+ megakaryocytes were stimulated with TPO; CD71+ erythroid cells were stimulated with EPO; and LSK cells and HSC/MPP1 cells were stimulated with TPO. Log2 pYSTAT5 levels of Stat5a−/− or Stat5b−/− relative to WT (n ≥ 4/genotype, mean ± SEM). (D) pYSTAT5 levels of HSCs derived from hyperactive STAT5A (cS5Ahi) or STAT5B (STAT5BN642H) transgenic mice (n = 3/genotype, mean ± SEM) determined by intracellular flow cytometry staining. (E) pSTAT5 (Y694/699), STAT5A, and STAT5B immunoblot analysis of cytoplasmic and nuclear fraction of unstimulated (us) or TPO-stimulated (20 minutes) HPCLSK WT cells (n = 3). α-TUBULIN served as loading control for the cytoplasmic fraction and RCC1 for the nuclear fraction. Representative blot of 3 independent experiments. (F) STAT5A or STAT5B IHC staining of HPCLSK WT cytospins with or without (us) 20-minute TPO stimulation. Quantification of 3 individual images per condition (1 representative cell line of 4) showing the fold change (fc) of TPO/us of percent nuclear STAT5A or STAT5B. Levels of significance were calculated using 1-way ANOVA (A,D), and using an unpaired Student t test (C). **P < .01; ***P < .001; ****P < .0001.
Selective STAT5B activation in HSCs drives self-renewal. (A) Flow cytometric analysis of pYSTAT5 levels in HSC subpopulations. Representative histograms of pYSTAT5 signal in WT HSC/MPP1, MPP2, and MPP3/4 20 minutes after TPO stimulation or unstimulated (us) (i) and the quantification of the MFI pYSTAT5 signal (n ≥ 5, mean ± SEM) (ii). (B) Quantification of cells expressing Socs2 or Cish in pooled HSC_1 and HSC_2 clusters (single cell RNA-Seq) of Stat5a−/− or Stat5b−/− relative to WT. (C) Flow cytometric analysis of pYSTAT5 levels in different cell types of WT, Stat5a−/−, and Stat5b−/− BM after respective stimulations for 20 minutes. (i) Representative histograms of pYSTAT5 signal of HSC/MPP1 cells after TPO stimulation; antibody isotype staining (Ctrl) and unstimulated (us) are shown as control. (ii) B220+ B and CD3+ T cells were stimulated with IL-7 and IL-2; Gr1+CD11b+ granulocytes were stimulated with GM-CSF; CD41+ megakaryocytes were stimulated with TPO; CD71+ erythroid cells were stimulated with EPO; and LSK cells and HSC/MPP1 cells were stimulated with TPO. Log2 pYSTAT5 levels of Stat5a−/− or Stat5b−/− relative to WT (n ≥ 4/genotype, mean ± SEM). (D) pYSTAT5 levels of HSCs derived from hyperactive STAT5A (cS5Ahi) or STAT5B (STAT5BN642H) transgenic mice (n = 3/genotype, mean ± SEM) determined by intracellular flow cytometry staining. (E) pSTAT5 (Y694/699), STAT5A, and STAT5B immunoblot analysis of cytoplasmic and nuclear fraction of unstimulated (us) or TPO-stimulated (20 minutes) HPCLSK WT cells (n = 3). α-TUBULIN served as loading control for the cytoplasmic fraction and RCC1 for the nuclear fraction. Representative blot of 3 independent experiments. (F) STAT5A or STAT5B IHC staining of HPCLSK WT cytospins with or without (us) 20-minute TPO stimulation. Quantification of 3 individual images per condition (1 representative cell line of 4) showing the fold change (fc) of TPO/us of percent nuclear STAT5A or STAT5B. Levels of significance were calculated using 1-way ANOVA (A,D), and using an unpaired Student t test (C). **P < .01; ***P < .001; ****P < .0001.
The findings indicate a reduced level of pYSTAT5 signaling in the absence of STAT5B and its predominant activation in HSCs. This prompted us to investigate STAT5A- or STAT5B-specific activation in various hematopoietic cell types. To overcome the lack of antibodies specific for tyrosine phosphorylated STAT5A or STAT5B, we used intracellular flow cytometry to determine the levels of pYSTAT5 in WT, Stat5a−/− and Stat5b−/− BM cells on cytokine stimulation. pYSTAT5 levels are decreased in differentiated lymphoid and myeloid cells in the absence of STAT5A or STAT5B, implying that both proteins are tyrosine phosphorylated. In contrast, the levels of pYSTAT5 in HSC/MPP1 and LSK cells are significantly reduced only in the absence of Stat5b, indicating that predominantly STAT5B is activated (Figure 3C). Transgenic mice with a hyperactive STAT5AS710F (cS5Ahi) or STAT5BN642H mutation give comparable results: elevated pYSTAT5 levels are prominent in HSCs expressing STAT5BN642H but not in HSCs with hyperactive STAT5A (Figure 3D). This finding is accompanied by significantly increased numbers of HSC/MPP1 cells in STAT5BN642H mice, consistent with previous work,12 whereas the number of HSC/MPP1 cells in cS5Ahi mice remains unaltered (supplemental Figure 3C).
To explore the HSC phenotype in more detail, we made use of a novel stem/progenitor cell line called HPCLSK.48 Despite the limitation of Lhx2 overexpression, it allows us to study the cytokine-dependent STAT5 signaling driven by TPO, interleukin 3 (IL-3), erythropoietin (EPO), and granulocyte macrophage colony-stimulating factor (GM-CSF)1 in a single system. TPO stimulation induces the almost exclusive presence of STAT5B in the nucleus (Figure 3E-F; supplemental Figure 3D). Similar effects are observed on stimulation with EPO or GM-CSF, whereas stimulation with IL-3 induces the nuclear translocation of both STAT5A and STAT5B to a comparable extent (supplemental Figure 3E-F). In summary, our data are consistent with the idea that the dominant role of STAT5B in HSC self-renewal stems from its selective activation in these cells.
Selective STAT5B activation drives the self-renewal of LSCs
Tyrosine-phosphorylated STAT5B is also essential for the self-renewal of LSCs. Initial indications came from our analysis of the serial plating capacity of HPCLSK cells that overexpress hyperactive STAT5BN642H (supplemental Figure 4A). Although HPCLSK cells exhaust, STAT5BN642H maintain their self-renewal potential (Figure 4A) and express higher levels of STAT5 target genes and genes associated with dormancy (supplemental Figure 4B). As STAT5 transcription factors are crucial in leukemia, we injected WT, Stat5a−/−, or Stat5b−/− BCR/ABLp210+ LSK cells into NSG mice. Mice injected with WT or Stat5a−/− BCR/ABLp210+ LSK cells disease, whereas mice injected with Stat5b−/− BCR/ABLp210+ LSK cells remain healthy for more than 200 days (Figure 4B). Analysis of mice 12 weeks after primary transplantation revealed significantly fewer Stat5b−/− BCR/ABLp210+ LSK cells (supplemental Figure 4C). Retransplantation experiments confirmed our observations: whereas WT and Stat5a−/− BCR/ABLp210+ cells readily induce leukemia, no signs of disease are detectable after re-transplantation of Stat5b−/− BCR/ABLp210+ cells, demonstrating the dominant role of STAT5B in BCR/ABLp210+ LSK cells (Figure 4B; supplemental Figure 4D).
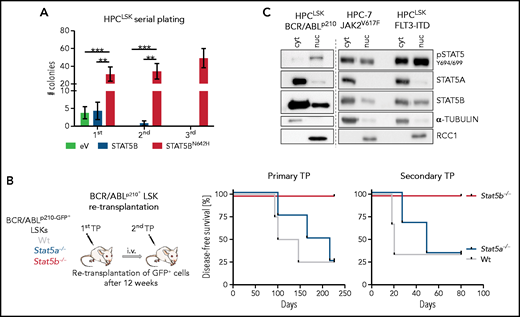
Selective STAT5B activation drives the self-renewal of LSCs. (A) Colony numbers in serial plating assay of HPCLSK cells expressing empty vector (eV), STAT5B, or STAT5BN642H (n = 6/genotype, mean ± SEM). (B) BCR/ABLp210+ LSK retransplantation assay: 2 × 10⁴ BCR/ABLp210-GFP+ FACS-sorted LSK cells were injected IV in NSG mice. Two recipients per donor were injected to use 1 for retransplantation after 13 weeks and 1 for terminal analysis. Experimental workflow (i) and survival analyses of recipients of the primary and secondary transplantation (TP, n = 4/genotype) (ii). (C) pSTAT5 (Y694/699), STAT5A, and STAT5B immunoblot analysis of cytoplasmic (cyt) and nuclear (nuc) fraction of HPC-7 cells expressing JAK2V617F and HPCLSK cells expressing FLT3-ITD or BCR/ABLp210. α-TUBULIN served as loading control for the cytoplasmic fraction and RCC1 for the nuclear fraction. A representative blot of 3 independent experiments is shown. Levels of significance were calculated using 1-way ANOVA (A). **P < .01; ***P < .001.
Selective STAT5B activation drives the self-renewal of LSCs. (A) Colony numbers in serial plating assay of HPCLSK cells expressing empty vector (eV), STAT5B, or STAT5BN642H (n = 6/genotype, mean ± SEM). (B) BCR/ABLp210+ LSK retransplantation assay: 2 × 10⁴ BCR/ABLp210-GFP+ FACS-sorted LSK cells were injected IV in NSG mice. Two recipients per donor were injected to use 1 for retransplantation after 13 weeks and 1 for terminal analysis. Experimental workflow (i) and survival analyses of recipients of the primary and secondary transplantation (TP, n = 4/genotype) (ii). (C) pSTAT5 (Y694/699), STAT5A, and STAT5B immunoblot analysis of cytoplasmic (cyt) and nuclear (nuc) fraction of HPC-7 cells expressing JAK2V617F and HPCLSK cells expressing FLT3-ITD or BCR/ABLp210. α-TUBULIN served as loading control for the cytoplasmic fraction and RCC1 for the nuclear fraction. A representative blot of 3 independent experiments is shown. Levels of significance were calculated using 1-way ANOVA (A). **P < .01; ***P < .001.
We used the stem/progenitor cell lines HPC-7 or HPCLSK transformed with BCR/ABLp210, JAK2V617F, or FLT3-ITD (all 3 oncogenes activate and depend on STAT5) to address whether the selective activation of STAT5B extends to leukemia. STAT5B, but not STAT5A, is predominantly present in the nucleus of HPC-7 or HPCLSK cells transformed with BCR/ABLp210, JAK2V617F, or FLT3-ITD (Figure 4C). Confirmation comes from human AML and CML cell lines, as immunoprecipitation of STAT5A or STAT5B and nuclear fractionation in K562 (BCR/ABLp210), SET2 (JAK2V617F), and HEL (JAK2V617F) cells verifies the higher levels of pYSTAT5B than pYSTAT5A (supplemental Figure 4E-F).
CD9 as a marker and target of pYSTAT5B signaling
AML risk signatures49,50 contain STAT5 target genes, including SOCS2, indicating that STAT5 signaling has an important role in aggressive disease subtypes. We confirmed the dominant activation of STAT5B in leukemic cells bearing BCR/ABLp210, JAK2V617F, or FLT3-ITD. As STAT5B-dependent genes might represent druggable targets for leukemia therapy, we investigated them in more detail in our single cell RNA-Seq dataset. We first defined an enrichment score to describe the most dormant HSCs (top 10%) within each genotype (supplemental Figure 5A). Differential gene expression analysis between the most dormant HSCs and the remaining cells in each genotype allowed for the identification of 35 genes specifically regulated by STAT5B (down in Stat5b−/−, up in Stat5a−/−; Figure 5A). These genes are reminiscent of the expression profiles of dormant HSCs (supplemental Figure 5B). We then examined the influence of the expression levels of these genes on patient survival in 4 distinct cohorts. Three cohorts contained oncogenic mutations that signal via STAT5 (STAT5-driven), and a control cohort (non–STAT5-driven) contained mutations that do not (Figure 5B). The procedure identified CD9 as the only gene that significantly correlated negatively with overall survival in STAT5-driven patient cohorts but lacked any correlation in non–STAT5-driven patient samples (Figure 5C; supplemental Figure 5C). In line with other reports,25-28CD9 is expressed at higher levels in LSCs than in HSCs (supplemental Figure 5D). We speculated that STAT5B directly regulates the expression of CD9. The idea is consistent with an observation in patients with FLT3- and NPM1-mutated AML: patients with CD9-high express significantly higher levels of SOCS2 and CISH than patients with CD9-low (supplemental Figure 5E). Further support came from the observation that surface levels of CD9 are reduced in Stat5b−/− LSK cells but not in the absence of Stat5a (supplemental Figure 5F).
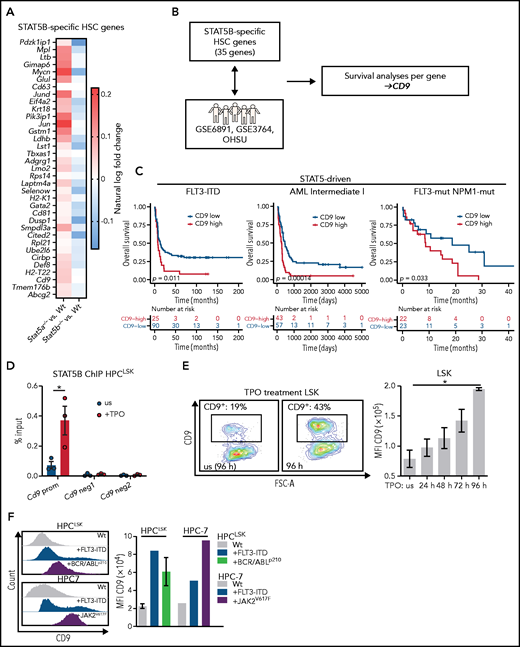
CD9 as marker and direct target of pYSTAT5B signaling. (A) 35 STAT5B-specific HSC genes. Color scale indicates % ln of fold-change difference between Stat5a−/− or Stat5b−/− and WT. (B) Schematic workflow: genes from panel A were analyzed for their expression levels-based influence on patient survival in STAT5-driven patient cohorts GSE6891 (FLT3-ITD), GSE37642 (Intermediate I), OHSU (FLT3-mut., NPM1-mut.), and the non–STAT5-driven cohort GSE37642 (Intermediate II). (C) Survival analyses comparing CD9-low vs CD9-high expressing patients in the STAT5-driven cohorts GSE6891 (FLT3-ITD), GSE37642 (Intermediate I), and OHSU (FLT3-mut., NPM1-mut.). (D) STAT5B chromatin immunoprecipitation (ChIP)–quantitative polymerase chain reaction: Quantification of STAT5B binding to the Cd9 promoter (prom) or negative regions (neg1 and neg2) in HPCLSK WT cells, unstimulated (us), or after 30 minutes of TPO stimulation (n = 3, mean ± SEM). (E) CD9 expression changes after culture with TPO. (i) Representative CD9 FACS plots of in vitro cultured WT LSK cells with or without (us) TPO after 96 hours. (ii) Quantification of CD9 expression of WT LSK cells after TPO treatment for 24, 48, 72, and 96 hours (n = 2, mean ± SEM). (F) Analysis of CD9 expression in HSC lines expressing STAT5B-driving oncoproteins. Representative histograms of CD9 expression (i) and quantification of CD9 levels of HPCLSK WT (ii) (n = 3, mean ± SEM), +FLT3-ITD, +BCR/ABLp210 (n = 3, ±SEM), and HPC-7 WT, FLT3-ITD, or JAK2V617F. Levels of significance were calculated using a log-rank test (C), and an unpaired Student t test in (D). Levels of significance were calculated using the Friedman test (E). *P < .05.
CD9 as marker and direct target of pYSTAT5B signaling. (A) 35 STAT5B-specific HSC genes. Color scale indicates % ln of fold-change difference between Stat5a−/− or Stat5b−/− and WT. (B) Schematic workflow: genes from panel A were analyzed for their expression levels-based influence on patient survival in STAT5-driven patient cohorts GSE6891 (FLT3-ITD), GSE37642 (Intermediate I), OHSU (FLT3-mut., NPM1-mut.), and the non–STAT5-driven cohort GSE37642 (Intermediate II). (C) Survival analyses comparing CD9-low vs CD9-high expressing patients in the STAT5-driven cohorts GSE6891 (FLT3-ITD), GSE37642 (Intermediate I), and OHSU (FLT3-mut., NPM1-mut.). (D) STAT5B chromatin immunoprecipitation (ChIP)–quantitative polymerase chain reaction: Quantification of STAT5B binding to the Cd9 promoter (prom) or negative regions (neg1 and neg2) in HPCLSK WT cells, unstimulated (us), or after 30 minutes of TPO stimulation (n = 3, mean ± SEM). (E) CD9 expression changes after culture with TPO. (i) Representative CD9 FACS plots of in vitro cultured WT LSK cells with or without (us) TPO after 96 hours. (ii) Quantification of CD9 expression of WT LSK cells after TPO treatment for 24, 48, 72, and 96 hours (n = 2, mean ± SEM). (F) Analysis of CD9 expression in HSC lines expressing STAT5B-driving oncoproteins. Representative histograms of CD9 expression (i) and quantification of CD9 levels of HPCLSK WT (ii) (n = 3, mean ± SEM), +FLT3-ITD, +BCR/ABLp210 (n = 3, ±SEM), and HPC-7 WT, FLT3-ITD, or JAK2V617F. Levels of significance were calculated using a log-rank test (C), and an unpaired Student t test in (D). Levels of significance were calculated using the Friedman test (E). *P < .05.
The high CD9 levels in dormant HSCs decrease with differentiation (supplemental Figure 5G). Chromatin immunoprecipitation-quantitative polymerase chain reaction shows that STAT5B binds directly to the Cd9 promoter using Cish and Bcl2-l1 promoters as controls (Figure 5D; supplemental Figure 5H-J). We substantiated this finding by treating HPCLSK cells with TPO, which induces expression of Cd9 (supplemental Figure 5K) and provokes a pronounced increase in the surface levels of CD9 on ex vivo LSK cells over a period of 4 days (Figure 5E). The effect is eliminated in Stat5b−/− LSK cells (supplemental Figure 5L). Further evidence that STAT5B (but not STAT5A) drives the expression of CD9 stems from the finding of elevated CD9+ LSK cells in STAT5BN642H mice, which is not seen in mice expressing hyperactive STAT5A (supplemental Figure 5M). Enhanced levels of CD9 are also detected on oncogene-induced activation of STAT5B in HPC-7 and HPCLSK cells overexpressing JAK2V617F, FLT3-ITD, or BCR/ABLp210 (Figure 5F). The data indicate that CD9 is regulated by STAT5B in response to cytokine-induced or oncogenic signaling.
CD9 blocking affects STAT5 activation and impedes self-renewal
We observed that CD9-high FLT3-ITD+ NPM1+ human patient BM cells have higher levels of pYSTAT5 than the CD9-low cells (Figure 6A), which led us to hypothesize that CD9 interacts and stabilizes cytokine receptors activating STAT5. CD9 has been shown to interact with c-kit51 and gp130.52 We thus cultured BM cells from JAK2V617F MPN mice35,36 in the presence of IgG or CD9-blocking antibody (aCD9). Already under homeostatic conditions, aCD9 treatment reduced levels of pYSTAT5. This difference became even more pronounced after TPO stimulation (inducing self-renewal46,47) in HSC/MPP1 and LSK cells. In contrast, CD9 blocking and stimulation with cytokines inducing proliferation and myelopoiesis resulted in unaltered (EPO) or even increased pYSTAT5 levels (IL-3, GM-CSF)53-56 (Figure 6B).
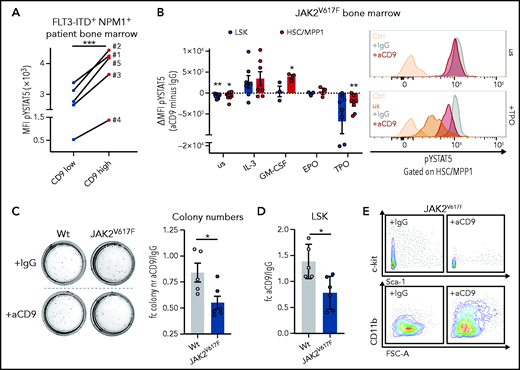
CD9 blocking affects STAT5 activation and impedes self-renewal. (A) pYSTAT5 levels determined by intracellular flow cytometry staining of CD9-low (CD9 MFI < median) and CD9-high (CD9 MFI > median) expressing FLT3-ITD+ NPM1+ patient BM cells (n = 5). (B) Flow cytometric analyses of pYSTAT5 levels in IgG- or aCD9-treated JAK2V617F BM cells after respective stimulations for 20 minutes. (i) Differences of pYSTAT5 levels (aCD9 minus IgG) (n ≥ 3/genotype, mean ± SEM). (ii) Representative histograms of pYSTAT5 signal of HSC/MPP1 cells unstimulated (us) or after TPO stimulation; antibody isotype-stained (Ctrl) cells are shown as control. (C-E) Colony formation assays of wt and JAK2V617F mouse BM cells either treated with IgG or aCD9 (5 µg/mL). (C) (i) Representative pictures of colony formation and (ii) fold change in colony numbers (n ≥ 5/genotype and condition, mean ± SEM). (D-E) Quantification of LSK cells (n ≥ 5/genotype and condition, mean ± SEM) after aCD9 or IgG treatment (D) and representative FACS plots of c-kit/Sca-1 (i) and CD11b expression in JAK2V617F cells (ii) after aCD9 or IgG treatment (E). Levels of significance were calculated using a paired Student t test (A-B), and an unpaired Student t test (C-D). *P < .05; **P < .01; ***P < .001.
CD9 blocking affects STAT5 activation and impedes self-renewal. (A) pYSTAT5 levels determined by intracellular flow cytometry staining of CD9-low (CD9 MFI < median) and CD9-high (CD9 MFI > median) expressing FLT3-ITD+ NPM1+ patient BM cells (n = 5). (B) Flow cytometric analyses of pYSTAT5 levels in IgG- or aCD9-treated JAK2V617F BM cells after respective stimulations for 20 minutes. (i) Differences of pYSTAT5 levels (aCD9 minus IgG) (n ≥ 3/genotype, mean ± SEM). (ii) Representative histograms of pYSTAT5 signal of HSC/MPP1 cells unstimulated (us) or after TPO stimulation; antibody isotype-stained (Ctrl) cells are shown as control. (C-E) Colony formation assays of wt and JAK2V617F mouse BM cells either treated with IgG or aCD9 (5 µg/mL). (C) (i) Representative pictures of colony formation and (ii) fold change in colony numbers (n ≥ 5/genotype and condition, mean ± SEM). (D-E) Quantification of LSK cells (n ≥ 5/genotype and condition, mean ± SEM) after aCD9 or IgG treatment (D) and representative FACS plots of c-kit/Sca-1 (i) and CD11b expression in JAK2V617F cells (ii) after aCD9 or IgG treatment (E). Levels of significance were calculated using a paired Student t test (A-B), and an unpaired Student t test (C-D). *P < .05; **P < .01; ***P < .001.
We speculated that it might be possible to exploit the difference in CD9 levels between low-expressing HSCs and high-expressing LSCs in the therapy of STAT5-driven leukemia. To provide an initial proof-of-concept, we performed colony formation and liquid culture assays of BM from JAK2V617F MPN mice and WT controls in the presence of either IgG or aCD9. JAK2V617F+ BM cells show elevated levels of surface CD9 (supplemental Figure 6A). Blocking CD9 significantly reduced the numbers of JAK2V617F+ colonies and LSK cells, whereas WT remained mainly unaffected (Figure 6C-D; supplemental Figure 6B), with the concomitant loss of c-kit expression and upregulation of the myeloid differentiation marker CD11b (Figures 6E; supplemental Figure 6C). In liquid culture, aCD9 treatment increases levels of the apoptotic marker Annexin-V and reduces LSK and total cell numbers exclusively in JAK2V617F BM (supplemental Figure 6D), additionally supported by the use of a second CD9 blocking antibody (supplemental Figure 6E). These data indicate CD9 blockade as a potential strategy to eradicate STAT5-dependent LSCs.
To compare the effects of CD9 blocking and STAT5 inhibition, we treated BM cells with aCD9 or the STAT5 inhibitor AC-4-130.57 Although it had no effect on the total cell number, STAT5 inhibition specifically decreased LSK numbers. There was no increase in the level of Annexin-V on LSK cells, but the levels of c-kit and CD9 were reduced, similar to the effects of aCD9 treatment (supplemental Figure 6F-I).
CD9 as a therapeutic target for pYSTAT5-driven leukemia
To test our conclusion that CD9 blockade might represent a potential therapeutic strategy, we explored the effects of aCD9 treatment in murine MPN models. We transplanted JAK2V617F BM (Ly5.2+) into NSG mice (Ly5.1+) and pretreated the cells with IgG or aCD9 for 24 hours. After a viability check, we injected the cells IV and analyzed the recipients 3 weeks later (supplemental Figure 7A-B). aCD9 pretreatment reduced the spleen size and gave lower numbers of Ly5.2+ JAK2V617F HSCs and total cells (supplemental Figure 7C-D). This encouraged us to explore the efficacy of aCD9 in vivo and to investigate potential side effects on untransformed cells. One week after JAK2V617F BM transplantation, we treated recipient mice 4 times (at 4-day intervals) with aCD9 or IgG and analyzed them 4 weeks after the last treatment (Figure 7A). Although we saw no large difference in spleen size and total Ly5.2+ cell numbers, aCD9 reduced Ly5.2+ JAK2V617F HSCs while leaving Ly5.1+ WT HSCs, megakaryocyte progenitors, or B-cell progenitors unimpaired (Figure 7B; supplemental Figure 7E-G), confirming the increased sensitivity of CD9-high JAK2V617F HSCs to aCD9 treatment.
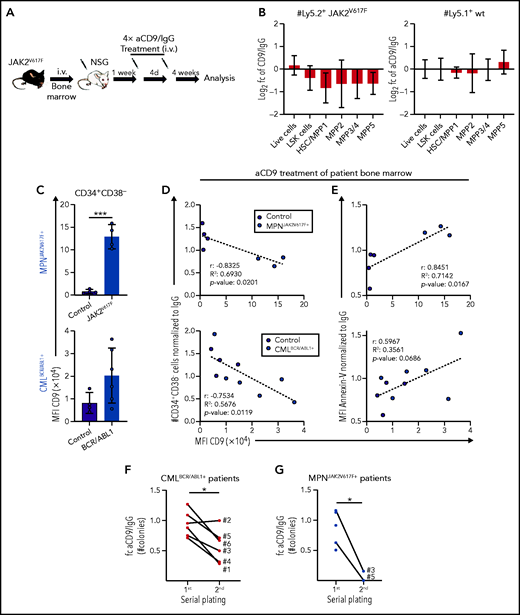
CD9 as a therapeutic target for pYSTAT5-driven leukemia. (A-B) JAK2V617F transplantation with aCD9 in vivo treatment. (A) Experimental workflow. (B) Log2 fold changes (aCD9 vs IgG) of HSC subpopulations and total BM cell numbers of (i) Ly5.2+ JAK2V617F donors or (ii) Ly5.1+ WT NSG recipients (n = 4 per treatment, mean ± SEM, 4× 1.25 mg/kg IV IgG or aCD9 were applied). (C) Analysis of CD9 expression in CD34+CD38− cells of (i) MPNJAK2V617F+ (n = 4) and (ii) CMLBCR/ABL1+ (n = 6) patient and control (n = 4) BM. (D-E) In vitro treatment of control and patient BM cells either treated with IgG or aCD9 (2 µg/mL). XY plots showing CD9 levels and (D) CD34+CD38− cell numbers or (E) Annexin-V levels of control (n = 4) and (i) MPNJAK2V617F+ (n = 3) or (ii) CMLBCR/ABL1+ patient BM mononuclear cells (n = 6). (F) Serial plating assays of CMLBCR/ABL1+ patient (n = 6) BM either treated with IgG or aCD9. Fold changes of aCD9/IgG colony numbers in the first and second plating. (G) Serial plating assays of MPNJAK2V617F+ patient (n = 5) BM either treated with IgG or aCD9. Fold changes of aCD9/IgG colony numbers in the first and second plating. Levels of significance were calculated using an unpaired Student t test (C), and a paired Student t test (F-G). Levels of significance and correlation were calculated using Pearson in panels D-E. *P < .05; ***P < .001.
CD9 as a therapeutic target for pYSTAT5-driven leukemia. (A-B) JAK2V617F transplantation with aCD9 in vivo treatment. (A) Experimental workflow. (B) Log2 fold changes (aCD9 vs IgG) of HSC subpopulations and total BM cell numbers of (i) Ly5.2+ JAK2V617F donors or (ii) Ly5.1+ WT NSG recipients (n = 4 per treatment, mean ± SEM, 4× 1.25 mg/kg IV IgG or aCD9 were applied). (C) Analysis of CD9 expression in CD34+CD38− cells of (i) MPNJAK2V617F+ (n = 4) and (ii) CMLBCR/ABL1+ (n = 6) patient and control (n = 4) BM. (D-E) In vitro treatment of control and patient BM cells either treated with IgG or aCD9 (2 µg/mL). XY plots showing CD9 levels and (D) CD34+CD38− cell numbers or (E) Annexin-V levels of control (n = 4) and (i) MPNJAK2V617F+ (n = 3) or (ii) CMLBCR/ABL1+ patient BM mononuclear cells (n = 6). (F) Serial plating assays of CMLBCR/ABL1+ patient (n = 6) BM either treated with IgG or aCD9. Fold changes of aCD9/IgG colony numbers in the first and second plating. (G) Serial plating assays of MPNJAK2V617F+ patient (n = 5) BM either treated with IgG or aCD9. Fold changes of aCD9/IgG colony numbers in the first and second plating. Levels of significance were calculated using an unpaired Student t test (C), and a paired Student t test (F-G). Levels of significance and correlation were calculated using Pearson in panels D-E. *P < .05; ***P < .001.
Our data in the murine system encouraged us to test the effect of aCD9 on BM samples from human patients with STAT5-driven leukemia (AMLFLT3-ITD+, MPNJAK2V617F+, CMLBCR/ABL1+; supplemental Table 2). CD34+CD38− cells of all BM samples with pYSTAT5-activating mutations display elevated surface levels of CD9 (Figure 7C; supplemental Figure 7H). We first determined the aCD9 concentration that is nontoxic for control human patient samples (2 µg/mL) by treating liquid cultures and colony formation assays with either aCD9 or IgG and analyzing total and CD34+CD38− cell numbers (supplemental Figure 7I). Blocking CD9 (but not IgG treatment) efficiently reduces the viability of CD34+CD38− patient cells, with the greatest effect in samples with high surface levels of CD9. Treatment of CD9-high patient samples gives a drastic reduction in the numbers of living and CD34+CD38− cells and an increase in apoptosis while having almost no effect on CD9-low controls (Figure 7D-E; supplemental Figure 7J-K). The reduction in CD34+CD38− cells is paralleled by a decrease in CD45+ cell number and levels of CD34 and an increase in levels of CD11b, suggesting myeloid differentiation (supplemental Figure 7L-N). We substantiated the observations in serial plating assays of BM samples from patients with CMLBCR/ABL1+ and MPNJAK2V617F+ in the presence of either aCD9 or IgG. aCD9-treated CMLBCR/ABL1+ patient BM cells show a pronounced reduction of colony formation with reduced CD34+CD38− cell numbers after the secondary plating (Figure 7F; supplemental Figure 7O-P). Similarly, aCD9-treated MPNJAK2V617F+ BM cells show reduced colony numbers in the secondary plating (Figure 7G; supplemental Figure 7Q-R). The findings support that blocking CD9 induces exhaustion, differentiation, and apoptosis in STAT5B-driven LSCs, both in our murine models and in samples from human patients.
Discussion
STAT5 has a critical role in the maintenance and self-renewal of HSCs and in leukemia.1,7-10 We now show that STAT5A and STAT5B have distinct functions in HSCs and in LSCs and define STAT5B as the driving force behind the maintenance and self-renewal of these cell types. We identify CD9 as a novel STAT5B target gene and show that the levels of CD9 correlate positively with STAT5 phosphorylation and negatively with the survival of patients with FLT3-ITD+ AML. The elevated CD9 surface levels on LSCs render the cells particularly sensitive toward CD9 blocking, which we show to induce differentiation and apoptosis. We suggest that CD9 levels may have a prognostic value in STAT5-dependent leukemia. Our results also provide initial indications that anti-CD9 therapy might represent a novel possibility to treat patients with STAT5B-dependent myeloid leukemia.
This suggestion is consistent with a preclinical dataset that included few cases of BCP-ALL.30 Our data are consistent with the idea that aCD9 treatment may be useful in a range of STAT5B-driven diseases, including AMLFLT3-ITD+, MPNJAK2V617F+, and CMLBCR/ABL1+. CD9 blocking would preferentially target LSCs, which have higher levels of CD9 than HSCs, providing a possible therapeutic window that would allow LSCs to be eliminated while leaving steady-state hematopoiesis unaffected. The fact that Cd9−/− mice lack any hematopoietic defect58 supports the use of aCD9 in treatment. However, other CD9-expressing hematopoietic cells may react toward aCD9 treatment. This possibility will require a detailed assessment in clinical studies. In primary CD34+CD38− patient cells with high levels of CD9, aCD9 induces differentiation, apoptosis, or loss of self-renewal, reminiscent of the phenotype of Stat5b-deficient HSCs and LSCs. Our in vivo data are consistent with this interpretation, although the effects are somewhat below statistical significance. Nevertheless, it is attractive to speculate that the effect of CD9 inhibition stems from interference with receptor-dependent signaling. CD9 directly interacts with the cytokine receptor gp130 in glioma stem cells, enhancing STAT3 activation.52 As other members of the tetraspanin family, CD9 interacts with c-kit,51,58 which may contribute to the differentiation induced by its blocking. Selective STAT5B activation (which stimulates CD9 transcription) by TPO drives self-renewal, so it is likely that CD9 also interacts with the thrombopoietin receptor. We provide initial indications that anti-CD9 treatment causes reduced TPO signaling, thereby abrogating STAT5B-dependent self-renewal and leading to differentiation.
CD9 has been proposed as a prognostic marker for patients with AML. AML represents a particularly heterogeneous disease and the levels of CD9 have been tentatively correlated with a poor31 or a favorable26 prognosis. Our findings suggest that the prognostic value of CD9 is linked to STAT5B activation, supported by high expression of STAT5 target genes in aggressive myeloid leukemia.49,50 In line, patients with STAT5B-dependent AML with high CD9 levels have a much poorer prognosis than patients with STAT5B-independent disease. It is important to note that we discovered the role of CD9 in a cohort of patients with myeloid leukemia expressing STAT5B-activating oncogenes, so the STAT5B–CD9 axis may only be important in myeloid leukemia. There are indications that STAT5B does not signal via TPO and CD9 in lymphoid leukemia, which is thought to be maintained without the involvement of stem cells.59,60 The lack of this signaling cascade in lymphoid leukemic cells may be overcome by STAT5B GOF mutations driving self-renewal in these neoplasms.
The high levels of pYSTAT5 in dormant HSCs indicate that STAT5 is involved in self-renewal and quiescence. In HSCs, TPO activates STAT5B but not STAT5A, causing STAT5B to be phosphorylated and translocated into the nucleus explaining the Stat5b−/− phenotype. The selective activation of STAT5B is specific to HSCs: TPO stimulation increases the levels of both pYSTAT5A and pYSTAT5B in megakaryocytes. The specificity for STAT5B activation in HSCs may arise from STAT5A-specific negative regulators, selective receptor docking, distinct posttranslational modifications, and/or individual interactions with proteins that permit translocation.
STAT5A and STAT5B are widely believed to have redundant roles in the hematopoietic system, with STAT5B generally considered dominant as it is present in higher concentrations.1 HSCs represent an exception as they have similar levels of STAT5A and STAT5B, enabling us to examine the functions of the 2 molecules in a single cell. We find different transcriptional signatures of STAT5A and STAT5B in these cells, with STAT5B apparently selectively involved in activating a range of “quiescence” genes (although it is not clear whether STAT5A and STAT5B have the same or different DNA binding sites). We here present the first conclusive demonstration that the 2 STAT5 proteins have distinct functions. Although both STAT5A and STAT5B signal to cause proliferation and survival, STAT5B but not STAT5A is able to drive self-renewal. It is attractive to postulate that the other protein (STAT5A) drives differentiation. The surprising dichotomy of function may be unique to stem cells, which are unlike all other hematopoietic cells in that they can either self-renew or differentiate.
The selective activation of STAT5B adds an additional layer of complexity to our understanding of canonical JAK/STAT signaling. We highlight STAT5B as a major player in HSCs and LSCs and define a STAT5B-dependent LSC marker (CD9) for prognosis and potential therapy. Our finding that STAT5B, and not STAT5A, drives self-renewal explains why STAT5B is preferentially activated downstream of several oncogenes and accounts for the frequency of GOF mutations in STAT5B, but not STAT5A, in hematopoietic malignancies. Our results emphasize the need to consider STAT5A and STAT5B individually in hematopoietic malignancies.
Acknowledgments
The authors thank Sabine Fajmann, Philipp Jodl, Michaela Ensfelder-Koperek, Michaela Schlederer, Isabella M. Mayer, Anna-Dorothea Gorki, Gabriele Stefanzl, Daniela Berger, Karin Bauer, Irina Sadovnik, Barbara Peter, and Tobias Suske for excellent experimental support; Patrick T. Gunning for generously providing the AC-4-130; the Biomedical Sequencing Facility at the CeMM Research Center for Molecular Medicine at the Austrian Academy of Sciences and Christoph Bock for supporting the single cell-Seq experiment; Graham Tebb for critical reading and editing of our manuscript; and Andrea Hoelbl-Kovacic, David Martin, and Thomas Decker for scientific discussions.
This work was supported by Austrian Science Fund Special Research Program grants SFB-F6105, SFB-F6107, SFB-F4704, SFB-F4706, and SFB-F4707. B.M. is supported by the Fellinger Cancer Research association.
Authorship
Contribution: V.S., B.M., and S.K. conceptualized the study; S.K. and B.M. performed most of the experiments; S.K. analyzed all wet laboratory experiments; R.G., T.K., H.P., and F.H. analyzed single cell RNA-Seq data; M.F. processed the single cell RNA-Seq samples; M.P.-M. executed and supported in vivo experiments; E.D. and T.B. generated oncogene-expressing HPC-7 and HPCLSK cell lines; K.B. supported ex vivo experiments; V.M.K. performed IPs; R.M. provided transgenic mouse models and contributed scientifically; W.R.S. and P.V. provided primary patient samples; G.H. performed bioinformatic patient data analysis; S.L. and K.K. were involved in experimental design and scientific discussions; S.K., B.M., and V.S. wrote the manuscript; B.M. and V.S. supervised the study; and all authors revised the manuscript.
Conflict-of-interest disclosure: The authors declare no competing financial interests.
Correspondence: Veronika Sexl, Institute of Pharmacology and Toxicology, University of Veterinary Medicine Vienna, Veterinaerplatz 1, 1210 Vienna, Austria; e-mail: veronika.sexl@vetmeduni.ac.at.
The data reported in this article have been deposited in the Gene Expression Omnibus database (accession number GSE178648). Please contact the corresponding author for additional information and original data.
There is a Blood Commentary on this article in this issue.
The online version of this article contains a data supplement.
The publication costs of this article were defrayed in part by page charge payment. Therefore, and solely to indicate this fact, this article is hereby marked “advertisement” in accordance with 18 USC section 1734.

This feature is available to Subscribers Only
Sign In or Create an Account Close Modal