

Key Points
Blood master regulator PU.1 is orchestrated by synapses of an enhancer with 2 competing promoters, a proximal and an antisense promoter.
Core-binding factor oncogenes induce a T-lymphoid state of PU.1 antisense transcription as a physiological program of PU.1 suppression.

Abstract
The blood system serves as a key model for cell differentiation and cancer. It is orchestrated by precise spatiotemporal expression of crucial transcription factors. One of the key master regulators in the hematopoietic systems is PU.1. Reduced levels of PU.1 are characteristic for human acute myeloid leukemia (AML) and are known to induce AML in mouse models. Here, we show that transcriptional downregulation of PU.1 is an active process involving an alternative promoter in intron 3 that is induced by RUNX transcription factors driving noncoding antisense transcription. Core-binding factor (CBF) fusions RUNX1-ETO and CBFβ-MYH11 in t(8;21) and inv(16) AML, respectively, activate the PU.1 antisense promoter that results in a shift from sense toward antisense transcription and myeloid differentiation blockade. In patients with CBF-AML, we found that an elevated antisense/sense transcript and promoter accessibility ratio represents a hallmark compared with normal karyotype AML or healthy CD34+ cells. Competitive interaction of an enhancer with the proximal or the antisense promoter forms a binary on/off switch for either myeloid or T-cell development. Leukemic CBF fusions thus use a physiological mechanism used by T cells to decrease sense transcription. Our study is the first example of a sense/antisense promoter competition as a crucial functional switch for gene expression perturbation by oncogenes. Hence, this disease mechanism reveals a previously unknown Achilles heel for future precise therapeutic targeting of oncogene-induced chromatin remodeling.
Introduction
Leukemia belongs to the top 7 most common cancer-related causes of death,1 and alterations of the core-binding factors (CBFs) RUNX1 and CBFβ are frequent mutational targets.2,3 When disrupted by chromosomal translocations t(8;21)(q22;q22) and inv(16)(p13q22) creating the fusion proteins RUNX1-ETO and CBFβ-MYH11, respectively, they resemble driving mutational events of the so-called CBF leukemias, accounting for ∼15% and thus the largest group of human acute myeloid leukemias (AMLs).4,5 CBF fusions are paradigmatic leukemic transcription factors that disrupt hematopoiesis by imposing aberrant transcriptional circuits through their impact on enhancer–promoter interactions and chromatin structure that drive malignant self-renewal and block cell differentiation.6–10 In particular, a dominant negative effect of the RUNX1-ETO fusion protein and inactivation of the master regulator PU.1 has been considered a critical leukemic event.11,12 However, an understanding of the mechanistic underpinnings remains elusive.
The spatial organization of the genome in topologically associated domains is fundamental for transcriptional regulation, including noncoding transcription.13–15 Expression of blood lineage–specifying transcription factor PU.1 (SPI-1) is tightly regulated through enhancer–promoter interactions within a specific topologically associated domain favoring long-ranged interactions between regulatory elements.16-23 PU.1 levels increase during myeloid differentiation18 but completely switch off during T-cell maturation.19,24,25 Knockout of a critical region containing the conserved −14 kb (in mice; −17 kb in humans) upstream regulatory element (URE) significantly alters PU.1 expression leading to myeloid leukemia development and block in T-lymphoid differentiation.18,19 Rapid amplification of complementary DNA (cDNA) ends identified a noncoding antisense transcript under the regulation of a highly conserved antisense promoter (AsPr) located in intron 3 of the PU.1 locus.17,26 However, the relevance of PU.1 antisense transcription and mechanisms of its regulation remain unknown. Previous studies have mainly focused on the mechanism of how transcription factors are induced and regulated. PU.1 is particularly well studied in this respect.27-29 The data presented here focus on the opposite, suggesting that silencing of PU.1 is an active process that requires a specific chromosome formation associated with the transcription of a noncoding antisense transcript.
Methods
Primary material and cell culture
Healthy donor human bone marrow aspirations, peripheral blood cells, and AML patient samples for reverse transcription quantitative polymerase chain reaction (RT-qPCR) assays were obtained from the Division of Hematology at the Medical University of Graz (Graz, Austria) and the Division of Hematology and Hemostaseology at the Medical University of Vienna (Vienna, Austria). Each sample was sorted fresh after Ficoll-Paque mononuclear cell separation. AML patient samples contained >80% blast cells. Material from patients and healthy donors was obtained with approval from the ethics committees of the Medical University of Graz (vote number 26369 ex13/14) and the Medical University of Vienna (vote number 1184/2014). Research was conducted in accordance with the Declaration of Helsinki.
Kasumi -1, Jurkat, HL-60, and ME-1 were purchased from DSMZ and cultured in RPMI 1640 supplemented with either 20% or 10% fetal calf serum as recommended. In addition, ME-1 cells were grown in the presence of 25 mM N-2-hydroxyethylpiperazine-N′-2-ethanesulfonic acid. HEK-LentiX cells for lentivirus production were purchased from Takara (#632180) and grown in Dulbecco’s modified Eagle medium supplemented with 10% fetal calf serum.
Flow cytometry
Single-cell suspensions were analyzed by flow cytometry using the FACSAria Fortessa flow cytometer (BD Biosciences) or sorted by the FACSAria Fusion (BD Biosciences) and MoFlo Astrios EQ (Beckman Coulter). FlowJo (Tree Star) was used for data analysis. The antibodies used and gating are detailed in supplemental Tables 2 and 3 (available on the Blood Web site).
Reverse transcription quantitative PCR
Total RNA was extracted by using TRIzol according to the manufacturer’s protocol (Gibco). Quantification of PU.1 messenger RNA (mRNA), PU.1 antisense RNA (asRNA), and GADPH expression in sorted healthy bone marrow cells, healthy peripheral blood mononuclear cells, and AML patient samples was performed by using the TaqMan RT-qPCR RNA-to-Ct 1-Step Kit (Applied Biosystems). The glyceraldehyde‐3‐phosphate dehydrogenase (GAPDH) housekeeping gene was quantified by using predeveloped TaqMan human GAPDH endogenous control (Applied Biosystems) according to manufacturers’ protocols. Quantification of RUNX1-ETO for assessing knockdown efficiency was performed by using the high-capacity RNA-to-cDNA Kit and SYBR qPCR Green PCR Master Mix (Applied Biosystems). Quantification of PU.1 mRNA, PU.1 asRNA, and GADPH expression in cell lines was performed by using strand-specific reverse transcript SuperScriptIII First-Strand Synthesis System (Invitrogen) and GoTaq Probe qPCR Master Mix (Promega) according to the manufacturers’ protocols. The generation of stranded cDNA for the GAPDH housekeeping used the oligo(dT) primer. The primers used are described in supplemental Table 1.
Electrophoretic mobility shift assays
Nuclear extracts from Jurkat cells were prepared by using a Nuclear Extract Kit (40010; Active Motif), according to the manufacturer’s recommendation. An electromobility shift assay was performed by using NUSHIFT kit (2005350; Active Motif), according to the manufacturer’s recommendation and as previously reported.30 Supershift analysis was conducted by using antibodies to RUNX1 or RUNX3 (Active Motif catalog #39300 and #39301, respectively). The gel was exposed to X-ray film and/or phosphor-imaging screens. Oligonucleotide sequences are described in supplemental Table 1.
Luciferase reporter assay
HEK293T cells at 80% confluence in a 24-well plate were transfected with pXP2 Firefly luciferase, pRL-CMV Renilla luciferase, CBFβ, and increasing RUNX1, RUNX1-ETO, or CBFβ-MYH11 (+RUNX1) expression plasmids (0, 10, 50, 100, and 200 ng). Antisense promoter (Chr11:47.381.179-47.381.392, GRCh37/hg19) transactivation was assessed by luciferase activity and measured 48 hours after transfection using the Dual-Glo Luciferase Reporter Assay System (Promega) and normalized to Renilla luciferase activity.
Lentivirus production and gene knockdown
Lentivirus was produced by transfection of HEK293T-LentiX using PEI (Polysciences) of small-hairpin RNA (shRNA)-expressing viral vectors with the packaging plasmids pCMVR8.74 and pMD2.G. Virus-containing supernatants were cleared of cellular debris by 0.45 μm filtration, concentrated and mixed with 8 μg/mL polybrene. Target cells (Kasumi-1 and ME-1) were exposed for at least 48 hours to lentiviral supernatant at a multiplicity of infection (MOI) of 4 before downstream applications. Guide -strand sequences for Renilla (shControl), RUNX1-ETO (shRUNX1-ETO), and PU.1 asRNA (shPU.1as) lentiviral shRNA knockdown (sequences are given in supplemental Table 1) were cloned in an optimized “miRE” context containing green fluorescent protein (GFP).31 For RUNX1-ETO knockdown by small-interfering RNA, Kasumi-1 cells were transfected with RUNX1-ETO or mismatch control small-interfering RNA (sequences are given in supplemental Table 1). Cells were collected 24 hours after transfection for RUNX1-ETO knockdown efficiency assessment depletion and after an additional 40 hours for cross-linking or RNA isolation.32 For shRNA knockdown in hematopoietic stem and progenitor cells (HSPCs), 0.4 × 10⁶ HSPCs were spinoculated 2 times at an MOI of 10 at 800g for 30 minutes with viral supernatant of shRenilla713, shPU.1as, or shRUNX1 and incubated for 48 hours at 37°C. After virus removal, cells were cultured for 72 hours at 37°C, and samples were taken for flow cytometry analysis.
CRISPR/Cas9 genome editing
The guide RNA (gRNA) for double-strand breaks around the PU.1 AsPr were designed by using CHOPCHOP33 and cloned into the DECKO34 (Double Excision CRISPR Knockout) system. Briefly, a 6-oligo assembly using Gibson Assembly was performed by using BsmbI-digested backbone pDECKO-mCherry (Addgene #78534) for inserting the gRNA pair into the intermediate pDECKO plasmid. Next, cloning of the constant and final part composed of the second promoter for gRNA expression was extracted by PCR from pDECKO-mCherry-GFP (Addgene #78535) and cloned into the previously assembled pDECKO plasmid. Kasumi-1 cells were first lentiviral transduced with pDECKO-mCherry-2xgRNA construct and then by CRISPR-Cas9-GFP (Addgene #82416). pLV-mCherry (Addgene #36084) cotransduced with Cas9-GFP was used as a negative control. Cells were sorted by flow cytometry for viable (4′,6-diamidino-2-phenylindole–negative) and GFP+/mCherry+.
RNA-sequencing
Total RNA was prepared by using TRIzol (Ambion) and processed for sequencing by using the NEBNext rRNA Depletion Kit and NEBNEXT Ultra II Direction RNA Library Prep Kit (New England Biolabs) for Illumina sequencing. Raw RNA-sequencing (RNA-seq) reads were processed by using Trim Galore! software (http://www.bioinformatics.babraham.ac.uk/projects/trim_galore/) and aligned to GRCh38 by using STAR software.35 Differential gene expression between groups was calculated by using the R package DESeq2, and a false discovery rate <0.001 was used as the cutoff for differential gene expression. Heatmap data visualization was done by using pheatmap in R statistical environment. Gene Ontology analyses were performed by using Panther.36 Raw RNA-seq data were deposited in the ArrayExpress database (accession number E-MTAB-9016).
Assay for transposase-accessible chromatin sequencing
Chromatin accessibility mapping was performed by using the assay for transposase-accessible chromatin sequencing (ATAC-seq) technology. In brief, 105 cells were washed once in 50 μL phosphate-buffered saline and resuspended in a transposase reaction mix containing 12.5 μL tagment DNA (TD) buffer, 2 μL transposase (Illumina), 10.5 μL nuclease-free water, and 0.01% NP-40. Tagmentation was performed for 30 minutes at 37°C. The optimum number of amplification cycles was estimated by qPCR reaction as previously described.37 Fragments larger than 1200 bp were excluded by using solid phase reversible immobilization (SPRI) size selection (Beckman Coulter). DNA concentration was measured by using a Qubit fluorometer (Life Technologies). Libraries were amplified by using custom Nextera primers38 followed by sequencing using the Illumina HiSeq3000/4000 platform. Data analysis is described in detail in the supplemental Methods.
Precision nuclear run-on sequencing library preparation
Precision nuclear run-on sequencing (PRO-seq) for transcriptionally engaged polymerases in Kasumi-1 was performed after lentiviral shRNA knockdown at an MOI of 4. Isolation of nuclei was performed as previouslydescribed.39 Briefly, 25 × 106 Kasumi-1 cells were collected 48 hours after lentiviral transduction for RUNX1-ETO knockdown and resuspended in cold swelling buffer followed by Dounce homogenization. Cells were centrifuged and washed with lysis buffer. Nuclei were centrifuged and washed again with lysis buffer followed by freezing buffer and stored at −80°C. Nuclear run-on (NRO) assays were performed with 2 biotin-11-NTPs (biotin-11-CTP and biotin-11-UTP; Jena Bioscience) as previously described.40 Briefly, nuclei were thawed on ice while the NRO mix was pre-equilibrated at 30°C. NRO was performed at 30°C, terminated with the addition of TRIzol-LS (Ambion), and followed by RNA nuclear extraction. Nuclear RNA was fragmented by base hydrolysis and enriched for biotin-labeled RNA with streptavidin M280 beads (Invitrogen). Nascent biotinylated RNA was ligated with 3'-VRA RNA adaptor (5'Phos-GAUCGUCGGACUGUAGAACUCUGAAC-3'invdT). Ligated RNA was purified by a second round of streptavidin bead enrichment and ligated with 5'-VRA RNA adapter (5'-CCUUGGCACCCGAGAAUUCCA-3'). Ligated RNA was purified by a third round of streptavidin bead enrichment followed by a reverse transcription step using SuperScript III First-strand synthesis (Invitrogen).
The size and quantity of the cDNA library preparation were assessed by PCR and the number of cycles for library amplification determined. After full-scale PCR amplification, library size selection was performed by cutting out the desired size after migration in 8% acrylamide gel electrophoresis. Raw PRO-seq .fastq files were processed and aligned to GRCh37 using the proseq2.0.bsh script from the Danko laboratory.41 Processed .bam files were sorted and indexed using samtools followed by strand-specific bigwig file generation using deepTools.42 Raw PRO-seq data were deposited in the ArrayExpress database (accession number E-MTAB-9019).
Publicly available data sets
Data from the following publically available data sets were processed: GSE74912 (ATAC-seq for hematopoietic stem, progenitor, and differentiated cells), GSE45144 (RUNX1 chromatin immunoprecipitation sequencing [ChIP-seq] in CD34+ cells), GSE68976 (RUNX1 ChIP-seq in Jurkat cells), GSE62847 (RUNX1 and RUNX1-ETO ChIP-seq in Kasumi-1 cells), GSE108266 (AML patient DNase-seq), GSE29222 (RUNX1-ETO ChIP-seq using an antibody against the C-terminal end of the ETO moiety [from Santa Cruz Biotechnology; sc-9737X]), GSE69239 (RNA-seq for thymic progenitor cells), GSE93995 and GSE122958 (Hi-C in HL-60 and Jurkat), and GSE117107 (Chi-C after RUNX1-ETO depletion in Kasumi-1). ATAC-seq, DNase-seq, and RNA-seq data were analyzed as described earlier, with ATAC-seq and DNase-seq following the same URE normalization. Raw ChIP-seq reads were controlled and adapter trimmed by using Trim Galore! software and mapped against GRCh37 using bowtie2. Multimappers and reads with bad mapping quality were removed using samtools, and peak calling was performed by MACS2. Hi-C and capture Hi-C data were trimmed using trim option of homerTools followed by alignment to hg19 by bowtie2 and tag directory creation by HOMER. Data were visualized by using HOMER’s analyzeHiC and TreeView3 software.
Chromosomal conformation capture
For chromosomal conformation capture (3C), 50 × 106 cells were prepared for chromatin cross-linking (HL60, Jurkat, and Kasumi-1) and centrifuged for 10 minutes at 200g. Briefly, cell pellets were then resuspended in 21.7 mL fresh cell culture medium. Then, 1445 µL of 16% formaldehyde (vol/vol) was added to cross-link cells, gently mixed by pipetting and incubated at room temperature for 10 minutes. A total of 1.25 mL of 2.5 M glycin was added, incubated for 5 minutes at room temperature, and followed by 15 minutes on ice to stop cross-linking completely. Cross-linked cells were centrifuged for 10 minutes at 400g, supernatant was removed, and cells were quick-frozen on dry ice.
Statistical analysis
Statistical analyses were performed by using GraphPad Prism version 6.0.0 for Windows (GraphPad Software) and R 4.0 (R Foundation for Statistical Computing). Student t test and Wilcoxon test were used to compare differences between 2 groups. Log-rank tests were calculated for survival differences in xenograft experiments. Values of P <.05 were considered statistically significant. In silico transcription factor binding analysis was performed by using TFBind (http://tfbind.hgc.jp/).43
Results
To examine the developmental activation of the PU.1 locus (Figure 1A) throughout all human hematopoietic differentiation stages (Figure 1B), publicly available ATAC-seq data were analyzed.44 We identified highly versatile cell type–specific accessibilities at a conserved region in intron 3 that we previously identified as a promoter of a long noncoding antisense transcript (asRNA).26 Moreover, for in-depth analysis of sense (mRNA) and antisense transcript levels, compartment-enriched Northern Blot, strand-specific RT-qPCR quantification assays were performed (supplemental Figure 1A-F; supplemental Table 1); RT-qPCR was performed on sorted bone marrow progenitor and mature peripheral blood cells (supplemental Figure 1G-K; supplemental Tables 2-3). During early myelopoiesis, chromatin accessibility at the proximal promoter (PrPr) stayed constant compared with the AsPr (Figure 1C). Quantification of chromatin accessibility and transcript expression revealed that during myelopoiesis, progenitors and differentiated cells constantly displayed higher PrPr accessibility and mRNA transcription compared with AsPr accessibility and asRNA expression (Figure 1D). In contrast, during lymphopoiesis, we found high AsPr accessibility and asRNA expression in lymphoid-primed multipotent progenitor and common lymphoid progenitor populations, which preceded the single-promoter accessibility in B cells and the complete locus shutdown in T cells (Figure 1E-F). Although myeloid and B-lymphoid differentiation displayed comparable accessibility and expression patterns, B cells showed a decreased PrPr accessibility and decreased PU.1 mRNA expression compared with its myeloid counterparts. We therefore decided to focus our efforts on understanding the role of PU.1 AsPr and asRNA in T-lymphoid development.
![Activation of PU.1 antisense transcription during early lymphopoiesis. (A) Schematic of PU.1 locus: AsPr (red arrow box), PrPr (blue arrow box), asRNA (red line), coding mRNA (blue line), and −17 kb enhancer (URE, gray box). (B) Human hematopoietic cell differentiation hierarchy. (C) Aligned reads from ATAC-seq of PU.1 locus during myelopoiesis. (D) URE-adjusted peak quantification values for AsPr and PrPr by ATAC-seq (upper panel, purple and steel blue respectively) and PU.1 asRNA and mRNA (red and blue, respectively) transcript profile (lower panel) for each population during myelopoiesis (population, replicates for ATAC-seq/RT-qPCR; hematopoietic stem cell and multipotent progenitor [HSC-MPP], n = 13/9; common myeloid progenitor [CMP], n = 8/8; granulocyte-macrophage progenitor [GMP], n = 7/9; megakaryocyte-erythroid progenitor [MEP], n = 7/10; monocyte, n = 6/6). (E) Aligned reads from ATAC-seq of PU.1 locus during lymphopoiesis. (F) URE-adjusted peak quantification values for AsPr and PrPr by ATAC-seq and PU.1 asRNA and mRNA transcript profile for each population during lymphopoiesis. Ratio of AsPr to PrPr (yellow) and asRNA to mRNA (brown) for each population in myelopoiesis (G) and lymphopoiesis (H). (I) Correlation analysis of promoter chromatin accessibility ratios to transcript expression ratios. Regression line with Pearson correlation coefficient. Promoter and transcript ratio analysis in bone marrow hematopoietic progenitors for AsPr/PrPr chromatin accessibility ratio (J) and asRNA/mRNA transcript expression ratio (K). Data are represented as mean ± standard error of the mean. *P < .05, **P < .01, ***P < .001, Wilcoxon test. CLP, common lymphoid progenitor; Erythr., erythrocyte; Gran., granulocyte; LMPP, lymphoid-primed multipotent progenitor; Mono., monocyte; Plat., platelet.](https://ash.silverchair-cdn.com/ash/content_public/journal/blood/138/15/10.1182_blood.2020008971/6/m_bloodbld2020008971f1.png?Expires=1769987129&Signature=KmtAmV2~G2KdUte4TrCbWp9aKE3zbYH6dWYOLffsqiGCgVVfbKH6UZs5RAe1VzULgcgMVxigkdZ9NhmING6y6iWJf9pL8ixUa88AT6Bues9hG0mt3e2R1UVpDch8ZJZ2hjLYW2q53TW6UBZJsCNEnvuMcojKqnc-NTMaS62153PLSm8zk1psYBFYD3kReAhe8hTlg~I~ajSfCQbN-iEBCDHZlgtvQQmMrTZ1VtYmLw9Zc0bBkCI5fZLbuciXuGMFP7MFXEXJRQa7XTXKUsuDBAKuqayJmH1nzSXZjS9uUO0zoF5VT5Z173wcdRbLnG2nwcnq9r-PqJoqhPsCqEFdwg__&Key-Pair-Id=APKAIE5G5CRDK6RD3PGA)
Activation of PU.1 antisense transcription during early lymphopoiesis. (A) Schematic of PU.1 locus: AsPr (red arrow box), PrPr (blue arrow box), asRNA (red line), coding mRNA (blue line), and −17 kb enhancer (URE, gray box). (B) Human hematopoietic cell differentiation hierarchy. (C) Aligned reads from ATAC-seq of PU.1 locus during myelopoiesis. (D) URE-adjusted peak quantification values for AsPr and PrPr by ATAC-seq (upper panel, purple and steel blue respectively) and PU.1 asRNA and mRNA (red and blue, respectively) transcript profile (lower panel) for each population during myelopoiesis (population, replicates for ATAC-seq/RT-qPCR; hematopoietic stem cell and multipotent progenitor [HSC-MPP], n = 13/9; common myeloid progenitor [CMP], n = 8/8; granulocyte-macrophage progenitor [GMP], n = 7/9; megakaryocyte-erythroid progenitor [MEP], n = 7/10; monocyte, n = 6/6). (E) Aligned reads from ATAC-seq of PU.1 locus during lymphopoiesis. (F) URE-adjusted peak quantification values for AsPr and PrPr by ATAC-seq and PU.1 asRNA and mRNA transcript profile for each population during lymphopoiesis. Ratio of AsPr to PrPr (yellow) and asRNA to mRNA (brown) for each population in myelopoiesis (G) and lymphopoiesis (H). (I) Correlation analysis of promoter chromatin accessibility ratios to transcript expression ratios. Regression line with Pearson correlation coefficient. Promoter and transcript ratio analysis in bone marrow hematopoietic progenitors for AsPr/PrPr chromatin accessibility ratio (J) and asRNA/mRNA transcript expression ratio (K). Data are represented as mean ± standard error of the mean. *P < .05, **P < .01, ***P < .001, Wilcoxon test. CLP, common lymphoid progenitor; Erythr., erythrocyte; Gran., granulocyte; LMPP, lymphoid-primed multipotent progenitor; Mono., monocyte; Plat., platelet.
Activation of PU.1 antisense transcription during early lymphopoiesis. (A) Schematic of PU.1 locus: AsPr (red arrow box), PrPr (blue arrow box), asRNA (red line), coding mRNA (blue line), and −17 kb enhancer (URE, gray box). (B) Human hematopoietic cell differentiation hierarchy. (C) Aligned reads from ATAC-seq of PU.1 locus during myelopoiesis. (D) URE-adjusted peak quantification values for AsPr and PrPr by ATAC-seq (upper panel, purple and steel blue respectively) and PU.1 asRNA and mRNA (red and blue, respectively) transcript profile (lower panel) for each population during myelopoiesis (population, replicates for ATAC-seq/RT-qPCR; hematopoietic stem cell and multipotent progenitor [HSC-MPP], n = 13/9; common myeloid progenitor [CMP], n = 8/8; granulocyte-macrophage progenitor [GMP], n = 7/9; megakaryocyte-erythroid progenitor [MEP], n = 7/10; monocyte, n = 6/6). (E) Aligned reads from ATAC-seq of PU.1 locus during lymphopoiesis. (F) URE-adjusted peak quantification values for AsPr and PrPr by ATAC-seq and PU.1 asRNA and mRNA transcript profile for each population during lymphopoiesis. Ratio of AsPr to PrPr (yellow) and asRNA to mRNA (brown) for each population in myelopoiesis (G) and lymphopoiesis (H). (I) Correlation analysis of promoter chromatin accessibility ratios to transcript expression ratios. Regression line with Pearson correlation coefficient. Promoter and transcript ratio analysis in bone marrow hematopoietic progenitors for AsPr/PrPr chromatin accessibility ratio (J) and asRNA/mRNA transcript expression ratio (K). Data are represented as mean ± standard error of the mean. *P < .05, **P < .01, ***P < .001, Wilcoxon test. CLP, common lymphoid progenitor; Erythr., erythrocyte; Gran., granulocyte; LMPP, lymphoid-primed multipotent progenitor; Mono., monocyte; Plat., platelet.
To better evaluate the divergence of the PU.1 locus, we calculated ratios of AsPr/PrPr accessibility and asRNA/mRNA expression. This analysis revealed a constant ratio for PU.1 promoters and transcripts during myelopoiesis (Figure 1G). However, we found a striking AsPr and asRNA increase during early lymphopoiesis reaching a peak before mature lymphoid cell differentiation (Figure 1H). Promoter accessibility ratios and transcript expression ratios showed a strong correlation for each population (Figure 1I). Increased AsPr/PrPr accessibility ratios (Figure 1J) and increased asRNA/mRNA transcript ratios (Figure 1K) distinguished lymphoid from myeloid populations during blood cell differentiation. Thus, the antisense/sense transcription ratio indicates cellular fate in hematopoiesis.
To explore the mechanisms that drive asRNA transcription, we investigated the expression levels of hematopoietic transcription factors during thymic differentiation (Figure 2A). Transcription factor motif searches in the PU.1 AsPr43 region ranked RUNX1 as the top binding hematopoietic transcription factor (Figure 2B; supplemental Figure 2A). Thorough investigation of thymic progenitor cells gene expression data45 did not reveal a role in PU.1 regulation of other relevant hematopoietic regulators such as ETS and Ebox transcription factors (supplemental Figure 2B-D). In contrast, increasing RUNX1 factor expression correlated with the decreasing PU.1 expression in early thymic progenitors, CD1a– pro-T and CD1a+ pro-T cells (Figure 2C-D). Both T-lymphoid Jurkat and CD34+ HSPCs showed RUNX1 binding at PU.1 AsPr according to ChIP-seq (Figure 2E-F).46,47 In line with phenotypic findings of RUNX1 conditional knockout mice that exhibited unaltered stem and progenitor populations,48 shRNA-mediated knockdown of RUNX1 in cultured human CD34+ HSPCs did not induce any changes in the hematopoietic cell populations (supplemental Figure 2E-F). Moreover, electromobility shift assays using Jurkat cell extracts showed that RUNX1 binding was indeed mediated by the RUNX-binding site in the PU.1 AsPr (Figure 2G).
![CBFs activate PU.1 AsPr. (A) Schematic of the human thymic T-lymphoid differentiation hierarchy. (B) Schematic representation of the PU.1 locus with the AsPr containing a consensus RUNX-binding site (black square) and the genomic coordinates in GRCh37/hg19. Gene expression by transcript sequencing (RNA-seq) in thymic progenitors and differentiated T cells (pro-T, CD1a– pro-T cell; CD1a, CD1a+ pro–T cell; DP, double-positive CD4+/CD8+ T cell; CD4, CD4+ T cell; CD8, CD8+ T cell) for PU.1 (C) and RUNX1 (D) (n = 2). Data are represented as RPKM normalized to GAPDH housekeeping gene. RUNX1 ChIP-seq in Jurkat (E) and CD34+ (F) HSPCs (with immunoglobulin G control). (G) Gel electromobility shift assay with labeled PU.1 AsPr probe oligonucleotide in the presence of RUNX1 (Jurkat cell line). Luciferase reporter assays in HEK293T cells transiently transfected with PU.1 AsPr reporter plasmid and increasing RUNX1 (H), RUNX1-ETO (I), and CBFβ-MYH11 (J) expression plasmids (plasmid concentration [nanogram], n = 4). Data are represented as mean ± standard error of the mean. *P < .05, **P < .01, ***P < .001, Student t test. CLP, common lymphoid progenitor; ETP, early thymic progenitor; HSC-MPP, hematopoietic stem cell and multipotent progenitor; LMPP, lymphoid-primed multipotent progenitor; RUNX compet. Probe, the competition probe with mutated RUNX binding site.](https://ash.silverchair-cdn.com/ash/content_public/journal/blood/138/15/10.1182_blood.2020008971/6/m_bloodbld2020008971f2.png?Expires=1769987129&Signature=aVVGoakGbpKllOmS-z9oG6cnKnBn9XYfVDMbxwu2mhJfLduDdpTef0bL~DpDw86Y6ysgfIo-7ZCwOVz1utzd4WAtuFZX7TYcve0xsg9jHVhEYOdDNJF~3gENBFqGAQSjnMaNvd5BebnWNOPoBKQhAb1y4eFrven3Wi-HwVNQ45h78AjdkFhshIRzwNLD0VdJHn4DsiXkptL5XsqNc02C5Hcs6SJrhRHsW1SsUTC7kkWaJR2s5OVQDAQdSpmW8ftYn-jLqPsbyL2Be3SY4Ydr6ZXk4iSrzNvf61sneu6aBlG7XajIdGDUgfJeLMFdTX-iaRkP0GDzYMRjEN5uaxkBQw__&Key-Pair-Id=APKAIE5G5CRDK6RD3PGA)
CBFs activate PU.1 AsPr. (A) Schematic of the human thymic T-lymphoid differentiation hierarchy. (B) Schematic representation of the PU.1 locus with the AsPr containing a consensus RUNX-binding site (black square) and the genomic coordinates in GRCh37/hg19. Gene expression by transcript sequencing (RNA-seq) in thymic progenitors and differentiated T cells (pro-T, CD1a– pro-T cell; CD1a, CD1a+ pro–T cell; DP, double-positive CD4+/CD8+ T cell; CD4, CD4+ T cell; CD8, CD8+ T cell) for PU.1 (C) and RUNX1 (D) (n = 2). Data are represented as RPKM normalized to GAPDH housekeeping gene. RUNX1 ChIP-seq in Jurkat (E) and CD34+ (F) HSPCs (with immunoglobulin G control). (G) Gel electromobility shift assay with labeled PU.1 AsPr probe oligonucleotide in the presence of RUNX1 (Jurkat cell line). Luciferase reporter assays in HEK293T cells transiently transfected with PU.1 AsPr reporter plasmid and increasing RUNX1 (H), RUNX1-ETO (I), and CBFβ-MYH11 (J) expression plasmids (plasmid concentration [nanogram], n = 4). Data are represented as mean ± standard error of the mean. *P < .05, **P < .01, ***P < .001, Student t test. CLP, common lymphoid progenitor; ETP, early thymic progenitor; HSC-MPP, hematopoietic stem cell and multipotent progenitor; LMPP, lymphoid-primed multipotent progenitor; RUNX compet. Probe, the competition probe with mutated RUNX binding site.
CBFs activate PU.1 AsPr. (A) Schematic of the human thymic T-lymphoid differentiation hierarchy. (B) Schematic representation of the PU.1 locus with the AsPr containing a consensus RUNX-binding site (black square) and the genomic coordinates in GRCh37/hg19. Gene expression by transcript sequencing (RNA-seq) in thymic progenitors and differentiated T cells (pro-T, CD1a– pro-T cell; CD1a, CD1a+ pro–T cell; DP, double-positive CD4+/CD8+ T cell; CD4, CD4+ T cell; CD8, CD8+ T cell) for PU.1 (C) and RUNX1 (D) (n = 2). Data are represented as RPKM normalized to GAPDH housekeeping gene. RUNX1 ChIP-seq in Jurkat (E) and CD34+ (F) HSPCs (with immunoglobulin G control). (G) Gel electromobility shift assay with labeled PU.1 AsPr probe oligonucleotide in the presence of RUNX1 (Jurkat cell line). Luciferase reporter assays in HEK293T cells transiently transfected with PU.1 AsPr reporter plasmid and increasing RUNX1 (H), RUNX1-ETO (I), and CBFβ-MYH11 (J) expression plasmids (plasmid concentration [nanogram], n = 4). Data are represented as mean ± standard error of the mean. *P < .05, **P < .01, ***P < .001, Student t test. CLP, common lymphoid progenitor; ETP, early thymic progenitor; HSC-MPP, hematopoietic stem cell and multipotent progenitor; LMPP, lymphoid-primed multipotent progenitor; RUNX compet. Probe, the competition probe with mutated RUNX binding site.
We next designed a luciferase reporter assay in HEK293T cells transiently transfected with reporter plasmids containing PU.1 AsPr and analyzed transactivation activity with increasing concentrations of each RUNX factor. RUNX1 indeed showed dose-dependent AsPr transactivation (Figure 2H; supplemental Figure 2G). RUNX factors (CBFs) are frequently altered in human leukemia, most commonly as t(8;21)(q22;q22) or inv(16)(p13;q22) chromosomal translocations of so-called CBF leukemias accounting for 15% of all AML cases.2,4 We therefore tested the oncogenic fusion proteins RUNX1-ETO [t(8;21)] and CBFβ-MYH11 (inv16) in our luciferase assay for PU.1 AsPr transactivation and found, similarly to wild-type RUNX1, that RUNX1-ETO and CBFβ-MYH11 fusions dose dependently induced transactivation of PU.1 AsPr (Figure 2I-J). These experiments show that PU.1 AsPr can be bound and activated by RUNX1 and by leukemic CBF-fusion proteins.
To investigate if the ratio of antisense/sense transcription is altered in CBF leukemia, we analyzed PU.1 mRNA and asRNA expression in patient samples of normal karyotype AML (NK-AML), CBF-AML, and CD34-enriched healthy bone marrow samples. Strikingly, we found elevated PU.1 asRNA, resulting in a significantly increased asRNA/mRNA ratio in patients with CBF-AML (Figure 3A-C; supplemental Figure 3A). Similarly, we examined open chromatin regions of PU.1 determined in patient samples by using DNaseI-sequencing (DNase-seq).49 Compared with NK-AML, increased AsPr DNase hypersensitivity sites were found in t(8;21) and inv(16) CBF-AML subgroups and increased AsPr/PrPr promoter DNase hypersensitivity site ratios in t(8;21) alone (Figure 3D-F; supplemental Figure 3B). It is worth nothing that differentiation status, based on the French-American-British classification system,50 of the AML patient cohort did not have an impact on the PU.1 asRNA/mRNA expression ratio (Figure 3G).
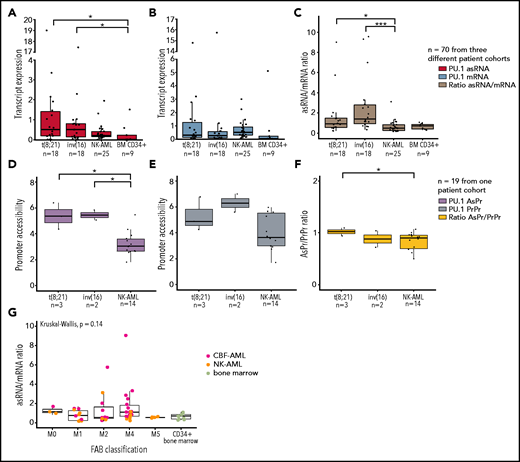
PU.1 antisense transcript is activated in CBF leukemia patients. Transcript quantification of 3 patient cohorts for PU.1 antisense (asRNA, red) (A), mRNA (blue) (B), and asRNA/mRNA ratios (brown) (C) in t(8;21) AML (n = 18), inv(16) AML (n = 18), normal karyotype AML (NK-AML, n = 25), and healthy bone marrow samples. Promoter quantification for PU.1 AsPr (purple) (D), PrPr (steel blue) (E), and AsPr/PrPr (yellow) (F) ratio calculation in t(8;21) AML (n = 3), inv(16) AML (n = 2), and normal karyotype AML (NK-AML, n = 19) samples. (G) PU.1 asRNA/mRNA ratio expression relative to the French-American-British (FAB) classification for CBF-AML, NK-AML, and healthy CD34+ bone marrow samples from 2 patient cohorts (n = 55). Data are represented as mean ± standard error of the mean . *P < .05, ***P < .001, Wilcoxon and Student t tests.
PU.1 antisense transcript is activated in CBF leukemia patients. Transcript quantification of 3 patient cohorts for PU.1 antisense (asRNA, red) (A), mRNA (blue) (B), and asRNA/mRNA ratios (brown) (C) in t(8;21) AML (n = 18), inv(16) AML (n = 18), normal karyotype AML (NK-AML, n = 25), and healthy bone marrow samples. Promoter quantification for PU.1 AsPr (purple) (D), PrPr (steel blue) (E), and AsPr/PrPr (yellow) (F) ratio calculation in t(8;21) AML (n = 3), inv(16) AML (n = 2), and normal karyotype AML (NK-AML, n = 19) samples. (G) PU.1 asRNA/mRNA ratio expression relative to the French-American-British (FAB) classification for CBF-AML, NK-AML, and healthy CD34+ bone marrow samples from 2 patient cohorts (n = 55). Data are represented as mean ± standard error of the mean . *P < .05, ***P < .001, Wilcoxon and Student t tests.
To probe the functional relevance of PU.1 asRNA in normal hematopoiesis and CBF-AML, we depleted PU.1 asRNA in cultivated human CD34+ HSPCs and the t(8;21) leukemic Kasumi-1 cell line using lentiviral shRNA31 (supplemental Figure 3C-D). This knockdown resulted in myeloid lineage skewing in HSPCs, which suggests a role of PU.1 asRNA in early lymphoid differentiation (supplemental Figure 3E-G). We validated those findings in murine LSK (Lin- Sca-1+ c-kit+) cells with a humanized PU.1 locus, which were cocultured with OP9-DL1 stromal cells for T-lymphoid differentiation (supplemental Figure 3H), and found a complete loss of T-lymphoid cells upon PU.1 asRNA knockdown (supplemental Figure 3I-J). Next, we depleted PU.1 asRNA in Kasumi-1 cells, leading to an increase in CD14 (Figure 4A) and a loss of CD34 surface marker expression (supplemental Figure 4A), characteristic for differentiated and immature cells, respectively. Concomitantly, a decreased PU.1 asRNA and increased PU.1 mRNA expression was observed (Figure 4B). To rule out off-target effects of the shRNA system, we used the DECKO CRISPR system34 cotransduced with Cas9-GFP for a PU.1 AsPr knockout and RUNX binding site (RUNXBS) in Kasumi-1 cells (Figure 4C; supplemental Figure 4B). Analogous to the shRNA experiment, increased CD14 expression was observed, indicating that AsPr-knockout and RUNXBS-knockout cells entered myeloid differentiation (Figure 4D-E; supplemental Figure 4C-D). These cells were sorted for CD14 negative and positive populations in which PU.1 transcripts were quantified. Although no difference in asRNA/mRNA expression ratio was detected in the CD14–population, the ratio was significantly decreased in the CD14+ population (Figure 4F; supplemental Figure 4E-G).
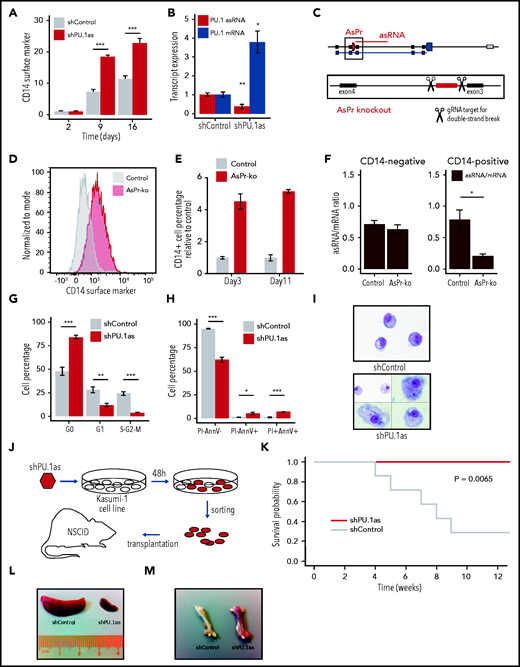
PU.1 antisense drives leukemia in RUNX1-ETO cells. (A) Fluorescence-activated cell sorting (FACS) analysis for CD14 surface marker expression and cell viability kinetics after shRNA-mediated knockdown shPU.1as in Kasumi-1 (n = 4). (B) PU.1 mRNA and asRNA expression in Kasumi-1 after shPU.1as in Kasumi-1 (n = 4). Also shown is the antisense transcription start site. (C) Schematic representation of the PU.1 locus with the AsPr (red arrow box) regulating asRNA (red line) and the double-strand break locations for CRISPR/Cas9-mediated AsPr knockout. (D) FACS analysis for CD14 surface marker expression after AsPr knockout (AsPr-ko) in Kasumi-1 (merged n = 4). (E) Kinetics of CD14 surface marker expression after AsPr-ko in Kasumi-1 (n = 4). (F) PU.1 asRNA/mRNA ratio (brown) after AsPr-ko in CD14– and CD14+ Kasumi-1 cells (n = 4). Assays for cell cycle stages after shPU.1as (G) and cell viability (H) (n = 4) in Kasumi-1 cells (shControl, n = 5; shPU.1as, n = 6). (I) May Grünwald/Giemsa cytospins for morphology analysis of Kasumi-1 cells. (J) Experimental workflow of shRNA knockdown of PU.1 antisense RNA (shPU.1as) in Kasumi-1 followed by FACS and xenografting into immunodeficient (NOD/SCID) mice. (K) Survival probability of NOD-SCID mice xenografted with Kasumi-1 cells after shPU.1as vs shControl (n = 7). Leukemic cells infiltration in spleen (L) and bone (M) samples from mice transplanted with Kasumi-1 cells. Data are represented as mean ± standard error of the mean. *P < .05, **P < .01, ***P < .001, Student t test. AnnV, Annexin V; PI, propidium iodide.
PU.1 antisense drives leukemia in RUNX1-ETO cells. (A) Fluorescence-activated cell sorting (FACS) analysis for CD14 surface marker expression and cell viability kinetics after shRNA-mediated knockdown shPU.1as in Kasumi-1 (n = 4). (B) PU.1 mRNA and asRNA expression in Kasumi-1 after shPU.1as in Kasumi-1 (n = 4). Also shown is the antisense transcription start site. (C) Schematic representation of the PU.1 locus with the AsPr (red arrow box) regulating asRNA (red line) and the double-strand break locations for CRISPR/Cas9-mediated AsPr knockout. (D) FACS analysis for CD14 surface marker expression after AsPr knockout (AsPr-ko) in Kasumi-1 (merged n = 4). (E) Kinetics of CD14 surface marker expression after AsPr-ko in Kasumi-1 (n = 4). (F) PU.1 asRNA/mRNA ratio (brown) after AsPr-ko in CD14– and CD14+ Kasumi-1 cells (n = 4). Assays for cell cycle stages after shPU.1as (G) and cell viability (H) (n = 4) in Kasumi-1 cells (shControl, n = 5; shPU.1as, n = 6). (I) May Grünwald/Giemsa cytospins for morphology analysis of Kasumi-1 cells. (J) Experimental workflow of shRNA knockdown of PU.1 antisense RNA (shPU.1as) in Kasumi-1 followed by FACS and xenografting into immunodeficient (NOD/SCID) mice. (K) Survival probability of NOD-SCID mice xenografted with Kasumi-1 cells after shPU.1as vs shControl (n = 7). Leukemic cells infiltration in spleen (L) and bone (M) samples from mice transplanted with Kasumi-1 cells. Data are represented as mean ± standard error of the mean. *P < .05, **P < .01, ***P < .001, Student t test. AnnV, Annexin V; PI, propidium iodide.
To determine the biologic relevance of PU.1 asRNA expression in CBF-AML, we performed in vitro and in vivo shRNA-mediated knockdown experiments. Knockdown of PU.1 asRNA in Kasumi-1 and ME-1 cells led to a PU.1 mRNA increase (supplemental Figure 4H),21,51 cell cycle arrest (Figure 4G), increased apoptosis (Figure 4H; supplemental Figure 4I), and induced differentiation (Figure 4I; supplemental Figure 4J-L). Consequently, transplantation of PU.1 asRNA depleted Kasumi-1 cells in NOD/SCID mice completely rescued the disease phenotype (Figure 4J-K) and reduced splenomegaly and bone leukemic infiltration (Figure 4L-M). These data suggest that PU.1 antisense transcription plays a crucial role in CBF-AML.
To further dissect the mechanism of how CBFs could drive PU.1 antisense transcription, we first depleted RUNX1-ETO using lentiviral shRNA knockdown (shRUNX1-ETO) in t(8;21) Kasumi-1 cells (Figure 5A-B; supplemental Figure 5A-B). Similar to PU.1 antisense depletion (supplemental Figure 4A), RUNX1-ETO depletion resulted in a loss of CD34 surface marker expression and a drop in cell viability (Figure 5C; supplemental Figure 5C-D). Moreover, Giemsa staining of isolated targeted Kasumi-1 cells identified a mature myeloid differentiation phenotype compared with controls (Figure 5D). RNA-seq confirmed a switch toward myeloid differentiation after RUNX1-ETO depletion (Figure 5E; supplemental Figure 5E) accompanied by increased PU.1, decreased CD34 expression, and global changes in gene expression favoring myeloid differentiation (Figure 5F).
![Oncogenic CBFs shift PU.1 sense to antisense transcription. (A) Scheme of small-hairpin RUNX1-ETO knockdown (shRUNX1-ETO) and control (shControl) designs. (B) RUNX1-ETO RT-qPCR after RUNX1-ETO knockdown at day 2 and day 9 in Kasumi-1 cells relative to GAPDH housekeeping gene (biological triplicates). (C) CD34 surface marker and viability kinetics assessed by flow cytometry after shRUNX1-ETO in Kasumi-1 cells (biological duplicates). (D) May Grünwald/Giemsa cytospins for morphology analysis of Kasumi-1 cells. (E) Heatmap of gene expression by RNA-seq after shRUNX1-ETO in Kasumi-1 at day 2 and day 9 (biological triplicates, n = 5810 genes; cutoff false discovery rate [FDR] <0.001). Gene expression of shRUNX1-ETO day 9 compared with shControl day 2 to day 9 and shRUNX1-ETO day 2. (F) Upregulated and downregulated genes involved in myeloid differentiation (red and yellow, respectively) using RNA-seq after shRUNX1-ETO in Kasumi-1 cells at day 9 vs shControl day 2 to day 9. (G) PU.1 asRNA and mRNA transcript expression after shRUNX1-ETO in Kasumi-1 cells (2 days after lentiviral transduction, n = 6) and AI-10-49 inhibitor treatment of ME-1 cells (6 hours after treatment, biological triplicates). (H) Ratio of PU.1 asRNA and mRNA transcript expression after shRUNX1-ETO in Kasumi-1 cells and AI-10-49 inhibitor treatment in ME-1 cells. (I) Aligned reads of PRO-seq with quantified peaks for PU.1 AsPr, PrPr, and AsPr/PrPr ratio after shRUNX1-ETO in Kasumi-1 cells (2 days after lentiviral transduction, n = 6). (J) Aligned PRO-seq reads after RUNX1-ETO knockdown start at the RUNX-binding site in PU.1 AsPr. Data are represented as mean ± standard error of the mean. *P < .05, ***P < .001, Student t test.](https://ash.silverchair-cdn.com/ash/content_public/journal/blood/138/15/10.1182_blood.2020008971/6/m_bloodbld2020008971f5.png?Expires=1769987129&Signature=qM2IhXpPH61YvOf9dVL~Q76OQFwFXyX-i64TMeambn0MC86bd~BcqfRnd4nq7qbCGvkAjEF6eAKtGZlWRfKhVrhPFTqdVn93i0s8OHdiUBqtMNfNqTYLkCOYxGnOHzvXTZByCwq5KLZTj4ThLcpLP7ChPqNgiWCgVydghjmcB0Jwsl8AgbVtLVK~hIkUs~OaZmQNEK58jn3D6fIzZ8mSPyKZRM~g02Po2QEB0jwrltbYMJhj80dqjdO3pr8v8cpD7K9-bglDExj2LhwEF0IdlZScPddQJ8MuiEBt-GqQpdNua7TgNf7BlWLm5VxKh91epsoOHiCLDB25oPv0oxey6w__&Key-Pair-Id=APKAIE5G5CRDK6RD3PGA)
Oncogenic CBFs shift PU.1 sense to antisense transcription. (A) Scheme of small-hairpin RUNX1-ETO knockdown (shRUNX1-ETO) and control (shControl) designs. (B) RUNX1-ETO RT-qPCR after RUNX1-ETO knockdown at day 2 and day 9 in Kasumi-1 cells relative to GAPDH housekeeping gene (biological triplicates). (C) CD34 surface marker and viability kinetics assessed by flow cytometry after shRUNX1-ETO in Kasumi-1 cells (biological duplicates). (D) May Grünwald/Giemsa cytospins for morphology analysis of Kasumi-1 cells. (E) Heatmap of gene expression by RNA-seq after shRUNX1-ETO in Kasumi-1 at day 2 and day 9 (biological triplicates, n = 5810 genes; cutoff false discovery rate [FDR] <0.001). Gene expression of shRUNX1-ETO day 9 compared with shControl day 2 to day 9 and shRUNX1-ETO day 2. (F) Upregulated and downregulated genes involved in myeloid differentiation (red and yellow, respectively) using RNA-seq after shRUNX1-ETO in Kasumi-1 cells at day 9 vs shControl day 2 to day 9. (G) PU.1 asRNA and mRNA transcript expression after shRUNX1-ETO in Kasumi-1 cells (2 days after lentiviral transduction, n = 6) and AI-10-49 inhibitor treatment of ME-1 cells (6 hours after treatment, biological triplicates). (H) Ratio of PU.1 asRNA and mRNA transcript expression after shRUNX1-ETO in Kasumi-1 cells and AI-10-49 inhibitor treatment in ME-1 cells. (I) Aligned reads of PRO-seq with quantified peaks for PU.1 AsPr, PrPr, and AsPr/PrPr ratio after shRUNX1-ETO in Kasumi-1 cells (2 days after lentiviral transduction, n = 6). (J) Aligned PRO-seq reads after RUNX1-ETO knockdown start at the RUNX-binding site in PU.1 AsPr. Data are represented as mean ± standard error of the mean. *P < .05, ***P < .001, Student t test.
Oncogenic CBFs shift PU.1 sense to antisense transcription. (A) Scheme of small-hairpin RUNX1-ETO knockdown (shRUNX1-ETO) and control (shControl) designs. (B) RUNX1-ETO RT-qPCR after RUNX1-ETO knockdown at day 2 and day 9 in Kasumi-1 cells relative to GAPDH housekeeping gene (biological triplicates). (C) CD34 surface marker and viability kinetics assessed by flow cytometry after shRUNX1-ETO in Kasumi-1 cells (biological duplicates). (D) May Grünwald/Giemsa cytospins for morphology analysis of Kasumi-1 cells. (E) Heatmap of gene expression by RNA-seq after shRUNX1-ETO in Kasumi-1 at day 2 and day 9 (biological triplicates, n = 5810 genes; cutoff false discovery rate [FDR] <0.001). Gene expression of shRUNX1-ETO day 9 compared with shControl day 2 to day 9 and shRUNX1-ETO day 2. (F) Upregulated and downregulated genes involved in myeloid differentiation (red and yellow, respectively) using RNA-seq after shRUNX1-ETO in Kasumi-1 cells at day 9 vs shControl day 2 to day 9. (G) PU.1 asRNA and mRNA transcript expression after shRUNX1-ETO in Kasumi-1 cells (2 days after lentiviral transduction, n = 6) and AI-10-49 inhibitor treatment of ME-1 cells (6 hours after treatment, biological triplicates). (H) Ratio of PU.1 asRNA and mRNA transcript expression after shRUNX1-ETO in Kasumi-1 cells and AI-10-49 inhibitor treatment in ME-1 cells. (I) Aligned reads of PRO-seq with quantified peaks for PU.1 AsPr, PrPr, and AsPr/PrPr ratio after shRUNX1-ETO in Kasumi-1 cells (2 days after lentiviral transduction, n = 6). (J) Aligned PRO-seq reads after RUNX1-ETO knockdown start at the RUNX-binding site in PU.1 AsPr. Data are represented as mean ± standard error of the mean. *P < .05, ***P < .001, Student t test.
We next investigated PU.1 AsPr and PrPr chromatin accessibility and corresponding transcript levels in Kasumi-1 (t8;21) and ME-1 (inv16) cells after RUNX1-ETO knockdown or after specific CBFβ-MYH11 inhibition using a small molecule inhibitor of oncoprotein multimerization (AI-10-49),52,53 respectively. After RUNX1-ETO depletion and CBFβ-MYH11 inhibition, we identified decreased AsPr and increased PrPr accessibility resulting in a decreased AsPr/PrPr ratio (supplemental Figure 5F-G), which was accompanied by decreased PU.1 asRNA and increased PU.1 mRNA levels (Figure 5G-H). To directly detect strand-specific effects of RUNX1-ETO on transcription, PRO-seq mapping of active RNA polymerases was used. Quantified PRO-seq reads at the AsPr decreased after RUNX1-ETO depletion in Kasumi-1 cells, leading to reduced AsPr/PrPr ratios (Figure 5I). It is worth noting that the aligned PRO-seq reads started at the previously identified RUNX-binding site at the PU.1 AsPr (Figure 5J). These data show that loss of CBFs is accompanied by a shift from PU.1 sense to antisense transcription.
The −17 kb URE creates a regulatory loop with PU.1 PrPr for mRNA expression.21 We hypothesized that a shift in loop formation toward URE and AsPr instead of PrPr might account for the shift from sense toward antisense transcription in T-cell progenitors (Figure 1E-F). To test this hypothesis, we examined 3C sequencing (Hi-C) data from early T-lymphoid (Jurkat)54 and myeloid (HL-60)55 cell lines and analyzed PU.1 locus loop formations. Although T-lymphoid cells showed an interaction of the URE with intron 3 at the AsPr region, myeloid cells displayed an open locus with a URE–PrPr interaction (Figure 6A). We therefore performed in-depth analyses of interacting PU.1 chromosomal structures in both cell lines using 3C assays (Figure 6B). Quantification of URE to AsPr (URE-AsPr) and URE to PrPr (URE-PrPr) cross-linking frequencies as well as quantification of PU.1 sense and antisense transcripts showed increased URE-AsPr cross-linking frequencies and increased PU.1 asRNA expression in T-lymphoid Jurkat cells (Figure 6C). In contrast, in myeloid HL-60 cells, URE-PrPr cross-linking frequency and PU.1 mRNA expression were increased (Figure 6D). These data suggest a model of 2 competing promoters for either T-lymphoid or myeloid differentiation (Figure 6E).
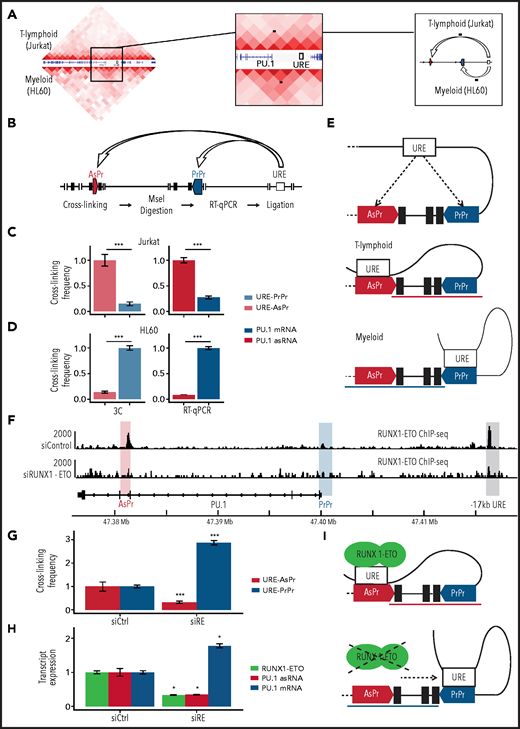
RUNX1-ETO induces a T-like chromosomal conformation. (A) 3C sequencing (Hi-C) in Jurkat (upper half) and HL-60 (lower half) cell lines. Black dots indicate the chromosomal looping. (B) Schematic representation of 3C for proximity quantification of indicated elements. PU.1 locus 3C and transcript expression in Jurkat (C) and HL-60 (D) cells (3C, n = 8; RT-qPCR, n = 3). (E) Model of competing sense/AsPrs. (F) Aligned reads of RUNX1-ETO ChIP-seq (antibody against the ETO moiety) in Kasumi-1 cells after small interfering RNA knockdown of RUNX1-ETO (siRUNX-ETO) and mismatch control (siControl). (G) 3C in Kasumi-1 after siRUNX1-ETO (siRE) and siControl (siCtrl) (n = 3). (H) Transcript quantification in Kasumi-1 after siRUNX1-ETO and siControl (n = 8) of RUNX1-ETO (green), PU.1 asRNA, and PU.1 mRNA. (I) Model of RUNX1-ETO inducing a T-lymphoid chromosomal conformation. Data are represented as mean ± standard error of the mean. *P < .05, ***P < .001, Wilcoxon and Student’s t tests.
RUNX1-ETO induces a T-like chromosomal conformation. (A) 3C sequencing (Hi-C) in Jurkat (upper half) and HL-60 (lower half) cell lines. Black dots indicate the chromosomal looping. (B) Schematic representation of 3C for proximity quantification of indicated elements. PU.1 locus 3C and transcript expression in Jurkat (C) and HL-60 (D) cells (3C, n = 8; RT-qPCR, n = 3). (E) Model of competing sense/AsPrs. (F) Aligned reads of RUNX1-ETO ChIP-seq (antibody against the ETO moiety) in Kasumi-1 cells after small interfering RNA knockdown of RUNX1-ETO (siRUNX-ETO) and mismatch control (siControl). (G) 3C in Kasumi-1 after siRUNX1-ETO (siRE) and siControl (siCtrl) (n = 3). (H) Transcript quantification in Kasumi-1 after siRUNX1-ETO and siControl (n = 8) of RUNX1-ETO (green), PU.1 asRNA, and PU.1 mRNA. (I) Model of RUNX1-ETO inducing a T-lymphoid chromosomal conformation. Data are represented as mean ± standard error of the mean. *P < .05, ***P < .001, Wilcoxon and Student’s t tests.
To investigate if oncogenic CBFs play a direct role in regulating the interplay between the 2 promoters and the URE, we examined publicly available ChIP-seq data.32 CBFβ-MYH11 and RUNX1-ETO both bind to both the AsPr and the URE, with RUNX1-ETO showing decreased binding after knockdown (Figure 6F; supplemental Figure 6A) which confirms that the oncogenic fusion protein binds both regions, presumably through conserved RUNX sites.12,56 Strikingly, RUNX1-ETO showed higher binding to PU.1 AsPr compared with RUNX1 (supplemental Figure 6B), similar to what we observed in T-lymphoid Jurkat cells (Figure 2F). We therefore hypothesized that the oncogenic fusion protein could promote a T-lymphoid–like chromosomal conformation in which the URE interacts with the AsPr. Thus, we evaluated if RUNX1-ETO depletion could revert a myeloid state on 3C sequencing using promoter and capture Hi-C for enriched annotated promoters.7 Indeed, a flip toward an increased URE–PrPr interaction was detected (supplemental Figure 6C). This idea was confirmed by 3C analysis showing that after RUNX1-ETO depletion, URE–AsPr cross-linking frequencies decreased, whereas URE–PrPr interactions increased (Figure 6G) with a concomitant decrease in PU.1 asRNA and an increase in PU.1 mRNA levels (Figure 6H). Our data show that cells harboring RUNX1-ETO adopt a T-lymphoid–like interaction state, thus switching from PU.1 mRNA toward antisense transcription (Figure 6I).
Discussion
These findings revealed a mechanism of CBF leukemias that account for 15% and thus the largest group of human AMLs.2,4 We previously reported that the subversion of terminal myeloid differentiation in CBF leukemias is correlated with low levels of PU.1 expression.12 Conversely, the introduction of PU.1 into CBF RUNX1-ETO leukemic cells induced cellular differentiation and stopped leukemic outgrowth, although the underlying mechanisms have remained unclear.10,11 The current study provides evidence that CBFs regulate the balance between PU.1 sense and antisense transcription that affects hematopoietic differentiation.18 In addition to PU.1 antisense transcription interfering with PU.1 translation,26 our data show reduced mRNA transcription by redirecting a key enhancer away from the PrPr toward a promoter of a long noncoding antisense transcript. Low PU.1 expression is a general feature in AML,12,17,18,27 as a result of several different responsible mechanisms. Here, we illustrate that in the case of CBF leukemias, the AsPr binding of CBFs is the key leukemic mechanism for low PU.1 expression.
Recent global analyses of 2658 whole cancer genomes revealed the presence of noncoding driver mutations57 whose functional role could be crucial, as 60% of the genome are transcribed.58,59 The promoter of the long noncoding transcript PVT1 was recently reported to directly compete with the oncogenic MYC promoter for binding a shared set of enhancers, and mutations in the PVT1 promoter were found in breast cancer and malignant lymphoma.60 The mechanisms of how and if these mutations shift the competition toward the oncogenic MYC promoter have remained unclear. In cancer, oncogenes can be activated through genetic translocations that directly juxtaposition the enhancer to an oncogene such as GFI1 or GFIB in childhood medulloblastoma61 or EVI1 in rare cases of leukemia.62 Our findings extend this promoter competition model to a noncoding promoter and provide an explanation for how enhancer–promoter interactions are properly coordinated in time and space and in response to the perturbation of differentiation by oncogenes.
Acknowledgments
The authors acknowledge the Core Facilities of the Medical University of Vienna. The authors acknowledge the Biomedical Sequencing Facility, Center for Molecular Medicine (CeMM).
A.D.R. was supported by grants from the National Institutes of Health (NIH), National Cancer Institute (R00CA188595), the Department of Defense (award number W81XWH-20-1-0518), Fondazione Cariplo N. 2016-0476, and the Giovanni Armenise-Harvard Foundation. A.K.E. was supported by the NIH, National Cancer Institute (R50 CA211304); P.V. was supported by the Austrian Science Fund (SFB grant F4704-B20). B.Q.T. is supported by the NIH, National Cancer Institute (K01CA222707). D.G.T. was supported by the NIH, National Cancer Institute (R35CA197697) and the National Heart, Lung, and Blood Institute (P01HL131477), and by the Singapore Ministry of Health's National Medical Research Council under its Singapore Translational Research (STaR) Investigator Award, and by the National Research Foundation Singapore and the Singapore Ministry of Education under its Research Centres of Excellence initiative.” P.B.S. received funding from the Austrian Science Fund (grant P27132-B20) and the Anniversary Fund of the Oesterreichische Nationalbank (grant P15936).
Authorship
Contribution : E.v.d.K., G.H., A.C., D.G.T., and P.B.S. were responsible for conceptualization; E.v.d.K., G.H., A.C., A.D.R., A.K.E., M.F., L.K., C.K., T.L., A.P., J.A.P., A.-S.S., C.M.S., C.A., E.H., S.S., J.K., and P.B.S. were responsible for investigations; E.v.d.K., G.H., T.P., and P.B.S. conducted the formal analysis; L.H.C., R.D., K.L., I.A.M.B., J.A.P., H.S., W.R.S., B.Q.T., P.V., K.V., R.S.W., and J.Z. provided resources; E.v.d.K., G.H., and P.B.S. performed visualization; A.C., L.H.C., R.D., A.S., P.V., K.V., J.Z., F.G., D.G.T., and P.B.S. contributed to study supervision; G.H. conducted bioinformatics analysis; D.G.T. and P.B.S. were responsible for project administration and acquisition of funding; and E.v.d.K., G.H., T.P., and P.B.S. wrote the original draft.
Conflict-of-interest disclosure: J.A.P. and L.H.C. hold a patent for AI-10-49 (US2019/033889). The remaining authors declare no competing financial interests.
Correspondence: Philipp Bernhard Staber, 18-20 Waehringer Guertel, 1090 Vienna, Austria; e-mail: philipp.staber@meduniwien.ac.at.
Sequencing data can be accessed in the ArrayExpress database under the following accession numbers: E-MTAB-9016 (RNA-seq), E-MTAB-9021 (ATAC-seq), and E-MTAB-9019 (PRO-seq).
The online version of this article contains a data supplement.
There is a Blood Commentary on this article in this issue.
The publication costs of this article were defrayed in part by page charge payment. Therefore, and solely to indicate this fact, this article is hereby marked “advertisement” in accordance with 18 USC section 1734.

This feature is available to Subscribers Only
Sign In or Create an Account Close Modal