

Key Points
Intravital imaging uncovers early blood clot formation and VWF deposition as important factors for cancer cell arrest in brain capillaries.
Brain macrometastasis formation can be inhibited by various anticoagulant therapies, suggesting a novel strategy for metastasis prevention.

Abstract
Clinically relevant brain metastases (BMs) frequently form in cancer patients, with limited options for effective treatment. Circulating cancer cells must first permanently arrest in brain microvessels to colonize the brain, but the critical factors in this process are not well understood. Here, in vivo multiphoton laser-scanning microscopy of the entire brain metastatic cascade allowed unprecedented insights into how blood clot formation and von Willebrand factor (VWF) deposition determine the arrest of circulating cancer cells and subsequent brain colonization in mice. Clot formation in brain microvessels occurred frequently (>95%) and specifically at intravascularly arrested cancer cells, allowing their long-term arrest. An extensive clot embedded ∼20% of brain-arrested cancer cells, and those were more likely to successfully extravasate and form a macrometastasis. Mechanistically, the generation of tissue factor-mediated thrombin by cancer cells accounted for local activation of plasmatic coagulation in the brain. Thrombin inhibition by treatment with low molecular weight heparin or dabigatran and an anti-VWF antibody prevented clot formation, cancer cell arrest, extravasation, and the formation of brain macrometastases. In contrast, tumor cells were not able to directly activate platelets, and antiplatelet treatments did reduce platelet dispositions at intravascular cancer cells but did not reduce overall formation of BMs. In conclusion, our data show that plasmatic coagulation is activated early by intravascular tumor cells in the brain with subsequent clot formation, which led us to discover a novel and specific mechanism that is crucial for brain colonization. Direct or indirect thrombin and VWF inhibitors emerge as promising drug candidates for trials on prevention of BMs.
Introduction
Brain metastases (BMs) remain a clinical challenge in modern oncology. Up to 50% of patients suffering from metastatic melanoma and 30% to 50% of patients with human epidermal growth factor receptor 2 (HER2)–positive and triple-negative breast cancer develop BMs during the course of their disease.1 BMs are by nature a multifocal disease in a delicate organ, which explains why treatment options are limited and why median overall survival remains as low as 3 to 9 months.2 Moreover, associated multiple neurologic complications significantly compromise patients’ quality of life. This makes prevention of brain colonization by cancer cells and the subsequent formation of BMs an attractive general concept,2-5 but the best biological strategy remains obscure, and no prospective clinical trials investigating drugs with respect to their potential for preventing BMs have yet been completed.
Interestingly, a growing body of evidence suggests long-term benefits of antithrombotic drugs on patient survival which, in solid tumors, largely depends on the inhibition of metastatic spread. Antithrombotic therapy prevents cancer-associated adverse effects such as deep vein thrombosis and pulmonary embolism.6 Treatment with low molecular weight heparin (LMWH) has primarily been associated with a survival benefit in patients with advanced cancer.6,7 Although this largely retrospective data must be viewed with caution, they point toward the potential of antithrombotic agents that reaches beyond their current clinical use. The exact mechanisms of action of their potential antimetastatic activity remain elusive, as does the question of whether BMs might also be affected.
The aim of this study was to specifically investigate the impact of cancer cell–associated microthrombus formation within brain capillaries on the distinct steps of the brain metastatic cascade5 : intravascular arrest of circulating cancer cells, extravasation, microscopic brain colonization, and formation of a clinically relevant macrometastasis. A newly developed in vivo multiphoton laser-scanning microscopy (MPLSM) method combined with other technologies has allowed unprecedented insights into the interplay of the blood coagulation system with the entire brain metastatic cascade. Anticoagulation strategies and antiplatelet approaches have now been tested for their ability to inhibit the formation of BMs.
Materials and methods
For additional information, please see the supplemental Data, available at the Blood Web site.
Human tissue and cell lines
Informed written consent was obtained from all participants in accordance with the Declaration of Helsinki and the International Conference on Harmonization of Technical Requirements for Registration of Pharmaceuticals for Human Use guidelines. The protocol received approval from the ethics committee of the Medical Faculty Mannheim, Heidelberg University (Heidelberg, Germany; 2012-293N-MA). The human breast cancer cell lines Jimt1,8 and melanoma cell lines A2058 and H1Dl2 (H1)9 were cultured under standard media conditions (Dulbecco’s modified Eagle medium, 10% fetal bovine serum, 1% penicillin and streptomycin). For in vivo imaging,8,10 cells expressing green fluorescent protein or red fluorescent protein were brain-passaged 3 times as described previously.5,8
Animal procedures
All animal procedures were approved by the Regierungspraesidium Karlsruhe (Karlsruhe, Germany) (governmental authority for laboratory animal research; G188/12 and G220/16). Male NMRI-nu mice were used for melanoma studies, and female nu/nu mice were used for breast cancer studies. Mice (8 to 12 weeks old) received a chronic cranial window (6 mm in diameter), and a single tumor cell (TC) suspension was injected into the left cardiac ventricle as reported before.5,8,10
Imaging
For in vivo imaging and MPLSM, we used a Zeiss LSM 7MP microscope equipped with a Coherent Chameleon Ultra II laser. Images were taken through a BP500-550/BP575-610 filter with a 20×/1.0 W-Plan-Apochromat objective (Zeiss, Jena, Germany), which allowed for a subcellular resolution of <0.5 µm in a depth of 200 to 500 µm. Rhodamine 6G dye (0.5 mg/mL; Sigma-Aldrich, Schnelldorf, Germany),11,12 1 mg of tetramethylrhodamine-isothiocyanate (TRITC) dextran (500 g/mol; 52194, Sigma-Aldrich) or fluorescein-isothiocyanate dextran (FITC; 2000 g/mol; FD-2000S, Sigma-Aldrich) was injected intravenously (IV). Multimodal correlative microscopy was performed as described previously13-15 to retrieve the arrested TCs for electron microscopy (EM) imaging. Cranial magnetic resonance imaging (MRI) was performed in the fourth week after intracardiac TC injection on a 9.4 Tesla small animal nuclear magnetic resonance scanner (BioSpec 94/20 USR, Bruker BioSpin, Ettlingen, Germany).16
Antibodies and reagents in vivo
Polyclonal FITC-conjugated anti-von Willibrand factor (anti-VWF antibody; GTX28822, GeneTex, Irvine, CA; detailed characterization provided in supplemental Figure 1) and an unspecific, host consistent (sheep immunoglobulin G [IgG]) FITC-conjugated isotype control (20006-1-F, Cedarlane Laboratories, Burlington, Canada) were used. After purification with a column (HiTrap, GE29-0486-84, Sigma-Aldrich), antibodies (4 µg/g) were injected IV 30 minutes before TC injection. Antibody injections (1 µg/g) were given before every imaging session.17,18
Inhibition of clot formation
Treatments with acetylsalicylic acid (ASA [aspirin], 5 µg/g; Bayer, Leverkusen, Germany) and clopidogrel (25 µg/g; AbZ-Pharma, Ulm, Germany) were administered by oral gavage once per day to inhibit clot formation. Tirofiban (0.5 μg/g; #30165, Sigma-Aldrich) was injected IV 30 minutes before TC injection, then every 4 hours for 24 hours, then 3 times per day until day 10 post intracardiac injection (p.i.i.).19 Injection of polyclonal anti-glycoprotein Ib (GPIb) (4 µg/g; R300, Emfret Analytics, Würzburg, Germany) 2 hours after TC injection resulted in effective platelet depletion for more than 4 days.20 Polyclonal nonimmune IgG (C301, Emfret Analytics) served as an isotype control. Tinzaparin (innohep; Leo Pharma, Neu-Isenburg, Germany) was injected subcutaneously (0.6 IU/g).21 Dabigatran (80 mg/kg; Pradaxa, Boehringer Ingelheim, Ingelheim am Rhein, Germany) was given orally via gavage 2 times per day 2 days before intracardiac injection until day 10 p.i.i. Orally administered substances were dissolved in a methylcellulose solution (0.5% methylcellulose; 0.2% polysorbate) in a maximum volume of 0.2 mL per application.
Brain sections
Mice were euthanized on day 3 or day 28 p.i.i. Cryosections (10 µm) of fresh frozen brains without trans-cardiac perfusion were taken 130 µm apart to avoid overlapping of metastases over several slices, and hematoxylin and eosin staining was applied. Images were acquired via slide scanner (Axio Scan.Z1, Zeiss) in bright field configuration with a 20×/0.8 Plan-Apochromat objective (Zeiss) and a Hitachi HV-F202SCL camera.
Immunofluorescence
The following primary antibodies were used: polyclonal sheep anti-human VWF-FITC (1:150; GTX28822, GeneTex), polyclonal rabbit anti DsRed (1:100; 632496, Takara Bio USA, USA), polyclonal rabbit anti-human VWF (1:150, A0082, DAKO, Glostrup, Denmark), and monoclonal mouse anti-human thrombospondin (1:75, MS-421-R7, Thermo Fisher Scientific, Waltham, MA). The following secondary antibodies were used: Alexa 555-conjugated goat anti-rabbit (1:200; Invitrogen, Carlsbad, CA), Alexa 555–conjugated goat anti-mouse (1:200; Invitrogen), and FITC-conjugated goat anti-rabbit (1:200; BD Pharmingen, San Diego, CA). Nuclei were stained with 4,6 diamidino-2-phenylindole (DAPI).
In vitro plasma coagulation and thrombin generation
Plasma coagulation time was measured using a mechanical ball coagulometer (MC-4 PLUS, Merlin Medical, Lemgo, Germany). TCs (400 000 per mL) were diluted (1:1, 1:4, 1:8, 1:16) in human plasma and coagulation was initiated by CaCl2 (0.025M; #ORHO37, Siemens, München, Germany). Thrombin generation of TCs (10 000 per 100 µL) with or without human plasma (centrifuged at 1000g for 15 minutes) was performed according to the manufacturer’s instructions (Technoclone, Wien, Austria). This assay is based on the cleavage of a fluorogenic substrate for the determination of thrombin activity.
Light transmission aggregometry
TC-induced platelet aggregation was evaluated by light transmission aggregometry (LTA) using a spectrophotometer (PowerWave XS2, BioTek Instruments, Winooski, VT). Platelets were isolated from citrated blood of human donors after approval by the local ethics committee. TCs (10 000 per 100 µL) with or without human plasma were added to the platelets. Tinzaparin (100 IU/mL) was added for 30 minutes, and thrombin (0.5 IU/mL) served as positive control. Light transmission was recorded at 600 nm at 37°C.
Flow cytometry
Human TCs where stained with phycoerythrin (PE)–conjugated anti-tissue factor (anti-TF; 0.2 mg/mL; #12-1429, Thermo Fisher Scientific) and eFluor780-conjugated fixable viability dye (1:1.000; #65-0865-14, eBioscience, San Diego, CA) for 30 minutes at 4°C. Isotype control PE-conjugated mouse IgG (#12-4714-82, Thermo Fisher Scientific) was used. Data were recorded on a fluorescence-activated cell sorter (FACSCanto II, BD Biosciences, San Jose, CA) and analyzed using FlowJo version 10 software (BD Biosciences).
Image processing and analysis and statistics
Zeiss ZEN software and the ImageJ image processing program (National Institutes of Health, Bethesda, MD) were used for image analysis.22 QuPath version 0.1.2 software (GitHub; Queen’s University Belfast, Belfast, United Kingdom) was used for quantification of cryosections.23 Power analyses to provide cohort sizes were simulated with R software version 3.4.0 (https://www.r-project.org/) in advance. Unpaired Student t test or Mann-Whitney U test was used for comparing 2 groups, Spearman’s rank correlation coefficient was calculated for correlations, and survival curves were tested with the Kaplan-Meier estimator. Either a χ2 test or Fisher’s test was used to compare the frequencies of reaching a next step in the metastatic cascade. SPSS 24.0 software (SPSS, Chicago, IL) was used for statistical analysis, and statistical significance was assumed when P < .05 was reached.
Results
Clot formation during the brain metastatic process
The formation of blood clots at the site of arrested TCs in the brain was first discovered using a correlative light and EM methodology.15 Here, Jimt1 breast cancer cells were injected intracardially, and intravascular brain arrested TCs were targeted by using multimodal correlative microscopy. EM at 3 to 7 days p.i.i. allowed the visualization of TCs and their microenvironment, including blood components (Figure 1A). Strikingly, an accumulation of aggregated platelets and clots in the vessel lumen was frequently observed at the sites of TC arrest (Figure 1B).
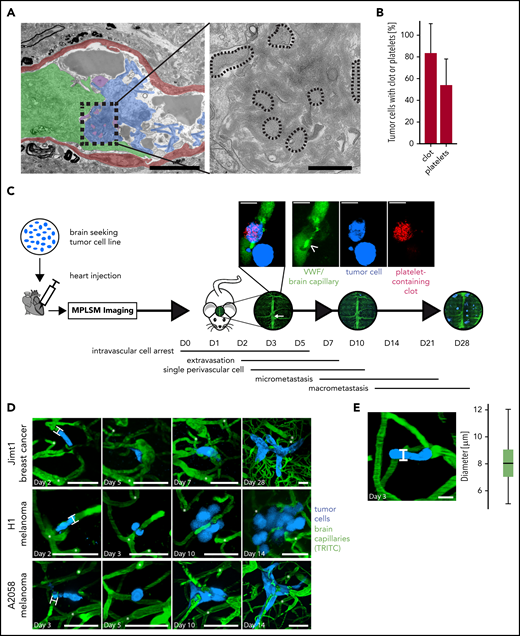
Ultrastructural and intravital imaging of clot components during BM. (A) EM images of intravascularly arrested Jimt1 (breast cancer) TCs (green) associated with a clot (blue) and platelet aggregates (purple). The vessel wall is depicted in red. Platelets (dotted outlines in high-magnification images) are embedded in the clot. Scale bars in colorized overview panels, 5 µm; scale bars in high-magnification panels: 1 µm. (B) Quantification of arrested TCs on days 5 to 7 p.i.i. with associated (platelet) clot in EM imaging (32 metastatic Jimt1 breast cancer cells from 9 mice). Error bars: 95% CI. (C) Experimental design for studying the impact of the coagulation system on the steps of BM formation in mice. TCs are injected intracardially and followed immediately by in vivo MPLSM through a chronic cranial window. The superior sagittal sinus (white arrow) serves as an anatomical orientation. Microscopy images of the same brain regions over 1 month are used to follow single arrested TCs as they process through the brain metastatic cascade: initial intravascular cell arrest (days 0-5), early extravasation between days 2 and 7, single cell in the perivascular niche (days 2-10), followed by outgrowth into a micrometastasis (3-50 cells) and finally macrometastasis (>50 cells) on day 28. Magnification micrograph: coregistration of circulating platelets (red) and FITC-labeled anti-VWF antibody (green) bound to the typically large VWF fibers (arrowhead) on day 7 p.i.i. next to an intra- and extravascular TC (blue). Scale bars, 10 µm. (D) Representative in vivo MPLSM images over time of the distinct steps of the brain metastatic cascade of all 3 cell line models, which were investigated with MPLSM (without clot imaging). At persistent cell arrest, TCs fill out the whole lumen of the brain capillary with a cell-vessel diameter ratio of 1 (H-bars). Distinct deep vessels are given as reference points (white asterisks) for orientation. Vascular remodeling occurs around distinct arrested/extravasating TCs. Scale bars, 50 µm. (E) Mean diameter of brain capillaries where TCs arrest. Diameter was measured as indicated (H-bar) where intravascularly arrested TCs were in vicinity (105 cells in 6 mice; boxplot; median, 8 µm). Scale bar, 10 µm. TRITC, tetramethylrhodamine-isothiocyanate.
Ultrastructural and intravital imaging of clot components during BM. (A) EM images of intravascularly arrested Jimt1 (breast cancer) TCs (green) associated with a clot (blue) and platelet aggregates (purple). The vessel wall is depicted in red. Platelets (dotted outlines in high-magnification images) are embedded in the clot. Scale bars in colorized overview panels, 5 µm; scale bars in high-magnification panels: 1 µm. (B) Quantification of arrested TCs on days 5 to 7 p.i.i. with associated (platelet) clot in EM imaging (32 metastatic Jimt1 breast cancer cells from 9 mice). Error bars: 95% CI. (C) Experimental design for studying the impact of the coagulation system on the steps of BM formation in mice. TCs are injected intracardially and followed immediately by in vivo MPLSM through a chronic cranial window. The superior sagittal sinus (white arrow) serves as an anatomical orientation. Microscopy images of the same brain regions over 1 month are used to follow single arrested TCs as they process through the brain metastatic cascade: initial intravascular cell arrest (days 0-5), early extravasation between days 2 and 7, single cell in the perivascular niche (days 2-10), followed by outgrowth into a micrometastasis (3-50 cells) and finally macrometastasis (>50 cells) on day 28. Magnification micrograph: coregistration of circulating platelets (red) and FITC-labeled anti-VWF antibody (green) bound to the typically large VWF fibers (arrowhead) on day 7 p.i.i. next to an intra- and extravascular TC (blue). Scale bars, 10 µm. (D) Representative in vivo MPLSM images over time of the distinct steps of the brain metastatic cascade of all 3 cell line models, which were investigated with MPLSM (without clot imaging). At persistent cell arrest, TCs fill out the whole lumen of the brain capillary with a cell-vessel diameter ratio of 1 (H-bars). Distinct deep vessels are given as reference points (white asterisks) for orientation. Vascular remodeling occurs around distinct arrested/extravasating TCs. Scale bars, 50 µm. (E) Mean diameter of brain capillaries where TCs arrest. Diameter was measured as indicated (H-bar) where intravascularly arrested TCs were in vicinity (105 cells in 6 mice; boxplot; median, 8 µm). Scale bar, 10 µm. TRITC, tetramethylrhodamine-isothiocyanate.
To study the functional impact of blood coagulation factors on the single steps of BM formation in mice, we further developed an in vivo MPLSM methodology through a chronic cranial window, which was originally established in our laboratory.5,8,10 In general, this technology makes it possible to study the entire sequence of steps that a circulating TC must master to eventually establish a brain macrometastasis: the brain metastatic cascade (Figure 1C). Two different human melanoma cell lines (A2058 and H1) and 1 human breast cancer cell line (Jimt1) were injected intracardially to generate metastases, and MPLSM imaging was initiated within a few minutes after heart injection and repeated over the course of 4 weeks to monitor the early and later steps of brain colonization (Figure 1D). Intravascular cell arrest within the brain occurred exclusively in brain capillaries with a diameter of 5 to 12 µm (Figure 1E) with a cell-vessel diameter ratio of 1, as reported previously.5 To label, quantify, and further characterize the occurrence of blood clots in vivo, Rhodamine 6G11,12 (to label intravascular blood clots via their platelet content) was injected before every imaging session. Furthermore, FITC-labeled polyclonal anti-VWF antibodies were used to visualize VWF fibers.
Extensive clot formation is associated with successful TC extravasation
At day 1 p.i.i., 99% of Jimt1 cells, 96% of A2058 cells, and 97% of H1 cells showed any level of clot formation at the very site of their arrest in brain microvessels. The high resolution of in vivo MPLSM allowed us to further specify clot aggregation patterns and determine different clot volumes (Figure 2A-B). An extensive clot was defined by a size that was 50% to 100% of the size of the intravascular arrested TC and was detectable in 37% of Jimt1 breast cancer cells and 8% of A2058 and 23% of H1 melanoma cells. In contrast, a minor clot was defined by a size that was <50% of the size of the intravascular arrested TC, whereas the size of an excessive clot exceeded the size of the arrested TC (>100%; Figure 2B). Clot formation was visible immediately after the injection of TCs and usually disappeared after 3 to 7 days when cells extravasated. Remarkably, in vivo tracking of the long-term fate of arrested TCs (Figure 2C) revealed that successful extravasation was in general indisputably associated with clot formation.
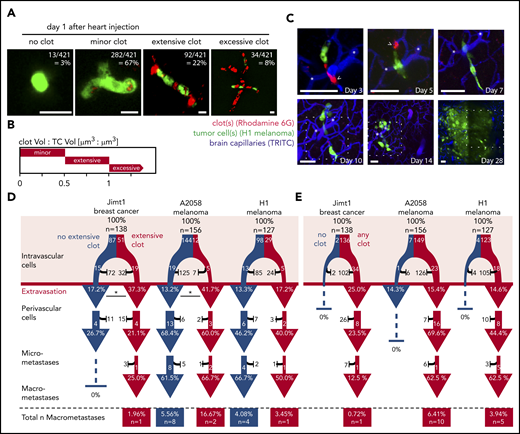
Clot formation in brain microvessels marks TC extravasation. (A) Representative images of intravascularly arrested TCs (green fluorescent protein, GFP) associated with a clot visualized with Rhodamine 6G dye. Scale bars, 10 µm. (B) Clot size was defined by the TC size:clot size ratio. Minor clot: clot volume:TC volume <0.5; Jimt1, n = 56 of 138; A2058, n = 132 of 156; H1, n = 94 of 127; extensive clot: clot volume:TC volume >0.5 and <1.0; Jimt1, n = 51 of 138; A2058, n = 12 of 156; H1, n = 29 of 127; excessive clot: clot volume:TC volume >1.0; Jimt1, n = 29 of 138; A2058, n = 5 of 156; H1, n = 0 of 127; no clot: Jimt1, n = 2 of 138; A2058, n = 7 of 156; H1, n = 4 of 127. (C) Representative image time course of a single H1 melanoma cell (green) associated with platelets (red) and an extensive clot: initial intravascular cell arrest, extravasation (day 5) into the perivascular position, outgrowth into a micrometastasis by vascular co-option (day 10), and finally successful macrometastasis after 1 month. Representative platelet accumulation on days 3 and 5 after TC injection (arrowheads). Distinct deep vessels are given as reference (asterisks). Scale bars: 50 µm, the dotted square represents the brain section of the previous imaging time point. (D-E) Quantification of the brain metastatic cascade, visualized in a flowchart. In all 3 cell lines, more than 100 individual arrested TCs were followed for more than 1 month; Jimt1, 138 metastases in 4 mice; A2058, 156 metastases in 4 mice; H1, 127 metastases in 3 mice. For each step of the metastatic cascade, the total number of surviving (white) vs dying (black) TCs is given, as well as the likelihood to reach the next step of the cascade (%). (D) Comparing TCs with (red) or without (blue) associated extensive clot formation during the intravascular phase. Jimt1 extravasation P = .013; A2058 extravasation P = .021; H1 extravasation P = .557 (χ2 test for all P values). (E) Comparing the fate of brain-arrested TCs with any surrounding clot vs those with no surrounding clot. Only TCs with any clot association successfully grow out into a macrometastasis. χ2 test analysis for successful extravasation or micro- or macrometastasis formation was not significant.
Clot formation in brain microvessels marks TC extravasation. (A) Representative images of intravascularly arrested TCs (green fluorescent protein, GFP) associated with a clot visualized with Rhodamine 6G dye. Scale bars, 10 µm. (B) Clot size was defined by the TC size:clot size ratio. Minor clot: clot volume:TC volume <0.5; Jimt1, n = 56 of 138; A2058, n = 132 of 156; H1, n = 94 of 127; extensive clot: clot volume:TC volume >0.5 and <1.0; Jimt1, n = 51 of 138; A2058, n = 12 of 156; H1, n = 29 of 127; excessive clot: clot volume:TC volume >1.0; Jimt1, n = 29 of 138; A2058, n = 5 of 156; H1, n = 0 of 127; no clot: Jimt1, n = 2 of 138; A2058, n = 7 of 156; H1, n = 4 of 127. (C) Representative image time course of a single H1 melanoma cell (green) associated with platelets (red) and an extensive clot: initial intravascular cell arrest, extravasation (day 5) into the perivascular position, outgrowth into a micrometastasis by vascular co-option (day 10), and finally successful macrometastasis after 1 month. Representative platelet accumulation on days 3 and 5 after TC injection (arrowheads). Distinct deep vessels are given as reference (asterisks). Scale bars: 50 µm, the dotted square represents the brain section of the previous imaging time point. (D-E) Quantification of the brain metastatic cascade, visualized in a flowchart. In all 3 cell lines, more than 100 individual arrested TCs were followed for more than 1 month; Jimt1, 138 metastases in 4 mice; A2058, 156 metastases in 4 mice; H1, 127 metastases in 3 mice. For each step of the metastatic cascade, the total number of surviving (white) vs dying (black) TCs is given, as well as the likelihood to reach the next step of the cascade (%). (D) Comparing TCs with (red) or without (blue) associated extensive clot formation during the intravascular phase. Jimt1 extravasation P = .013; A2058 extravasation P = .021; H1 extravasation P = .557 (χ2 test for all P values). (E) Comparing the fate of brain-arrested TCs with any surrounding clot vs those with no surrounding clot. Only TCs with any clot association successfully grow out into a macrometastasis. χ2 test analysis for successful extravasation or micro- or macrometastasis formation was not significant.
Arrested cancer cells with excessive clot formation did not successfully extravasate, possibly reflecting the presence of nonvital cancer cells in this situation, but cancer cells with extensive (ie, relevant) clot formation on day 1 extravasated more efficiently than cells with no extensive clot formation, which reached significance for the Jimt1 (P = .013) and the A2058 (P = .021) but not for the H1 model (P = .557) (Figure 2D). Importantly, only those TCs with any clot association at day 1 p.i.i. were able to grow out to a macrometastasis thereafter (Figure 2E).
Formation of a relevant (extensive) clot was detected only at TC arrest sites but nowhere else in the investigated brains and not in control animals intracardially injected with phosphate-buffered saline, suggesting that relevant clots are not primarily triggered by the heart injection method itself but are exclusively induced by the TCs at their arrest sites. These data indicate that clot formation is an indispensable prerequisite for TC extravasation in the brain.
TCs promote clot formation via thrombin
Several receptors and their ligands have been proposed to induce TC-mediated platelet aggregation.24 To investigate the ability of TCs to induce platelet aggregation, we used LTA. However, when washed platelets were incubated with Jimt1, A2058, and H1 cells, no aggregation of platelets was detected (Figure 3A). In line with that observation, FACS analysis for receptors of direct TC-platelet interactions showed no expression of GPIb or GPIIb/GPIIIa (supplemental Figure 2A). These data suggest that tumor-initiated clotting was not mediated by direct TC-platelet interactions, but instead may involve plasmatic components. TF is the primary initiator of the coagulation cascade. As a transmembrane glycoprotein, TF is the receptor for the coagulation protease factor VII (FVII), and the formation of the TF-FVII complex triggers thrombin generation and clot formation.25 TF is constitutively expressed in the subendothelial spaces and adventitia and is highly expressed in many types of cancer.26 FACS analysis revealed that Jimt1 cells express TF, but the melanoma A2058 and H1 cells do not (Figure 3B). Reduced plasma coagulation time demonstrated the thrombotic activity of all TCs, in which the prothrombotic activity of the breast cancer cell line Jimt1 was highest (Figure 3C). In addition, the presence of coagulation factors by coincubation with human plasma resulted in a marked increase in thrombin generation in all TC lines (Figure 3D), suggesting a thrombin-dependent mechanism for TC-triggered blood clotting. Indeed, LTA confirmed that TC-derived thrombin promoted platelet aggregation (Figure 3E; supplemental Figure 2B). Incubation of TCs with tinzaparin (Figure 3E; supplemental Figure 2C) or hirudin (supplemental Figure 2D) abolished this effect. Therefore, we conclude that TC-generated thrombin is the main trigger for the TC-mediated clot formation.
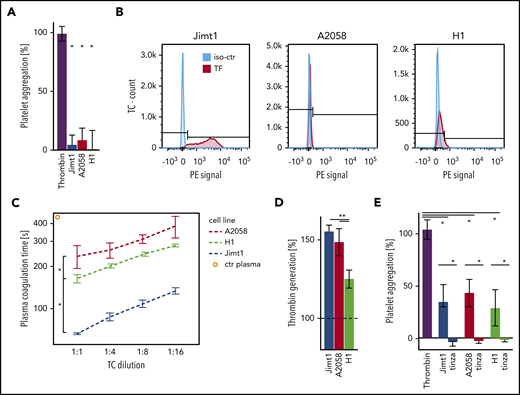
Prothrombotic effects of TCs. (A) Jimt1, A2058, and H1 TCs (10 000 cells per 100 µL) were added to isolated platelets, and platelet aggregation was monitored using LTA. Thrombin was used as positive control (4 to 6 replicates in 2 independent experiments). Thrombin vs TCs: Jimt1, P < .0001; A2058, P < .0001; H1, P = .003. Error bars: 95% CI. (B) FACS analysis of the TC surface molecule TF. The procoagulatory TF molecule was upregulated in Jimt1 breast cancer cells in vitro. (C) Plasma coagulation time depends on different TC lines: Jimt1 breast cancer shows the biggest decrease in plasma coagulation time. Jimt1 vs A2058, P = .001; Jimt1 vs H1, P = .003; A2058 vs H1, P = .038. Error bars: ±1 SD. (D) Jimt1, A2058, and H1 TCs (10 000 cells per 100 µL) were supplemented with human plasma, and thrombin generation was quantified. Human plasma was used as control (100%, horizontal dotted line) (n = 3 replicates of different cell passages). Jimt1 vs A2058, P = .299; Jimt1 vs H1, P = .002; A2058 vs H1, P = .017. Error bars: 95% CI. (E) After Jimt1, A2058, and H1 TCs (10 000 cells per 100 µL) were incubated with human plasma with or without tinzaparin (100 IU/mL), the supernatant was added to isolated platelets, and platelet aggregation was monitored using LTA. Thrombin was used as a positive control (n = 5 to 6 replicates in 2 independent experiments). Thrombin vs TCs: Jimt1, P < .0001; A2058, P < .0001; H1, P = .003. TCs vs tinzaparin: Jimt1, P < .0001; A2058, P < .0001; H1, P < .0001. Error bars: 95% CI. P values from Student t test. *P < .05. iso-ctr, isotype control; PE, phycoerythrin.
Prothrombotic effects of TCs. (A) Jimt1, A2058, and H1 TCs (10 000 cells per 100 µL) were added to isolated platelets, and platelet aggregation was monitored using LTA. Thrombin was used as positive control (4 to 6 replicates in 2 independent experiments). Thrombin vs TCs: Jimt1, P < .0001; A2058, P < .0001; H1, P = .003. Error bars: 95% CI. (B) FACS analysis of the TC surface molecule TF. The procoagulatory TF molecule was upregulated in Jimt1 breast cancer cells in vitro. (C) Plasma coagulation time depends on different TC lines: Jimt1 breast cancer shows the biggest decrease in plasma coagulation time. Jimt1 vs A2058, P = .001; Jimt1 vs H1, P = .003; A2058 vs H1, P = .038. Error bars: ±1 SD. (D) Jimt1, A2058, and H1 TCs (10 000 cells per 100 µL) were supplemented with human plasma, and thrombin generation was quantified. Human plasma was used as control (100%, horizontal dotted line) (n = 3 replicates of different cell passages). Jimt1 vs A2058, P = .299; Jimt1 vs H1, P = .002; A2058 vs H1, P = .017. Error bars: 95% CI. (E) After Jimt1, A2058, and H1 TCs (10 000 cells per 100 µL) were incubated with human plasma with or without tinzaparin (100 IU/mL), the supernatant was added to isolated platelets, and platelet aggregation was monitored using LTA. Thrombin was used as a positive control (n = 5 to 6 replicates in 2 independent experiments). Thrombin vs TCs: Jimt1, P < .0001; A2058, P < .0001; H1, P = .003. TCs vs tinzaparin: Jimt1, P < .0001; A2058, P < .0001; H1, P < .0001. Error bars: 95% CI. P values from Student t test. *P < .05. iso-ctr, isotype control; PE, phycoerythrin.
Antithrombotic therapy can limit early TC arrest in the brain
For in vivo proof of our findings, we treated mice with antiplatelet therapy (APT: ASA plus clopidogrel [ASAC]) along with LMWH tinzaparin and VWF blocking by using a polyclonal anti-VWF antibody (Figure 4A). The efficacy of platelet inhibition induced by ASAC was confirmed by an increased tail bleeding time (supplemental Figure 2E). In line with this observation, therapeutic thrombin inhibition by the LMWH was demonstrated via decreased thrombin generation (supplemental Figure 2F).
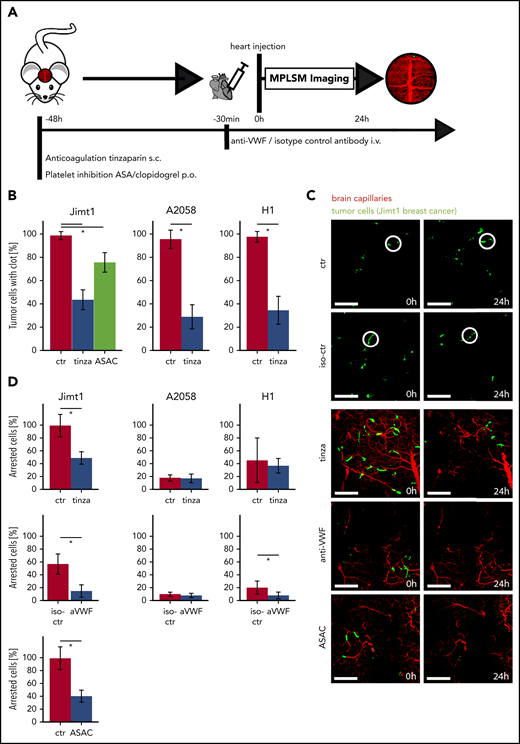
Inhibition of clot formation attenuates intravascular arrest of breast cancer cells. (A) Experimental design to study TC arrest and clot formation in control (ctr) mice vs 3 treatment groups during the first 24 hours after TC injection. (B) Quantification of arrested TCs after 24 hours with associated clot in control mice vs mice anticoagulated with tinzaparin (tinza) or ASAC (more than 100 cells in at least 3 mice per group; Student t test P < .0001). (C) Representative images for prolonged cell arrest quantification 0 and 24 hours after intracardial TC injection. The definition of 0 hours was determined by imaging <30 minutes after intracardial injection. Breast cancer cells in control mice show persistent arrest in the first 24 hours (circles). In treated mice, few TCs were visible 24 hours after intracardial TC injection (area, 600 × 600 µm2; scale bars: 150 µm). (D) Quantification of persistent intravascular TC arrest in all 3 cell lines upon antithrombotic treatment compared with control mice. For Jimt1: top, 383 metastases in 3 ctr mice vs 411 metastases in 3 tinzaparin-treated mice; middle, 425 metastases in 3 iso-ctr mice vs 281 metastases in 3 aVWF-treated mice; bottom, 383 metastases in 3 ctr mice vs 266 metastases in 3 ASAC-treated mice (P < .0001 for the entire column). For A2058: top, 451 metastases in 3 ctr mice vs 366 metastases in 3 tinzaparin-treated mice (P = .849); middle, 303 metastases in 3 iso-ctr mice vs 571 metastases in 3 aVWF-treated mice (P = .341). For H1: top, 249 metastases in 3 ctr mice vs 299 metastases in 3 tinzaparin-treated mice (P = .725); middle, 139 metastases in 3 iso-ctr mice vs 243 metastases in 3 aVWF-treated mice (P = .033). All P values from Student t test; *P < .05. Error bars: 95% CI.
Inhibition of clot formation attenuates intravascular arrest of breast cancer cells. (A) Experimental design to study TC arrest and clot formation in control (ctr) mice vs 3 treatment groups during the first 24 hours after TC injection. (B) Quantification of arrested TCs after 24 hours with associated clot in control mice vs mice anticoagulated with tinzaparin (tinza) or ASAC (more than 100 cells in at least 3 mice per group; Student t test P < .0001). (C) Representative images for prolonged cell arrest quantification 0 and 24 hours after intracardial TC injection. The definition of 0 hours was determined by imaging <30 minutes after intracardial injection. Breast cancer cells in control mice show persistent arrest in the first 24 hours (circles). In treated mice, few TCs were visible 24 hours after intracardial TC injection (area, 600 × 600 µm2; scale bars: 150 µm). (D) Quantification of persistent intravascular TC arrest in all 3 cell lines upon antithrombotic treatment compared with control mice. For Jimt1: top, 383 metastases in 3 ctr mice vs 411 metastases in 3 tinzaparin-treated mice; middle, 425 metastases in 3 iso-ctr mice vs 281 metastases in 3 aVWF-treated mice; bottom, 383 metastases in 3 ctr mice vs 266 metastases in 3 ASAC-treated mice (P < .0001 for the entire column). For A2058: top, 451 metastases in 3 ctr mice vs 366 metastases in 3 tinzaparin-treated mice (P = .849); middle, 303 metastases in 3 iso-ctr mice vs 571 metastases in 3 aVWF-treated mice (P = .341). For H1: top, 249 metastases in 3 ctr mice vs 299 metastases in 3 tinzaparin-treated mice (P = .725); middle, 139 metastases in 3 iso-ctr mice vs 243 metastases in 3 aVWF-treated mice (P = .033). All P values from Student t test; *P < .05. Error bars: 95% CI.
MPLSM after 24 hours confirmed a significantly reduced clot formation for all 3 treatment groups (Figure 4B). As expected, untreated control mice frequently exhibited a prolonged TC arrest in brain microvessels for at least 24 hours (Figure 4C). As mentioned above, a prolonged retention of TCs within brain capillaries is a prerequisite for TC extravasation.5 All anticoagulatory treatments provoke a significant reduction of Jimt1 TCs, but not A2058 and H1 TCs, within brain microvessels (Figure 4D).
Anticoagulation, but not APT, attenuates brain metastasis formation
To study the long-term effects of APT and anticoagulation with LMWH or dabigatran on the brain metastatic cascade, we continued the corresponding treatments until day 10 p.i.i., and tracked the fate of those cancer cells that managed to perform an intravascular arrest until day 28 (Figure 5A). Here, no difference in the subsequent steps of the brain metastatic cascade was observed when compared with controls (Figure 5B). To investigate the overall impact of different antithrombotic strategies, brain macrometastasis formation was quantified 4 weeks after heart injection in the breast cancer model. After this time point, control mice would start to become symptomatic. Hematoxylin and eosin staining was used to identify metastases on slides of brain tissue (Figure 5C; false color delineations for quantification). Here, anticoagulation with tinzaparin resulted in a reduction in both metastasis count and metastasis size (Figure 5D). Next, we aimed to get a comprehensive picture of the anti-brain metastatic activities of additional antiplatelet and anticoagulant strategies. Because ASAC does not affect platelet GPIIb/GBIIIa-fibrinogen interactions, we further induced thrombocytopenia by treatment with anti-GPIb serum and blocked the interaction of platelets with fibrinogen and VWF with the clinically approved anti-GPIIb/GPIIIa antagonist tirofiban. Cranial MRI scans demonstrated that platelet inhibition had no impact on total BM load (Figure 5E-G). In contrast, the clinically approved thrombin inhibitor dabigatran strongly reduced overall BM formation (Figure 5E-G), confirming the pivotal role of TC-derived thrombin and the plasmatic coagulation system for brain colonization of cancer cells.
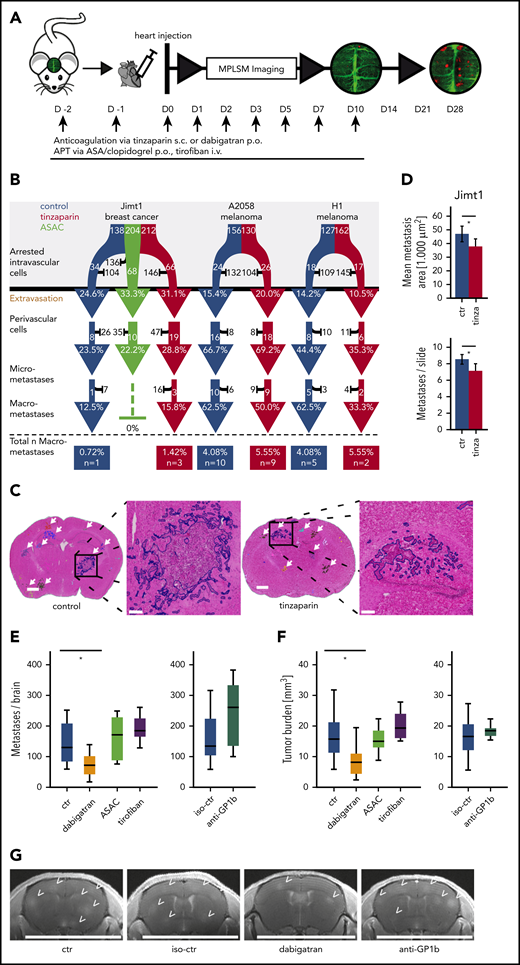
Effects of antithrombotic drugs on BM formation. (A) Experimental design. APT via anticoagulation with tinzaparin (tinza) or dual platelet inhibition with ASA/clopidogrel (ASAC) was started 2 days before heart injection and continued with daily application until day 10 after heart injection. (B) Flowchart of the brain metastatic cascade over 1 month to compare the fate of brain-arrested TCs with anticoagulative or antithrombotic treatment compared with a control (ctr) group. For each step of the metastatic cascade, the total number of surviving (white) vs dying (black) TCs is given, as well as the likelihood to reach the next step of the cascade (%). Jimt1, 138 metastases in 4 control mice vs 212 metastases in 3 tinzaparin-treated mice vs 204 metastases in 3 ASAC-treated mice; A2058, 156 metastases in 4 control mice vs 130 metastases in 3 tinzaparin-treated mice; H1, 127 metastases in 3 control mice vs 162 metastases in 3 tinzaparin-treated mice. χ2 test analysis for successful extravasation or micro- or macrometastasis formation was not significant. (C) Representative images of hematoxylin and eosin (H&E)–stained brain sections for quantification of overall tumor load at the ultimate end point on day 28. Metastases were counted in whole brain slides (white arrows). The higher magnifications show the morphology of 1 single brain metastasis and the colored outline used for area calculations: vascular co-optive growing metastases present with extensive perivascular protrusions and show a diffuse infiltration of TCs into the surrounding parenchyma, which were then counted as parts of 1 major metastasis. Scale bars for overview, 1 mm; for zoomed-in view, 200 µm. (D) Quantification of mean metastasis size and number in control vs tinzaparin-treated mice with breast cancer metastases. Jimt1, 1222 metastases in 4 control mice vs 997 metastases in 3 tinzaparin-treated mice (metastasis area, P = .022; metastasis number, P = .009. Error bars: 95% CI. (E-F) Quantification of metastasis number and overall tumor burden in control vs antithrombotic-treated mice after breast cancer cell injection. Dabigatran, 12 mice vs 11 control mice (metastasis number, P = .020; tumor load, P = .011); ASAC, 10 mice vs 11 control mice (metastasis number, P = .539; tumor load, P = .675); tirofiban, 7 mice vs 11 control mice (metastasis number, P = .119; tumor load, P = .230); anti-GPIb platelet depletion, 7 mice vs 11 isotype-control mice (metastasis number, P = .141; tumor load, P = .529. Boxplot. (G) Representative images of high-resolution MRI scans of mouse brains. BMs (arrowheads) are hyperintense in T1_RARE weighted contrast-enhanced images. Scale bar: 10 mm. p.o., orally; s.c., subcutaneously. All P values from Student t test. *P < .05.
Effects of antithrombotic drugs on BM formation. (A) Experimental design. APT via anticoagulation with tinzaparin (tinza) or dual platelet inhibition with ASA/clopidogrel (ASAC) was started 2 days before heart injection and continued with daily application until day 10 after heart injection. (B) Flowchart of the brain metastatic cascade over 1 month to compare the fate of brain-arrested TCs with anticoagulative or antithrombotic treatment compared with a control (ctr) group. For each step of the metastatic cascade, the total number of surviving (white) vs dying (black) TCs is given, as well as the likelihood to reach the next step of the cascade (%). Jimt1, 138 metastases in 4 control mice vs 212 metastases in 3 tinzaparin-treated mice vs 204 metastases in 3 ASAC-treated mice; A2058, 156 metastases in 4 control mice vs 130 metastases in 3 tinzaparin-treated mice; H1, 127 metastases in 3 control mice vs 162 metastases in 3 tinzaparin-treated mice. χ2 test analysis for successful extravasation or micro- or macrometastasis formation was not significant. (C) Representative images of hematoxylin and eosin (H&E)–stained brain sections for quantification of overall tumor load at the ultimate end point on day 28. Metastases were counted in whole brain slides (white arrows). The higher magnifications show the morphology of 1 single brain metastasis and the colored outline used for area calculations: vascular co-optive growing metastases present with extensive perivascular protrusions and show a diffuse infiltration of TCs into the surrounding parenchyma, which were then counted as parts of 1 major metastasis. Scale bars for overview, 1 mm; for zoomed-in view, 200 µm. (D) Quantification of mean metastasis size and number in control vs tinzaparin-treated mice with breast cancer metastases. Jimt1, 1222 metastases in 4 control mice vs 997 metastases in 3 tinzaparin-treated mice (metastasis area, P = .022; metastasis number, P = .009. Error bars: 95% CI. (E-F) Quantification of metastasis number and overall tumor burden in control vs antithrombotic-treated mice after breast cancer cell injection. Dabigatran, 12 mice vs 11 control mice (metastasis number, P = .020; tumor load, P = .011); ASAC, 10 mice vs 11 control mice (metastasis number, P = .539; tumor load, P = .675); tirofiban, 7 mice vs 11 control mice (metastasis number, P = .119; tumor load, P = .230); anti-GPIb platelet depletion, 7 mice vs 11 isotype-control mice (metastasis number, P = .141; tumor load, P = .529. Boxplot. (G) Representative images of high-resolution MRI scans of mouse brains. BMs (arrowheads) are hyperintense in T1_RARE weighted contrast-enhanced images. Scale bar: 10 mm. p.o., orally; s.c., subcutaneously. All P values from Student t test. *P < .05.
VWF colocalizes with brain seeding TCs
Because thrombin mediates the secretion of endothelial VWF (a multimeric molecule known to promote thrombosis and metastasis21,27 ), in vivo VWF imaging was performed using a specific fluorescence-labeled anti-VWF antibody. With this technique, we were able to observe hemostatically active VWF fibers in the lumen of cerebral microvessels (Figure 6A-B). In contrast to platelet accumulation, the VWF signal was not as abundant, but it was more refined to specific microvascular areas adjacent to arrested TCs (supplemental Figure 3A). In line with that observation, immunohistochemical analyses confirmed VWF and fibrin positivity at the site of arrested TCs (Figure 6C; supplemental Figure 3B). Next, we revisited our data in breast cancer patients suffering from BMs. To this end, we analyzed tumor-free brain tissue adjacent to BMs. In human brain tissue, we could confirm VWF release and platelet binding next to human breast cancer brain metastases (Figure 6D). Because luminal VWF fibers mediate the recruitment and extravasation of neutrophils promoting inflammation and metastasis,28,29 we next analyzed the contribution of monocytes and neutrophils in early steps of the metastatic cascade (supplemental Figure 3C). In contrast to lung metastasis, we observed no monocytes or neutrophils in BMs.
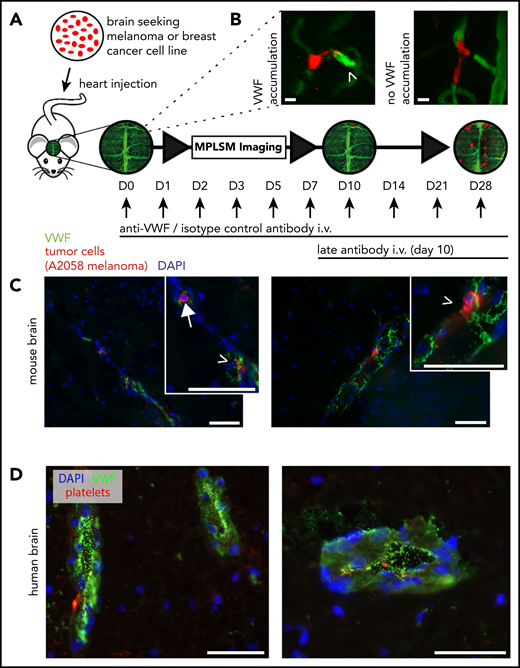
Interaction of melanoma and breast cancer brain seeding TCs with VWF. (A) Experimental design of in vivo MPLSM imaging in anti-VWF–treated mice vs isotype control antibody–treated mice. Treatment was started 30 minutes before TC injection, then given once per day, and then following the imaging schedule after day 3. Late antibody treatment started on day 10. Individual arrested TCs were followed throughout the brain metastatic cascade until day 28 after TC injection. (B) Representative images of intravital VWF immunofluorescence staining with anti-VWF antibody on day 3 after TC injection. It was obligatory to evaluate a clear green fluorescence signal accumulation (arrowhead) as positive VWF activation (VWF relative fluorescence intensity ∼1.5×; semi-quantitative analysis). Faint background vessel signal represents unbound FITC-labeled antibody, creating an angiogram. Scale bars: 10 µm. (C) Mouse brain slides. Representative images with immunofluorescent staining of an arrested intravascular A2058 melanoma cell (arrow) and possibly extravasating TCs (arrow heads) and their interaction with VWF fibers (green). 4,6 Diamidino-2-phenylindole (DAPI) staining in blue. Scale bars: 50 µm. (D) Human brain slides. Images with immunofluorescent staining of human perimetastatic brain tissue around a breast cancer brain metastasis. Abundant VWF fibers (green) are detectable in associated vessels and endothelial cells. DAPI staining (blue) and platelet staining (red). Scale bars: 50 µm.
Interaction of melanoma and breast cancer brain seeding TCs with VWF. (A) Experimental design of in vivo MPLSM imaging in anti-VWF–treated mice vs isotype control antibody–treated mice. Treatment was started 30 minutes before TC injection, then given once per day, and then following the imaging schedule after day 3. Late antibody treatment started on day 10. Individual arrested TCs were followed throughout the brain metastatic cascade until day 28 after TC injection. (B) Representative images of intravital VWF immunofluorescence staining with anti-VWF antibody on day 3 after TC injection. It was obligatory to evaluate a clear green fluorescence signal accumulation (arrowhead) as positive VWF activation (VWF relative fluorescence intensity ∼1.5×; semi-quantitative analysis). Faint background vessel signal represents unbound FITC-labeled antibody, creating an angiogram. Scale bars: 10 µm. (C) Mouse brain slides. Representative images with immunofluorescent staining of an arrested intravascular A2058 melanoma cell (arrow) and possibly extravasating TCs (arrow heads) and their interaction with VWF fibers (green). 4,6 Diamidino-2-phenylindole (DAPI) staining in blue. Scale bars: 50 µm. (D) Human brain slides. Images with immunofluorescent staining of human perimetastatic brain tissue around a breast cancer brain metastasis. Abundant VWF fibers (green) are detectable in associated vessels and endothelial cells. DAPI staining (blue) and platelet staining (red). Scale bars: 50 µm.
Inhibition of VWF attenuates the formation of brain micrometastases
Administration of the anti-VWF fluorescent antibody in vivo demonstrated VWF positivity in 79% of all intravascularly arrested Jimt1 cells and 50% of A2058 and 31% of H1 melanoma cells (Figure 7A), which is consistent with the differential clot formation rates in these models. Compared with untreated controls, the subsequent metastatic outgrowth in the perivascular niche into a micrometastasis from day 3 to day 14 was significantly impaired in the Jimt1 breast cancer model (Figure 7B-C). Similar trends were detectable for the melanoma models, but statistical significance was not reached (Figure 7C; supplemental Figure 4A). To investigate whether anti-VWF treatment remains effective when it is started after TC extravasation, administration of anti-VWF antibody was initiated as late as day 10 after intracardial TC injection. Here, anti-VWF treatment no longer showed any significant effects on the fate of TCs in the perivascular niche (Figure 7C). To analyze leakage for VWF during initial steps of brain colonization by TCs, sodium fluorescein (molecular weight, 376.27 g/mol)8 and IgG extravasation were measured. We could not detect any increase in vascular permeability within the first 5 days after TC injection (supplemental Figure 4B-E). Together these data indicate that the therapeutic anti-VWF antibody solely displayed its activity within brain microvessels and had no access to extravasated TCs.
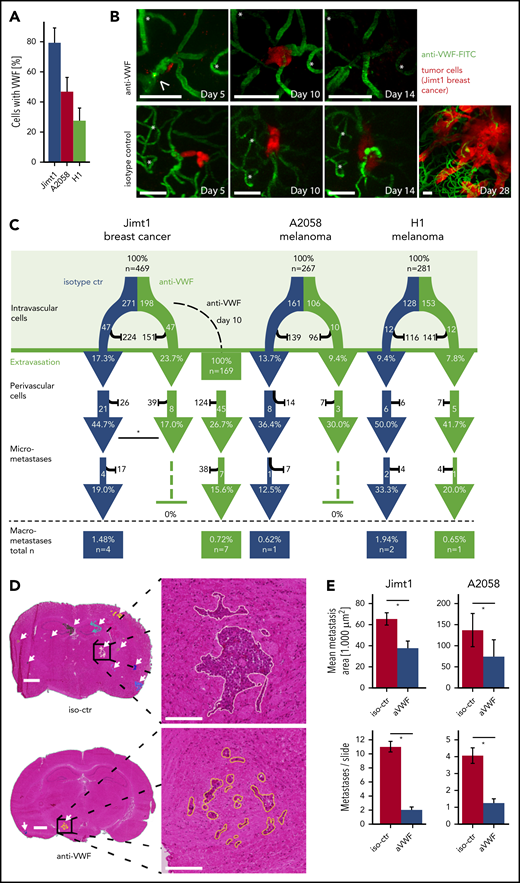
Inhibition of VWF reduces brain metastasis formation. (A) Quantification of arrested TCs on day 1 after intracardial injection with positive VWF signal. Jimt1, 198 metastases in 3 anti-VWF–treated mice; A2058, 183 metastases in 4 anti-VWF treated mice; H1, 150 metastases in 3 anti-VWF–treated mice. (B) MPLSM in vivo images of Jimt1 breast cancer metastases over time. Asterisks: Unique vessel formations used as reference coordinates. Arrowhead: remaining intravascular VWF accumulation that typically disappeared by day 10. Scale bars: 50 µm. (C) The brain metastatic cascade over 1 month represented as a flowchart to compare isotype control (iso-ctr) vs anti-VWF treatment. For each step of the metastatic cascade, the total number of TCs followed, and the likelihood of these cells to reach the next step (%) is shown. Jimt1, 271 metastases in 3 isotype-ctr mice vs 198 metastases in 3 anti-VWF–treated mice (successful micrometastasis P = .007) vs 169 metastases in 3 delayed anti-VWF–treated mice (successful micrometastasis P = .245). A2058, 161 metastases in 4 isotype-ctr mice vs 106 metastases in 3 anti-VWF–treated mice (successful micrometastasis P = 1.0). H1, 128 metastases in 4 isotype-ctr mice vs 153 metastases in 3 anti-VWF–treated mice (successful micrometastasis P = 1.0). All P values for panel C from χ2 test. (D) Representative H&E-stained brain sections of mice with Jimt1 treated with anti-VWF on days 0 to 28 after TC injection. Number of metastases was counted in whole brain slides (white arrows). The higher magnifications show the morphology of a single brain metastasis and the outline used for area calculations. Vascular co-optive growing metastases presented with extensive perivascular protrusions and showed a diffuse infiltration of TCs into the surrounding parenchyma, which were then counted as parts of 1 major metastasis. Scale bars for the overview: 1 mm; for the zoomed-in view: 200 µm. (E) Quantification of H&E-stained histology slides. Jimt1, 1588 metastases in 3 iso-ctr mice vs 294 metastases in 3 aVWF-treated mice (metastasis area P = .0001; metastasis number P = .0001). A2058, 577 metastases in 3 iso-ctr mice vs 117 metastases in 2 aVWF-treated mice (metastasis area P = c.028; metastasis number P = .0001). All P values for panel D from Student t test. All error bars: 95% CI. *P < .05.
Inhibition of VWF reduces brain metastasis formation. (A) Quantification of arrested TCs on day 1 after intracardial injection with positive VWF signal. Jimt1, 198 metastases in 3 anti-VWF–treated mice; A2058, 183 metastases in 4 anti-VWF treated mice; H1, 150 metastases in 3 anti-VWF–treated mice. (B) MPLSM in vivo images of Jimt1 breast cancer metastases over time. Asterisks: Unique vessel formations used as reference coordinates. Arrowhead: remaining intravascular VWF accumulation that typically disappeared by day 10. Scale bars: 50 µm. (C) The brain metastatic cascade over 1 month represented as a flowchart to compare isotype control (iso-ctr) vs anti-VWF treatment. For each step of the metastatic cascade, the total number of TCs followed, and the likelihood of these cells to reach the next step (%) is shown. Jimt1, 271 metastases in 3 isotype-ctr mice vs 198 metastases in 3 anti-VWF–treated mice (successful micrometastasis P = .007) vs 169 metastases in 3 delayed anti-VWF–treated mice (successful micrometastasis P = .245). A2058, 161 metastases in 4 isotype-ctr mice vs 106 metastases in 3 anti-VWF–treated mice (successful micrometastasis P = 1.0). H1, 128 metastases in 4 isotype-ctr mice vs 153 metastases in 3 anti-VWF–treated mice (successful micrometastasis P = 1.0). All P values for panel C from χ2 test. (D) Representative H&E-stained brain sections of mice with Jimt1 treated with anti-VWF on days 0 to 28 after TC injection. Number of metastases was counted in whole brain slides (white arrows). The higher magnifications show the morphology of a single brain metastasis and the outline used for area calculations. Vascular co-optive growing metastases presented with extensive perivascular protrusions and showed a diffuse infiltration of TCs into the surrounding parenchyma, which were then counted as parts of 1 major metastasis. Scale bars for the overview: 1 mm; for the zoomed-in view: 200 µm. (E) Quantification of H&E-stained histology slides. Jimt1, 1588 metastases in 3 iso-ctr mice vs 294 metastases in 3 aVWF-treated mice (metastasis area P = .0001; metastasis number P = .0001). A2058, 577 metastases in 3 iso-ctr mice vs 117 metastases in 2 aVWF-treated mice (metastasis area P = c.028; metastasis number P = .0001). All P values for panel D from Student t test. All error bars: 95% CI. *P < .05.
To gain deeper insights into the effects of VWF inhibition on total BM load, MRI and overall survival experiments were performed. Histologic analyses and computer-assisted quantifications demonstrated that VWF inhibition correlates with a significant reduction of both the total number and total size of macrometastases (Figure 7D-E; supplemental Figure 5A). Statistical significance was not reached for survival experiments, but 2 mice lived for more than 60 days, which has never been observed with control mice in this robust model, in which death from brain and systemic metastases always occurs around day 30 (supplemental Figure 5B-C). Therefore, we conclude that VWF inhibition is a promising approach for preventing the formation of BMs.
Discussion
A growing body of evidence suggests that platelets and the coagulation system can be involved in the process of organ metastasis.30,31 However, the mechanisms of the interplay between TCs and the cellular and plasmatic coagulation system is far from being clear, which includes the process of BM formation. Our newly developed intravital microscopy methodology allowed us to dissect which steps of the multistep process of brain metastasis are actually affected by clot formation and antithrombotic therapy in the living mouse: first and foremost, it is the TC arrest in brain capillaries. To the best of our knowledge, this methodology was used for the first time to convincingly demonstrate the importance of specific microvascular clot formation at arrested TCs for successful organ metastasis.
Here we provide evidence for a key role of thrombin for clot formation in the brain microvasculature as the starting point of brain metastasis. TF on the cell surface interacts with the plasmatic coagulation and promotes the generation of thrombin.32 A high TF expression in the tumor tissue of cancer patients has been correlated with tumor progression, a worse prognosis, and thrombotic complications.33 In line with previous studies,34,35 we show a high TF expression of Jimt1 breast cancer cells. However, the absence of TF in the A2058 and H1 melanoma cell lines did not abolish thrombin generation, which suggests a direct activation of thrombin by these cells. Indeed, previous publications identified a tumor-derived cysteine protease, which promotes thrombin generation via activation of coagulation FX and is referred to as cancer procoagulant.36 Thrombin then exerts its procoagulant activity via enzymatic conversion of fibrinogen to fibrin polymers,37 platelet aggregation, and the secretion of endothelial VWF multimers.34,35,38 By using in vivo MPLSM, we found that the initial TC arrest was associated with platelet recruitment and the deposition of fibrinogen and VWF. Furthermore, clot formation represented an essential step in TC extravasation and therefore in BM. We also demonstrated that antithrombin strategies with dabigatran or the LMWH tinzaparin can reduce TC arrest and brain metastatic load of specific tumors. Clinical studies using LMWH in cancer patients have variable results with regard to prolonged overall survival.6,39-41 Reasons for this controversial outcome might be explained by inclusion of different tumor types, disease stages, and the applied LMWH. Indeed, differences in length and chemical composition define antimetastatic properties of heparins.21,27 Tinzaparin exerts its activity via inhibition of thrombin and FX, and the binding of VEGF-A, both required for TC-mediated VWF secretion.21 In addition, genetic inhibition of VWF multimer degradation in a mouse with depletion of ADAMTS13 (an enzyme that cleaves and inactivates VWF) resulted in increased lung metastases after intravenous injection of TCs.27 Here, tinzaparin treatment and VWF inhibition caused less TC arrest in the breast cancer model and the H1 melanoma model. Our results further suggest that VWF is also relevant for the process of micrometastasis growth in the typical vascular co-option mode along brain capillaries: anti-VWF treatment resulted in a reduced BM count and a smaller mean macrometastasis size in both melanoma and breast cancer models. Moreover, TC survival in the perivascular niche was reduced in the breast cancer model.
VWF has been involved in many biological processes, including cell proliferation, coagulation, and inflammation,42 which might explain the effects of anti-VWF treatment observed here. One hypothesis was that VWF expression in cells of the vascular wall is important for supporting perivascular co-optive metastatic growth, possibly through integrins. Interaction of VWF with integrins is known,43 and integrin beta-1 inhibition has been shown to reduce the capacity of co-optive TC growth in the perivascular niche in the brain.44 Another explanation could be that VWF-induced clots prolong the survival of arrested TCs and promote the extravasation process, since it was demonstrated that luminal VWF fibers mediate the recruitment and extravasation of neutrophils and TCs.27,28
TC-platelet interactions fostering BMs could be excluded by the findings of this study. Simultaneous inhibition of platelet cyclooxygenase 1 (COX-1) and adenosine 5′-diphosphate–mediated platelet activation with ASAC45,46 did not affect BMs. Previous studies demonstrated that this dual therapy with clopidogrel and aspirin even promotes mortality in a mouse model for breast cancer.47 Because it was shown that integrin-mediated TC-platelet interactions promote metastasis,48,49 platelet-depleted plasma and the GPIIb/GPIIIa antagonist tirofiban were applied. Again, we could not detect any effect on the formation of BMs upon those treatments. Our in vitro examinations showing that TCs are not able to mediate platelet aggregation via cell-cell contact provide a sound explanation for the observed lack of therapeutic efficacy. So far, no specific antiplatelet therapy has been included in standard tumor treatment.48
Limitations of this study should be considered. One limitation is that although the in vivo MPLSM methodology allowed deep insights into the brain metastatic cascade, it did not allow investigations of extracranial metastases. Furthermore, the glass used to cover the cranial window allows the evaluation of only relatively small brain volumes up to a depth of 500 μm for intravital imaging studies.
All in all, we show here that microclot formation at the exact location of TC arrest in brain microvessels drives BM formation. From there, blocking the plasmatic coagulation system by using direct (dabigatran, LMWH) and indirect (LMWH) thrombin inhibitors attenuates BM formation in our mouse model (supplemental Table 1). No bleeding complications were detectable, which mirrors clinical observations that an anticoagulatory therapy in patients with BMs did not increase the risk of intracerebral bleedings.50,51 Moreover, inhibition of VWF by using an anti-VWF antibody also attenuated BM formation. These results point to a pivotal role of thrombin and VWF for brain colonization by TCs. In contrast, various solely antiplatelet treatments were not effective for reducing overall BM formation in this study. However, these results do not exclude a relevant role of platelets to act in concert with the plasmatic coagulation system to push tumor spreading. The single-agent benefits of antithrombin treatments (by using direct inhibitors of FII, FX, and LMWH) and anti-VWF treatments shown here, together with their good tolerability, make these drugs prime candidates for future clinical BM prevention trials.
For original data, please contact Frank Winkler at frank.winkler@med.uni-heidelberg.de.
The online version of this article contains a data supplement.
The publication costs of this article were defrayed in part by page charge payment. Therefore, and solely to indicate this fact, this article is hereby marked “advertisement” in accordance with 18 USC section 1734.
Acknowledgments
The authors thank Sabine Vidal-y-Si for excellent technical help.
This work was supported by grants from the German Research Council (RTG2099) (M.J.F., J.R.R., C.T., B.K., A.T.B., S.W.S., and F.W.), from the Deutsche Krebshilfe (German Cancer Aid), Priority Program “Translational Oncology,” #70112507, “Preventive strategies against brain metastases” (F.W., W.W., and A.S.B.), and from the Erich and Gertrud Roggenbuck-Stiftung (A.T.B. and J.R.R.).
Authorship
Contribution: M.J.F., S.W.S., A.T.B., and F.W. wrote the manuscript, which was reviewed and edited by all authors; F.W., W.W., and S.W.S. designed the study and supervised the work; M.J.F., A.S.B., V.V., G.S., C.T., and J.K.G. performed in vivo experiments; M.J.F., J.R.R., C.T., M.A.K., K.G., B.K., F.T.M., M.O.B., M.B., and A.T.B. performed ex vivo experiments; M.F. and M.O.B. provided magnetic resonance imaging; and M.A.K and Y.S. performed electron microscopy experiments.
Conflict-of-interest disclosure: F.W. has received research funding from Roche, Genentech, Boehringer Ingelheim, and Divide & Conquer. G.S. is an employee of Carl Zeiss Microscopy. The remaining authors declare no competing financial interests.
Correspondence: Frank Winkler, Neurology Clinic and National Center for Tumor Diseases, University Hospital Heidelberg, Im Neuenheimer Feld 400, 69120 Heidelberg, Germany; e-mail: frank.winkler@med.uni-heidelberg.de.

This feature is available to Subscribers Only
Sign In or Create an Account Close Modal