

Key Points
Deficiency of the equilibrative nucleotide transporter ENT1 results in abnormal erythropoiesis in humans and mice.
Inhibition of the ABCC4 cyclic nucleotide exporter enhances erythroid differentiation in the absence of ENT1.

Abstract
The tight regulation of intracellular nucleotides is critical for the self-renewal and lineage specification of hematopoietic stem cells (HSCs). Nucleosides are major metabolite precursors for nucleotide biosynthesis and their availability in HSCs is dependent on their transport through specific membrane transporters. However, the role of nucleoside transporters in the differentiation of HSCs to the erythroid lineage and in red cell biology remains to be fully defined. Here, we show that the absence of the equilibrative nucleoside transporter (ENT1) in human red blood cells with a rare Augustine-null blood type is associated with macrocytosis, anisopoikilocytosis, an abnormal nucleotide metabolome, and deregulated protein phosphorylation. A specific role for ENT1 in human erythropoiesis was demonstrated by a defective erythropoiesis of human CD34+ progenitors following short hairpin RNA-mediated knockdown of ENT1. Furthermore, genetic deletion of ENT1 in mice was associated with reduced erythroid progenitors in the bone marrow, anemia, and macrocytosis. Mechanistically, we found that ENT1-mediated adenosine transport is critical for cyclic adenosine monophosphate homeostasis and the regulation of erythroid transcription factors. Notably, genetic investigation of 2 ENT1null individuals demonstrated a compensation by a loss-of-function variant in the ABCC4 cyclic nucleotide exporter. Indeed, pharmacological inhibition of ABCC4 in Ent1−/− mice rescued erythropoiesis. Overall, our results highlight the importance of ENT1-mediated nucleotide metabolism in erythropoiesis.
Introduction
The commitment of hematopoietic stem cells (HSCs) to the erythroid lineage is a complex process controlled by extrinsic factors as well as the physical interaction of HSCs with their microenvironment.1-5 Nutrient resources and their transport has recently emerged as key regulators of HSC proliferation and lineage commitment.6-8 Notably, a sufficient intracellular nucleotide pool has been shown to be essential for erythroid lineage commitment of HSCs.6 Nucleotide biosynthesis is regulated by the intracellular availability of glutamine and the shunting of glucose from glycolysis pathway through the pentose phosphate pathway.6 Nucleotides are indispensable precursors for RNA and DNA synthesis and are extremely important for cell division.9,10 Balanced pools of intracellular nucleotides are crucial to avoid DNA damage in erythroid and lymphoid lineages.11-14 Furthermore, nucleotide homeostasis is also crucial for terminal erythroid differentiation and the generation of mature red blood cells (RBCs). Cyclic adenosine monophosphate (cAMP)- and guanosine 3′,5′-cyclic monophosphate (cGMP)-mediated signaling is associated with the regulation of erythropoiesis through the modulation of numerous signaling pathways15-23 and the activation of important erythroid-specific transcription factors.24,25
HSCs lack the capacity to carry out de novo nucleoside synthesis,26 and thus rely on membrane transporters to acquire nucleosides for DNA and RNA synthesis and adenosine triphosphate (ATP) production.26 The major source of nucleoside recycling is the degradation of nucleic acids, arising from autophagic (or phagocytic) pathways26 and the degradation of nucleotides in the extracellular compartment. The equilibrative nucleoside transporter 3 (ENT3) is the major nucleoside transporter responsible for maintaining nucleoside homeostasis in lysosomal and mitochondrial compartments.27,28 In humans, ENT3 alteration causes numerous genetic disorders with a wide spectrum of clinical manifestations including hematological abnormalities.29-33 Mechanistically, the altered commitment of ENT3-deficient HSCs is caused by the loss of lysosomal adenosine transport, which impedes autophagy-regulated HSC fates.33 However, ENT1 is the major plasma membrane transporter in HSCs that ensures nucleoside uptake from the extracellular compartment.34,35 ENT1 plays a central role in the homeostasis of plasma adenosine which is generated extracellularly by the degradation of ATP via the ectonucleotidases CD39 and CD73.36,37 Although extracellular uptake of nucleosides is an important step in nucleotide biosynthesis, its specific contribution in driving HSC lineage commitment remains to be defined. This is of critical interest as humans with ENT1 deficiency, because of a c.589+1G>C mutation in the SLC29A1 gene encoding ENT1, have recently been described.38
Here, we demonstrate that ENT1 deficiency in humans and mice is associated with erythroid defects and identify a functional link between ENT1 and ABCC4-mediated cyclic nucleotide metabolism in erythroid differentiation. Our genetic and pharmacological findings open new avenues for the development of novel therapeutic strategies for the treatment of anemia.
Methods
Detailed protocols for all methods are provided in supplemental Methods, available on the Blood Web site.
Blood samples
Fresh peripheral blood samples were obtained from healthy donors from the Etablissement Français du Sang and ENT1null patients after obtaining written informed consent.
Ex vivo erythropoiesis
Human primary CD34 cells, isolated from the peripheral blood of patients and healthy donors or from cord blood, were cultured as described in the supplemental Methods.
Lentiviral ENT1 knockdown
ENT1 was downregulated in CD34+ progenitors using a short hairpin RNA (shRNA) approach.
Metabolomics and phosphoproteomics
Phosphoproteomic analyses were performed using the label-free proteomic methodology. Intracellular pools of nucleotides were quantified by high-performance liquid chromatography mass spectrometry.
Ent1−/− mice model
All protocols involving animal studies were reviewed and approved by the Institutional Animal Welfare Committee of the University of Texas Health Science Center at Houston.
Results
ENT1-deficiency in human RBCs is associated with membrane and metabolomic disorders
A homozygous splicing mutation in the SLC29A1 gene was previously identified in 3 Augustine-null phenotype siblings (P1, P2, P3), resulting in total deficiency of ENT138 (Figure 1A; supplemental Figure 1). RBC indices of the 3 ENT1null probands revealed macrocytosis (mean corpuscular volume, 104-108 fL) and increased cell hemoglobin (Hb) content (mean hemoglobin concentration, 34-37 pg) but normal cell Hb concentration (mean corpuscular volume concentration) (supplemental Table 1). The normal reticulocyte counts in all probands are consistent with the absence of anemia and hemolysis (normal lactate dehydrogenase and haptoglobin values). However, morphological examination revealed >40% of RBCs with altered cell shapes and sizes, a characteristic of anisopoikilocytosis, in all 3 patients (Figure 1B). Although RBCs from P1 and P2 showed similar morphological alterations, the blood smear of P3 revealed a more severe phenotype with the presence of elliptocytes and a higher percentage of schizocytes (Figure 1B-C). Furthermore, in conjunction with more severe morphological abnormalities, RBC membrane deformability was impaired in the P3 proband as reflected by the extent of increase in Elongation Index as a function of increasing applied shear stress39 (Figure 1D). ENT1null RBCs displayed heterogenous osmotic gradient ektacytometry profiles, confirming distinct RBC changes in these patients with the profile in P3 consistent with elliptocytosis (Figure 1E). This macrocytosis was not due to deficiency of either vitamin B12 or folate in ENT1null probands because their levels were within the normal range (539 ± 134 pmol/L and 9.2 ± 0.2 nmol/L, respectively). Except for moderate ectopic mineralization also observed in slc29a1−/− mice,40 ENT1null probands did not exhibit significant nonhematological clinical manifestations.38
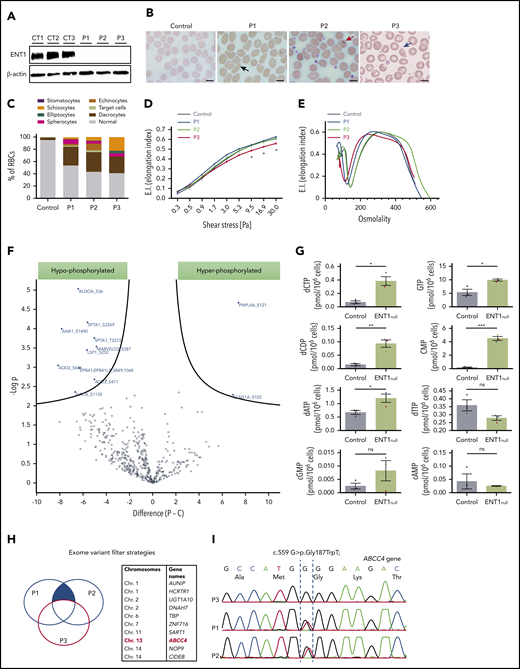
Red cell alterations in ENT1null individuals. (A) Western blot analysis of ENT1 expression in ENT1null RBC membranes from the 3 siblings. β-actin was used as loading control. (B) Blood smears of ENT1null individuals showing a macrocytosis and marked anisopoikilocytosis, characterized by the presence of RBCs with abnormal sizes and morphologies, including elliptocytes (black arrow), dacrocytes (red arrow), and schizocytes (blue arrow). Scale bars, 10 µm. (C) Quantification of the different RBC populations was calculated from 300 RBCs per slide. (D) RBC deformability was assessed by an ektacytometry approach and elongation index relative to shear stress is shown for controls, P1, P2, and P3, and 7 controls. (E) Osmoscan test of ENT1null RBCs from the 3 patients and a healthy control was monitored by ektacytometry. (F) The phosphoproteome of ENT1null (n = 3) and control (n = 5) RBC membranes was evaluated. Each dot represents a phosphorylated protein, with blue dots corresponding to significantly hypophosphorylated (left) and hyperphosphorylated (right) proteins. (G) Nucleotide-targeted metabolomic analysis of ENT1null (n = 3; P1, blue; P2, green; P3, red triangles) and control (n = 3; black circles) RBCs were performed and intracellular levels of deoxynucleotides and cyclic nucleotides (cAMP, cGMP) are shown. (H) Schematic representation of the variant filter strategy used to analyze the exome sequencing of ENT1null patients. Common mutations between P1 and P2, but absent in P3 (blue filled area) were filtered, candidate genes identified, and their chromosomes are shown in the table. (I) Sanger sequencing confirmation of the c.559 G>T; p.Gly187Trp mutation on the ABCC4 gene, showing the absence of the mutation in P3, and its presence in the heterozygous state in P1 and P2.
Red cell alterations in ENT1null individuals. (A) Western blot analysis of ENT1 expression in ENT1null RBC membranes from the 3 siblings. β-actin was used as loading control. (B) Blood smears of ENT1null individuals showing a macrocytosis and marked anisopoikilocytosis, characterized by the presence of RBCs with abnormal sizes and morphologies, including elliptocytes (black arrow), dacrocytes (red arrow), and schizocytes (blue arrow). Scale bars, 10 µm. (C) Quantification of the different RBC populations was calculated from 300 RBCs per slide. (D) RBC deformability was assessed by an ektacytometry approach and elongation index relative to shear stress is shown for controls, P1, P2, and P3, and 7 controls. (E) Osmoscan test of ENT1null RBCs from the 3 patients and a healthy control was monitored by ektacytometry. (F) The phosphoproteome of ENT1null (n = 3) and control (n = 5) RBC membranes was evaluated. Each dot represents a phosphorylated protein, with blue dots corresponding to significantly hypophosphorylated (left) and hyperphosphorylated (right) proteins. (G) Nucleotide-targeted metabolomic analysis of ENT1null (n = 3; P1, blue; P2, green; P3, red triangles) and control (n = 3; black circles) RBCs were performed and intracellular levels of deoxynucleotides and cyclic nucleotides (cAMP, cGMP) are shown. (H) Schematic representation of the variant filter strategy used to analyze the exome sequencing of ENT1null patients. Common mutations between P1 and P2, but absent in P3 (blue filled area) were filtered, candidate genes identified, and their chromosomes are shown in the table. (I) Sanger sequencing confirmation of the c.559 G>T; p.Gly187Trp mutation on the ABCC4 gene, showing the absence of the mutation in P3, and its presence in the heterozygous state in P1 and P2.
To further evaluate the RBC membrane defect in ENT1null RBCs, we performed a comparative global phosphoproteomic analysis of RBC membrane proteins. This analysis was performed because changes in cyclic nucleotide levels have long been known to affect protein kinases and thereby the phosphorylation state of the cell.41 Phosphoproteome analysis identified 501 serine, threonine, and tyrosine phosphorylation sites in 182 cytoskeletal and transmembrane proteins across all samples (supplemental Excel file). Ten serine sites were differentially hypophosphorylated in 8 proteins from ENT1null RBCs (Figure 1F, P < .01; supplemental Figure 2); these proteins included membrane proteins such as spectrin, ankyrin, adducin, and protein 4.1 as well as non-membrane proteins such as ALDOA. Notably, these membrane proteins form a complex that is critical for membrane stability and RBC morphology.42,43 Interestingly though, Triton X-100 extractability of these proteins from ENT1null RBCs was unchanged compared with controls (supplemental Figure 3), suggesting that other molecular mechanism(s) besides spectrin-based skeletal complexes underlie the abnormal RBC morphology of ENT1null individuals. On the other hand, 2 proteins were hyperphosphorylated in ENT1null RBCs compared with controls; the chloride nucleotide-sensitive channel CLNSA1 (also called pICln) and PNPLA6 (Figure 1F; P < .01). Interestingly, CLNSA1 has been shown to regulate RBC volume via its interaction with the 4.1R protein.44 Moreover, some differences in protein phosphorylation can be appreciated among ENT1null ghosts (supplemental Excel file).
Because ENT1 is the major nucleoside transporter in RBCs,45 we evaluated the nucleotide-derived metabolites in ENT1null RBCs by high-performance liquid chromatography mass spectrometry. Importantly, we noted that the intracellular levels of both purine and pyrimidine nucleotides (dCTP, dCDP, common myeloid progenitor [CMP], GTP, and dATP) were significantly increased in ENT1null RBCs compared with control RBCs (Figure 1G; P < .05, P < .01, and P < .001). This accumulation of deoxynucleotides (dNTPs) in ENT1null RBCs could either be due to the altered dNTP uptake from the plasma or to an inappropriate uptake of dNTPs by the mitochondria of ENT1null erythroblasts because ENT1 has been implicated in dNTP transport across the mitochondrial membrane.46-48 Concerning the cyclic nucleotides, there were no statistically significant differences in cAMP levels between patient and control RBCs (Figure 1G). Interestingly though, cGMP levels were extremely variable, with high levels in RBCs from P1 and P2 and very low levels in P3.
These data indicated that the absence of ENT1 results in a greater phenotypic change in red cells from patient P3 as compared with patients P1 and P2. We therefore performed whole exome sequencing to assess whether other genetic variant(s) might account for these differences (Figure 1H). Analyzing whole exome sequencing data by filtering common pathogenic variants shared by P1 and P2, and not P3, led to the identification of a heterozygous loss-of-function variant in the ABCC4 gene (c.559 G>T; p.Gly187Trp). ABCC4 encodes a cyclic nucleotide exporter highly expressed in erythroid precursors (Figure 1I).49 Interestingly, this finding is consistent with the 6.3- and 5.2-fold higher level of cGMP in P1 and P2 RBCs, respectively, compared with controls (Figure 1G). Moreover, cGMP levels in P3 RBCs were actually 2.8-fold lower than in control RBCs. Thus, the ABCC4 mutation in P1 and P2 is associated with a significant increase in RBC cGMP levels compared with P3 and healthy controls, and may function to compensate for the loss of ENT1.
Differences in the ex vivo erythroid differentiation potential of CD34+ progenitors from ENT1null individuals
Having documented alterations in mature erythrocytes from ENT1null individuals, we investigated the role of ENT1 during erythropoiesis. Ex vivo erythropoiesis of CD34+ cells from the peripherical blood of all 3 ENT1null patients was investigated. CD34+ progenitors from P1 and P2 underwent erythroid differentiation in the presence of rEPO with increased expression of the glycophorin A (GPA) and Band3 erythroid markers, to similar levels as control progenitors (Figure 2A). Furthermore, in vitro reticulocyte levels for both patients at day 12 were similar to controls (40 ± 2% vs 38 ± 6% in 2 independent experiments, respectively), indicating that the absence of ENT1 in erythroid precursors from P1 and P2 did not inhibit erythroblast enucleation (Figure 2B). Interestingly, macrocytic reticulocytes were observed from the ex vivo erythroid culture of P2 (supplemental Figure 4).
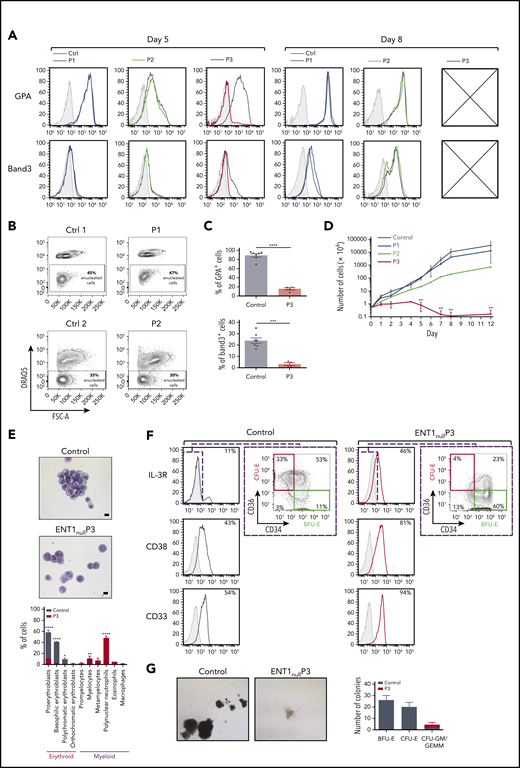
Ex vivo erythroid differentiation of CD34+ from ENT1null patients. (A) Erythroid differentiation of CD34+ progenitors was evaluated following rEPO-induced differentiation as a function of expression of the erythroid surface markers GPA and Band3. Representative histograms showing the differentiation of CD34+ progenitors from P1 (blue), P2 (green), P3 (red), controls (black), and nonspecific immunoglobulin G (IgG) staining (gray shaded) are presented at days 5 and 8 of differentiation. Crossed boxes are present when insufficient cells were available for analyses. (B) Enucleation of erythroblasts from P1 and P2 ENT1null patients and respective controls (Ctrl1 and Ctrl2) was monitored at day 12 of erythroid differentiation as a function of DRAQ5 staining. Representative fluorescence-activated cell sorting plots and the percentages of enucleated cells (DRAQ5−) are shown. (C) The percentages of GPA+ cells and Band3+ cells were quantified at day 5 of differentiation. Mean percentages ± standard error of the mean for controls (black dots, n = 7 independent experiments) and P3 ENT1null patient progenitors (red triangles, n = 2 independent experiments in duplicate) are presented. ****P < .0001; ***P = .0002 (unpaired Student t test). (D) Growth curves of progenitors from the 3 ENT1null patients (P1, n = 1; P2, n = 1; P3, n = 4) and healthy donors (n = 9) were evaluated at indicated days of erythroid differentiation. **P < .01 (unpaired Student t test). (E) Representative images of MGG-stained Cytospins at day 5 of rEPO differentiation of control and P3 ENT1null progenitors are shown (top). The bar represents 10 µm. Quantification of the different cell types is presented (n = 3 independent experiments, bottom). (F) Characterization of P3 and control progenitors were evaluated at day 7 of the expansion phase (before addition of rEPO) as a function of IL-3R, CD34, CD36, CD38, and CD33. Representative histograms showing nonspecific IgG staining (gray shaded), control (black line) and P3 (red line) staining are presented. The expression of CD34 and CD36 surface markers was analyzed on the IL-3Rneg cells to identify burst-forming unit erythroid (IL-3R−CD34+CD36−, green square) and CFU-E (IL-3R−CD34−CD36+, red square) and representative percentages are indicated. (G) CD34+ progenitor cells from a healthy donor and the P3 ENT1null patient were cultured in a methylcellulose semisolid culture assay and representative images of the generated colonies are shown. Quantification of the generated colonies is presented for 2 technical replicates.
Ex vivo erythroid differentiation of CD34+ from ENT1null patients. (A) Erythroid differentiation of CD34+ progenitors was evaluated following rEPO-induced differentiation as a function of expression of the erythroid surface markers GPA and Band3. Representative histograms showing the differentiation of CD34+ progenitors from P1 (blue), P2 (green), P3 (red), controls (black), and nonspecific immunoglobulin G (IgG) staining (gray shaded) are presented at days 5 and 8 of differentiation. Crossed boxes are present when insufficient cells were available for analyses. (B) Enucleation of erythroblasts from P1 and P2 ENT1null patients and respective controls (Ctrl1 and Ctrl2) was monitored at day 12 of erythroid differentiation as a function of DRAQ5 staining. Representative fluorescence-activated cell sorting plots and the percentages of enucleated cells (DRAQ5−) are shown. (C) The percentages of GPA+ cells and Band3+ cells were quantified at day 5 of differentiation. Mean percentages ± standard error of the mean for controls (black dots, n = 7 independent experiments) and P3 ENT1null patient progenitors (red triangles, n = 2 independent experiments in duplicate) are presented. ****P < .0001; ***P = .0002 (unpaired Student t test). (D) Growth curves of progenitors from the 3 ENT1null patients (P1, n = 1; P2, n = 1; P3, n = 4) and healthy donors (n = 9) were evaluated at indicated days of erythroid differentiation. **P < .01 (unpaired Student t test). (E) Representative images of MGG-stained Cytospins at day 5 of rEPO differentiation of control and P3 ENT1null progenitors are shown (top). The bar represents 10 µm. Quantification of the different cell types is presented (n = 3 independent experiments, bottom). (F) Characterization of P3 and control progenitors were evaluated at day 7 of the expansion phase (before addition of rEPO) as a function of IL-3R, CD34, CD36, CD38, and CD33. Representative histograms showing nonspecific IgG staining (gray shaded), control (black line) and P3 (red line) staining are presented. The expression of CD34 and CD36 surface markers was analyzed on the IL-3Rneg cells to identify burst-forming unit erythroid (IL-3R−CD34+CD36−, green square) and CFU-E (IL-3R−CD34−CD36+, red square) and representative percentages are indicated. (G) CD34+ progenitor cells from a healthy donor and the P3 ENT1null patient were cultured in a methylcellulose semisolid culture assay and representative images of the generated colonies are shown. Quantification of the generated colonies is presented for 2 technical replicates.
In contrast to P1 and P2, CD34+ progenitors from P3 patient failed to undergo ex vivo erythroid differentiation (n = 4; Figure 2A). Only 16% ± 5% of P3 cells acquired GPA expression at day 5 compared with 88% ± 9% for controls (Figure 2A,C; P < .0001). Furthermore, within the GPA+ subset, only 3% ± 2% erythroblasts exhibited an upregulation of Band3 vs 24% ± 6% in control erythroblasts (Figure 2C; P < .001). This markedly delayed erythroid differentiation was associated with increased cell death (supplemental Figure 5) and markedly decreased cell proliferation (Figure 2D; P < .01). The ineffective in vitro erythropoiesis of P3 progenitors was confirmed by May-Grunwald-Giemsa (MGG) staining, revealing immature erythroblasts in controls conditions, whereas myeloid cells were noted in cultures of P3 patient (Figure 2E). Furthermore, only 4% of P3 progenitors progressed to the erythroid colony-forming unit (CFU-E) stage, defined as IL3R−CD34−CD36+ compared with 33% of control progenitors (Figure 2F). Consistent with these data, P3 CD34+ cells failed to give rise to CFU-E colonies in methylcellulose assays, whereas control cells were able to form large burst-forming unit erythroid and CFU-E colonies (Figure 2G). Interestingly, this defect may be due to alterations in the characteristics of CD34+ progenitors migrating to the peripheral circulation, whereas CD34+ cells generally account for ∼0.5% of PBMC,50 and we detected 0.63% CD34+ cells in a representative healthy donor, the percentage of CD34+ progenitors in P3 was much lower, at 0.17% (supplemental Figure 6). Altogether, our findings highlight a difference in the ability of circulating CD34+ progenitors from P1/P2, compared with P3, to undergo ex vivo erythroid differentiation.
shRNA-mediated knockdown of ENT1 inhibits erythroid differentiation of CD34+ progenitors
To specifically assess the impact of ENT1 on erythropoiesis, we pursued an shRNA-mediated ENT1-knockdown strategy as illustrated in Figure 3A. Monitoring the surface expression profile of ENT1 during erythropoiesis by flow cytometry showed a high-level expression of ENT1 on progenitor cells before rEPO stimulation (day 0) followed by a gradual decrease during terminal erythroid maturation (Figure 3B). Transduction of cord blood CD34+ progenitors with an shENT1 lentiviral vector resulted in a pronounced reduction in SLC29A1 messenger RNA (mRNA) levels (90% ± 4%; Figure 3C) and a concomitant decrease in cell surface expression of ENT1 (40% ± 8% at day 0; supplemental Figure 7A-B). Although ENT1 knockdown did not significantly alter expression of CD34, CD36, or IL3R before rEPO-induced erythroid differentiation (day 7; supplemental Figure 8), shENT1-transduced progenitors were counterselected following addition of EPO. The percentages of GFP+ cells decreased by more than 50% between day 0 and day 5 of erythroid differentiation and by more than 80% at day 7 (Figure 3D). The negative impact of ENT1 knockdown was specific for erythroid differentiation as the percentage of shENT1-GFP+ progenitors remained stable upon expansion of CD34+ progenitors in the absence of rEPO (Figure 3D). In addition, the EPO-induced expansion of GFP+ cells was significantly lower for shENT1-transduced compared with shControl-transduced progenitors (Figure 3E). These findings strongly suggest that ENT1 expression is crucial for erythroid, but not nonerythroid, differentiation.

shRNA-mediated knockdown of ENT1 negatively impacts ex vivo erythroid differentiation. (A) Schematic representation of the schema used for ex vivo human erythropoiesis and the experimental design. Cord blood CD34+ cells were differentiated using a 3-phase culture system (containing rEPO) that recapitulates human erythropoiesis up to the enucleated reticulocyte. Cells were transduced at day 4 of the expansion phase with a lentiviral vector harboring an ENT1 shRNA or scramble together with a GFP reporter gene. Representative MGG-stained cells from healthy control are shown for corresponding differentiation stages. (B) The evolution of surface ENT1 expression during rEPO-induced (3 U/mL) erythroid differentiation was monitored by flow cytometry and representative histograms showing nonspecific IgG staining (gray shaded) and specific (black line) staining at days 0, 3, 7, and 10 of erythroid differentiation are presented, differentiating negatively and positively stained cells. The geometric mean fluorescence intensity (GMFI) is indicated in each histogram. GMFIs from 3 independent experiments were quantified and are presented as means ± standard error of the mean (SEM; right). (C) Progenitors transduced with shControl and shENT1 vector were FACS-sorted on the basis of GFP expression 3 days posttransduction and ENT1 mRNA expression levels were analyzed by quantitative real-time polymerase chain reaction and normalized to actin mRNA. mRNA ± SD relative to control cells is presented (n = 3; unpaired Student t test; ****P < .0001). (D) Transduced progenitors were cultured in the presence or absence of rEPO as indicated. The evolution of shRNA-expressing cells was followed and the percentages of GFP+ cells relative to day 1 are shown. Results correspond to data obtained from 3 independent experiments. (E) Progenitors transduced with the shControl and shENT1 vectors were FACS-sorted on the basis of GFP expression and then differentiated in the presence of EPO. Cells were counted at the indicated days and growth curves are presented for shENT1-GFP+ (gray line) and shControl-GFP+ (black line) cells. Data presented are means ± SEM of 4 independent experiments; *P < .05, ***P < .001. (F) Progenitors were transduced with shControl or shENT1 vectors, both harboring a GFP transgene. Gene transfer efficiency was evaluated as a function of GFP expression 3 days following transduction and representative histograms are shown (top). The percentages of cells expressing GPA and CD71 were evaluated by flow cytometry and representative profiles in GFP− and GFP+ subsets are presented. The percentages of positively stained cells are indicated. (G) Erythroid differentiation of control-GFP- and shENT1-GFP-transduced progenitors was monitored as a function of GPA and CD71 expression within the GFP+ cells. The percentages of GPA+ and CD71+ cells ± SEM in control (black circles) and shENT1-GFP (gray triangles) transduced progenitors are shown at days 3, 5, and 7 of culture (n = 3; unpaired Student t test; *P < .05, **P < .01, ***P < .001). (H) Enucleation was monitored at day 10 of differentiation as a function of Syto-16 staining and the percentages of Syto-16-negative cells are presented (n = 3 independent experiments; unpaired Student t test; *P = .02). (I) At day 4 of differentiation, cells were FACS-sorted on the basis of GFP expression and differentiation was continued until day 10. Erythroid differentiation was monitored as a function of Band3 expression and myeloid differentiation was monitored by CD11a/CD33 surface expression (black) and nonspecific control IgG staining (gray). Representative histograms and quantification are shown within GFP+ cells. (n = 3 independent experiments; *P < .05).
shRNA-mediated knockdown of ENT1 negatively impacts ex vivo erythroid differentiation. (A) Schematic representation of the schema used for ex vivo human erythropoiesis and the experimental design. Cord blood CD34+ cells were differentiated using a 3-phase culture system (containing rEPO) that recapitulates human erythropoiesis up to the enucleated reticulocyte. Cells were transduced at day 4 of the expansion phase with a lentiviral vector harboring an ENT1 shRNA or scramble together with a GFP reporter gene. Representative MGG-stained cells from healthy control are shown for corresponding differentiation stages. (B) The evolution of surface ENT1 expression during rEPO-induced (3 U/mL) erythroid differentiation was monitored by flow cytometry and representative histograms showing nonspecific IgG staining (gray shaded) and specific (black line) staining at days 0, 3, 7, and 10 of erythroid differentiation are presented, differentiating negatively and positively stained cells. The geometric mean fluorescence intensity (GMFI) is indicated in each histogram. GMFIs from 3 independent experiments were quantified and are presented as means ± standard error of the mean (SEM; right). (C) Progenitors transduced with shControl and shENT1 vector were FACS-sorted on the basis of GFP expression 3 days posttransduction and ENT1 mRNA expression levels were analyzed by quantitative real-time polymerase chain reaction and normalized to actin mRNA. mRNA ± SD relative to control cells is presented (n = 3; unpaired Student t test; ****P < .0001). (D) Transduced progenitors were cultured in the presence or absence of rEPO as indicated. The evolution of shRNA-expressing cells was followed and the percentages of GFP+ cells relative to day 1 are shown. Results correspond to data obtained from 3 independent experiments. (E) Progenitors transduced with the shControl and shENT1 vectors were FACS-sorted on the basis of GFP expression and then differentiated in the presence of EPO. Cells were counted at the indicated days and growth curves are presented for shENT1-GFP+ (gray line) and shControl-GFP+ (black line) cells. Data presented are means ± SEM of 4 independent experiments; *P < .05, ***P < .001. (F) Progenitors were transduced with shControl or shENT1 vectors, both harboring a GFP transgene. Gene transfer efficiency was evaluated as a function of GFP expression 3 days following transduction and representative histograms are shown (top). The percentages of cells expressing GPA and CD71 were evaluated by flow cytometry and representative profiles in GFP− and GFP+ subsets are presented. The percentages of positively stained cells are indicated. (G) Erythroid differentiation of control-GFP- and shENT1-GFP-transduced progenitors was monitored as a function of GPA and CD71 expression within the GFP+ cells. The percentages of GPA+ and CD71+ cells ± SEM in control (black circles) and shENT1-GFP (gray triangles) transduced progenitors are shown at days 3, 5, and 7 of culture (n = 3; unpaired Student t test; *P < .05, **P < .01, ***P < .001). (H) Enucleation was monitored at day 10 of differentiation as a function of Syto-16 staining and the percentages of Syto-16-negative cells are presented (n = 3 independent experiments; unpaired Student t test; *P = .02). (I) At day 4 of differentiation, cells were FACS-sorted on the basis of GFP expression and differentiation was continued until day 10. Erythroid differentiation was monitored as a function of Band3 expression and myeloid differentiation was monitored by CD11a/CD33 surface expression (black) and nonspecific control IgG staining (gray). Representative histograms and quantification are shown within GFP+ cells. (n = 3 independent experiments; *P < .05).
To address the effect of ENT1 downregulation on terminal erythroid differentiation, we monitored the surface expression of the GPA and CD71 erythroid markers. EPO-induced erythroid differentiation of hematopoietic progenitors was significantly attenuated following ENT1 downregulation and, notably, this effect was only detected in the shENT1-transduced subset (Figures 3F-G). At day 3 of differentiation, only 42% ± 5% and 41% ± 8% of shENT1-transduced cells expressed GPA and CD71, respectively, compared with 55% ± 9% and 66% ± 5% of shControl-transduced cells (P < .01 and P < .05; Figure 3G). Consistent with this finding, erythroblast enucleation was significantly reduced in shENT1-GFP-transduced cells (5% ± 2% vs 20% ± 6%, P < .05; Figure 3H). In addition, flow cytometry analysis revealed that >25% of shENT1-transduced progenitors expressed the CD11a and CD33 myeloid markers compared with only 4% of control cells (P < .05; Figure 3I). Overall, these findings reveal an important role for ENT1 in erythroid differentiation.
Ent1−/− mice resemble ENT1null patients displaying macrocytic RBCs and exhibit altered erythroid lineage differentiation
To assess whether the absence of ENT1 in humans results in similar alterations in ENT1null mice, we analyzed the complete blood count in 8- to 12-week-old Ent1−/− mice compared with their wild-type (WT) counterparts. Both male and female Ent1−/− mice exhibited a macrocytosis and increased mean hemoglobin concentration that was similar to that detected in ENT1-deficient patients (supplemental Table 2); blood smears revealed an increased size of RBCs in Ent1−/− mice (Figure 4A), as well as a significantly increased mean corpuscular volume (P < .01). Additionally, RBC numbers and hematocrit were reduced in both male and female Ent1−/− mice compared with gender-matched control mice (supplemental Table 2). These findings point to similarities as well as differences in the erythroid phenotype resulting from ENT1 deficiency in humans and mice.

Genetic depletion of Ent1 in mice hampers erythroid lineage commitment in the BM. (A) Increased size of RBCs in Ent1−/− mice compared with WT mice. EDTA-anticoagulated mouse blood was used for Wright-Giemsa staining and representative blood smears are shown. (B) Schematic of MEP, CMP, and GMP progenitors as well as the differentiation to mature red cells and granulocytes. The flow cytometry-based analytic strategy to identify the different populations is presented. (C) Representative FACS analysis of hematopoietic progenitor cells of BM of 8- to 12-week-old Ent1−/− and WT mice. The number of Lin−cKit+, CMP, MEP, and GMP cells per 106 BM cells (excluding RBCs) are presented in WT and Ent1−/− mice (n = 9, *P < .05). (D) Erythroid and myeloid cells were evaluated as a function of Ter119 and Gr-1 staining, respectively, and representative dot plots are shown (left). Quantification of the percentages of Ter119+ cells vs Gr-1+ cells in BM of Ent1−/− and WT mice are presented (right) as means ± standard error of the mean (SEM) with each point corresponding to data from 1 mouse (*P < .05). (E) Quantification of spleen body weight ratio in Ent1−/− and WT mice (*P < .05). (F) Representative FACS analyses of differentiated erythroblasts by CD71 and Ter119 staining in spleens of Ent1−/− and WT mice (left). The developmental stage of erythroblasts was indicated by populations I, II, III, and IV. The quantification of these populations is displayed on the right (*P < .05). (G) Representative FACS plots are shown for splenic Ter119+ cells vs Gr-1+ cells in Ent1−/− and WT mice (left) and quantification of data in individual mice are presented as means ± SEM (right; *P < .05). (H) Biotin-labeled RBCs in WT (black circles) and Ent1−/− (red squares) are shown as a function of time after biotin labeling. Means ± SEM of 5 mice in each group are shown.
Genetic depletion of Ent1 in mice hampers erythroid lineage commitment in the BM. (A) Increased size of RBCs in Ent1−/− mice compared with WT mice. EDTA-anticoagulated mouse blood was used for Wright-Giemsa staining and representative blood smears are shown. (B) Schematic of MEP, CMP, and GMP progenitors as well as the differentiation to mature red cells and granulocytes. The flow cytometry-based analytic strategy to identify the different populations is presented. (C) Representative FACS analysis of hematopoietic progenitor cells of BM of 8- to 12-week-old Ent1−/− and WT mice. The number of Lin−cKit+, CMP, MEP, and GMP cells per 106 BM cells (excluding RBCs) are presented in WT and Ent1−/− mice (n = 9, *P < .05). (D) Erythroid and myeloid cells were evaluated as a function of Ter119 and Gr-1 staining, respectively, and representative dot plots are shown (left). Quantification of the percentages of Ter119+ cells vs Gr-1+ cells in BM of Ent1−/− and WT mice are presented (right) as means ± standard error of the mean (SEM) with each point corresponding to data from 1 mouse (*P < .05). (E) Quantification of spleen body weight ratio in Ent1−/− and WT mice (*P < .05). (F) Representative FACS analyses of differentiated erythroblasts by CD71 and Ter119 staining in spleens of Ent1−/− and WT mice (left). The developmental stage of erythroblasts was indicated by populations I, II, III, and IV. The quantification of these populations is displayed on the right (*P < .05). (G) Representative FACS plots are shown for splenic Ter119+ cells vs Gr-1+ cells in Ent1−/− and WT mice (left) and quantification of data in individual mice are presented as means ± SEM (right; *P < .05). (H) Biotin-labeled RBCs in WT (black circles) and Ent1−/− (red squares) are shown as a function of time after biotin labeling. Means ± SEM of 5 mice in each group are shown.
Erythropoiesis is initiated from blood marrow (BM)-derived HSCs that differentiate to common myeloid progenitors (CMPs), followed by commitment to megakaryocyte erythroid progenitors (MEPs) vs granulocyte myeloid progenitors (GMPs). MEPs generate erythroid progenitors that undergo terminal differentiation to generate mature RBCs51,52 (Figure 4B). Given that Ent1−/− mice displayed mild anemia, we evaluated the phenotype of hematopoietic progenitors in their BM compared with WT mice. There were no differences in the number of Lin−cKit+ cells between both mice groups (Figure 4C). However, Ent1−/− mice displayed a significant decrease in CMP (CD34+CD16/32−) and MEP (CD34−CD16/32−) cells but an increased GMP (CD34+CD16/32−) cells compared with WT mice (P < .05; Figure 4C). These data point to decreased erythroid differentiation and indeed, the percentage of Ter119+ erythroid cells in the BM of Ent1−/− mice was lower than WT mice, whereas the level of Gr-1+ granulocytes was increased (P < .05, Figure 4D).
In mice, the spleen is the major site for stress erythropoiesis.53 Surprisingly, we found that Ent1−/− mice displayed splenomegaly (P < .05; Figure 4E) compared with their WT counterparts at 8 to 12 weeks of age, raising an intriguing possibility of an increased erythropoiesis to counteract the anemic state of these mice. Interestingly, flow cytometry analysis of erythroid precursors in the spleen showed an increase in early progenitors (populations I and II) with equivalent levels of later progenitors (Figure 4F). Thus, there is an increase in the total splenic Ter119+ population in Ent1−/− mice (Figure 4G). To rule out the possibility that the splenomegaly in Ent1−/− mice is due to increased clearance of RBCs by the spleen, we measured red cell life span by labeling all circulating erythrocytes in vivo by injection of N-succinimidyl-6-[biotinamido] hexanoate. The percentage of biotinylated erythrocytes in the circulation in Ent1−/− mice was not decreased compared with WT mice (Figure 4H), strongly suggesting that increased RBC destruction was not responsible for the splenomegaly detected in Ent1−/− mice.
ENT1-mediated adenosine uptake induces cyclic nucleotide accumulation and enhanced in vitro erythropoiesis
The abnormal protein phosphorylation and nucleotide metabolome in human mature ENT1null RBCs, in conjunction with the increased adenosine plasma levels in ENT1null probands (P < .0001; supplemental Figure 9), as previously reported for Ent1−/− mice,54 confirm the importance of adenosine as a substrate of ENT1. To address the question of whether ENT1 regulates erythropoiesis via its capacity to transport adenosine, we performed ex vivo differentiation of CD34+ progenitors from healthy donors following addition of adenosine. Enhanced terminal erythroid differentiation was noted in the presence of adenosine (15 µM), a concentration that did not alter proliferation or survival (not shown). Differentiation was monitored as a function of α4-integrin/Band3 staining on GPA+ cells, with an α4-integrinlow/Band3low phenotype representing the most differentiated erythroblasts. Notably, adenosine significantly accelerated erythroid differentiation in control progenitors (Figures 5A-B); this finding was also confirmed by MGG staining (Figure 5C). However, adenosine did not enhance erythroid differentiation following shRNA-mediated knockdown of ENT1, as monitored by GPA and Band3 expression (Figures 5D-E), and did not rescue shENT1-transduced progenitors from being negatively selected (supplemental Figure 10). These data are in accord with ENT1’s role as a major adenosine transporter expressed in erythroid precursors.34,35 Furthermore, shENT1-transduced progenitors upregulated myeloid lineage markers despite the presence of rEPO and adenosine (Figure 5D). These findings demonstrate the inability of adenosine to enhance erythroid differentiation in the absence of ENT1, strongly suggesting that ENT1 regulates erythroid differentiation via its role as adenosine transporter.
![ENT1-mediated adenosine uptake induced cyclic nucleotide accumulation and enhanced in vitro erythropoiesis. (A) CD34+ progenitors from peripheral blood of healthy donors were stimulated with rEPO in the absence or presence of adenosine (15 µM) at day 0 of the differentiation phase. Terminal differentiation was monitored as a function of the α4-integrin/Band3 profiles of GPApos cells. Differentiation steps can be followed as α4-integrinhigh/Band3low (quadrant 1 [Q1]), α4-integrinmed/Band3med (Q2), and α4-integrinlow/Band3high (Q3). Expression levels of α4-integrin and Band3 levels inside GPA+ cells are shown at days 5, 9, and 12 for control and adenosine-treated cells. (B) The percentages of α4-integrinhigh/Band3low, α4-integrinmed/Band3med, and α4-integrinlow/Band3high in control (black circles) and adenosine-treated (red triangles) cells are plotted in histograms. Results are expressed as the mean cell % ± standard error of the mean (SEM). Multiple comparisons of 2-way analysis of variance statistical test were performed and corresponding significant differences are shown. *P < .05; **P < .005; ***P < .001. (C) Representative images of MGG-stained Cytospins of control and adenosine-treated cells (+ADO) at day 7 of differentiation. Scale bars, 10 µm. (D) Surface expression levels of GPA and Band3 erythroid markers and CD11a and CD33 myeloid markers were evaluated by flow cytometry at day 7 of rEPO-induced erythroid differentiation. Representative histograms showing GFPpos gated cells for shControl (filled black histograms), shENT1 (empty black histograms), and shENT1 treated with adenosine (empty red histograms) transduced cells are shown (left); gray shaded histograms correspond to nonspecific IgG staining and were used to evaluate positive staining. Quantification of 3 independent experiments is presented for each marker (right). ns, nonsignificant, *P < .05, **P < .01, ***P < .001, ****P < .0001. (E) shENT1-and shControl transduced CD34+ cells were stimulated with EPO and cultured in absence or presence of adenosine (15 µM). Surface expression levels of GPA were monitored at indicated days and plotted in scatter dot plot histograms as mean cell % ± SEM. Two-way analysis of variance statistical test was performed and statistical significance is indicated (n = 3 independent experiments). **P < .01; ***P < .001; ****P < .0001. (F) Intracellular concentrations of cAMP, cGMP, and adenine nucleotides inside erythroid precursors at day 3 of erythroid differentiation were measured by a liquid chromatography–mass spectrometry approach, and representative bar histograms are shown for control (black) and adenosine-treated cells (red). Results are expressed as mean ± SEM, n = 3. *P < .05; **P < .01; ***P < .001 (paired t test). (G) The phosphorylation state of CREB (Ser133) was evaluated by intracellular staining using an antiphosphoCREB antibody and analyzed by flow cytometry throughout erythroid terminal differentiation. GMFI (left) and percentages of P-CREB+ cells (right) are presented at the indicated days as means ± SEM of 4 independent experiments. **P < .01, ***P < .001. (H) Phosphorylation of PKA RIIβ (Ser114) was monitored at the indicated time points. GMFI (left) and the percentages of P-PKA+ cells (right) are shown as means ± SEM of 4 independent experiments. *P < .05, **P < .01.](https://ash.silverchair-cdn.com/ash/content_public/journal/blood/137/25/10.1182_blood.2020007281/2/m_bloodbld2020007281f5-1.png?Expires=1763472751&Signature=b50C2DkVYpW8f6-oEPXcmXgwQRLj4Aj0wQSYVhlXBsqG4-mF-3kG5CYu6XLoJSSV43AvgHNdCQZzr8M4i26puoYN869xhrJyG~mD5on37F0PHjPPdgQg0skHPeafGuhynr7JSYCKc~KVemwL3IxFk1fqBxmCv1k630mO3ZTfZCj77RoSmcXw9Nm9luLfdRZZ-PkAmkSNbp5vLcfdl3Smhx2te28J350pMv71at8QxAmNwazXURqIWwNfkSo5fvLtEB~k36A-uIQHqtqAqEBjUV8LDWiwPFnqM4X6GVnNIafbzs-xKqLOfd6a5TCNIhwyfrrCcHCwxlUCnFueJDK46Q__&Key-Pair-Id=APKAIE5G5CRDK6RD3PGA)
![ENT1-mediated adenosine uptake induced cyclic nucleotide accumulation and enhanced in vitro erythropoiesis. (A) CD34+ progenitors from peripheral blood of healthy donors were stimulated with rEPO in the absence or presence of adenosine (15 µM) at day 0 of the differentiation phase. Terminal differentiation was monitored as a function of the α4-integrin/Band3 profiles of GPApos cells. Differentiation steps can be followed as α4-integrinhigh/Band3low (quadrant 1 [Q1]), α4-integrinmed/Band3med (Q2), and α4-integrinlow/Band3high (Q3). Expression levels of α4-integrin and Band3 levels inside GPA+ cells are shown at days 5, 9, and 12 for control and adenosine-treated cells. (B) The percentages of α4-integrinhigh/Band3low, α4-integrinmed/Band3med, and α4-integrinlow/Band3high in control (black circles) and adenosine-treated (red triangles) cells are plotted in histograms. Results are expressed as the mean cell % ± standard error of the mean (SEM). Multiple comparisons of 2-way analysis of variance statistical test were performed and corresponding significant differences are shown. *P < .05; **P < .005; ***P < .001. (C) Representative images of MGG-stained Cytospins of control and adenosine-treated cells (+ADO) at day 7 of differentiation. Scale bars, 10 µm. (D) Surface expression levels of GPA and Band3 erythroid markers and CD11a and CD33 myeloid markers were evaluated by flow cytometry at day 7 of rEPO-induced erythroid differentiation. Representative histograms showing GFPpos gated cells for shControl (filled black histograms), shENT1 (empty black histograms), and shENT1 treated with adenosine (empty red histograms) transduced cells are shown (left); gray shaded histograms correspond to nonspecific IgG staining and were used to evaluate positive staining. Quantification of 3 independent experiments is presented for each marker (right). ns, nonsignificant, *P < .05, **P < .01, ***P < .001, ****P < .0001. (E) shENT1-and shControl transduced CD34+ cells were stimulated with EPO and cultured in absence or presence of adenosine (15 µM). Surface expression levels of GPA were monitored at indicated days and plotted in scatter dot plot histograms as mean cell % ± SEM. Two-way analysis of variance statistical test was performed and statistical significance is indicated (n = 3 independent experiments). **P < .01; ***P < .001; ****P < .0001. (F) Intracellular concentrations of cAMP, cGMP, and adenine nucleotides inside erythroid precursors at day 3 of erythroid differentiation were measured by a liquid chromatography–mass spectrometry approach, and representative bar histograms are shown for control (black) and adenosine-treated cells (red). Results are expressed as mean ± SEM, n = 3. *P < .05; **P < .01; ***P < .001 (paired t test). (G) The phosphorylation state of CREB (Ser133) was evaluated by intracellular staining using an antiphosphoCREB antibody and analyzed by flow cytometry throughout erythroid terminal differentiation. GMFI (left) and percentages of P-CREB+ cells (right) are presented at the indicated days as means ± SEM of 4 independent experiments. **P < .01, ***P < .001. (H) Phosphorylation of PKA RIIβ (Ser114) was monitored at the indicated time points. GMFI (left) and the percentages of P-PKA+ cells (right) are shown as means ± SEM of 4 independent experiments. *P < .05, **P < .01.](https://ash.silverchair-cdn.com/ash/content_public/journal/blood/137/25/10.1182_blood.2020007281/2/m_bloodbld2020007281f5-2.png?Expires=1763472751&Signature=reKxlh5Z4IOFMiLMXdIpY-hBOXc-VjwNZIlDYil3Xw2Zvpxyq9NltqBud7jeGJr96l0c2yOn5-0hHkX0p5ErJDJrIlWB4YqD3AerfbJD37TyiaROffZUZdQ8vQ1JDyESNJZykYaLbSp1kdnvqKn9InzNe8A9j0hSuqizMiL5WQTmzxMpOUhcqgOsWgdHcXVGPXWhWbTwKCJnYC2FC6MpWGUjA4pzFOMUexACS0SBe9dWftPmIGErnhQfpEZWR3edEgQ-v7wJvLcpgUjU0qEApmqSd4hB8jWIRAKXy~SHRG1AuJ3e3BBQn4VPxD6qBnYjmNPAegHSHkzCZgbllwWncA__&Key-Pair-Id=APKAIE5G5CRDK6RD3PGA)
ENT1-mediated adenosine uptake induced cyclic nucleotide accumulation and enhanced in vitro erythropoiesis. (A) CD34+ progenitors from peripheral blood of healthy donors were stimulated with rEPO in the absence or presence of adenosine (15 µM) at day 0 of the differentiation phase. Terminal differentiation was monitored as a function of the α4-integrin/Band3 profiles of GPApos cells. Differentiation steps can be followed as α4-integrinhigh/Band3low (quadrant 1 [Q1]), α4-integrinmed/Band3med (Q2), and α4-integrinlow/Band3high (Q3). Expression levels of α4-integrin and Band3 levels inside GPA+ cells are shown at days 5, 9, and 12 for control and adenosine-treated cells. (B) The percentages of α4-integrinhigh/Band3low, α4-integrinmed/Band3med, and α4-integrinlow/Band3high in control (black circles) and adenosine-treated (red triangles) cells are plotted in histograms. Results are expressed as the mean cell % ± standard error of the mean (SEM). Multiple comparisons of 2-way analysis of variance statistical test were performed and corresponding significant differences are shown. *P < .05; **P < .005; ***P < .001. (C) Representative images of MGG-stained Cytospins of control and adenosine-treated cells (+ADO) at day 7 of differentiation. Scale bars, 10 µm. (D) Surface expression levels of GPA and Band3 erythroid markers and CD11a and CD33 myeloid markers were evaluated by flow cytometry at day 7 of rEPO-induced erythroid differentiation. Representative histograms showing GFPpos gated cells for shControl (filled black histograms), shENT1 (empty black histograms), and shENT1 treated with adenosine (empty red histograms) transduced cells are shown (left); gray shaded histograms correspond to nonspecific IgG staining and were used to evaluate positive staining. Quantification of 3 independent experiments is presented for each marker (right). ns, nonsignificant, *P < .05, **P < .01, ***P < .001, ****P < .0001. (E) shENT1-and shControl transduced CD34+ cells were stimulated with EPO and cultured in absence or presence of adenosine (15 µM). Surface expression levels of GPA were monitored at indicated days and plotted in scatter dot plot histograms as mean cell % ± SEM. Two-way analysis of variance statistical test was performed and statistical significance is indicated (n = 3 independent experiments). **P < .01; ***P < .001; ****P < .0001. (F) Intracellular concentrations of cAMP, cGMP, and adenine nucleotides inside erythroid precursors at day 3 of erythroid differentiation were measured by a liquid chromatography–mass spectrometry approach, and representative bar histograms are shown for control (black) and adenosine-treated cells (red). Results are expressed as mean ± SEM, n = 3. *P < .05; **P < .01; ***P < .001 (paired t test). (G) The phosphorylation state of CREB (Ser133) was evaluated by intracellular staining using an antiphosphoCREB antibody and analyzed by flow cytometry throughout erythroid terminal differentiation. GMFI (left) and percentages of P-CREB+ cells (right) are presented at the indicated days as means ± SEM of 4 independent experiments. **P < .01, ***P < .001. (H) Phosphorylation of PKA RIIβ (Ser114) was monitored at the indicated time points. GMFI (left) and the percentages of P-PKA+ cells (right) are shown as means ± SEM of 4 independent experiments. *P < .05, **P < .01.
ENT1-mediated adenosine uptake induced cyclic nucleotide accumulation and enhanced in vitro erythropoiesis. (A) CD34+ progenitors from peripheral blood of healthy donors were stimulated with rEPO in the absence or presence of adenosine (15 µM) at day 0 of the differentiation phase. Terminal differentiation was monitored as a function of the α4-integrin/Band3 profiles of GPApos cells. Differentiation steps can be followed as α4-integrinhigh/Band3low (quadrant 1 [Q1]), α4-integrinmed/Band3med (Q2), and α4-integrinlow/Band3high (Q3). Expression levels of α4-integrin and Band3 levels inside GPA+ cells are shown at days 5, 9, and 12 for control and adenosine-treated cells. (B) The percentages of α4-integrinhigh/Band3low, α4-integrinmed/Band3med, and α4-integrinlow/Band3high in control (black circles) and adenosine-treated (red triangles) cells are plotted in histograms. Results are expressed as the mean cell % ± standard error of the mean (SEM). Multiple comparisons of 2-way analysis of variance statistical test were performed and corresponding significant differences are shown. *P < .05; **P < .005; ***P < .001. (C) Representative images of MGG-stained Cytospins of control and adenosine-treated cells (+ADO) at day 7 of differentiation. Scale bars, 10 µm. (D) Surface expression levels of GPA and Band3 erythroid markers and CD11a and CD33 myeloid markers were evaluated by flow cytometry at day 7 of rEPO-induced erythroid differentiation. Representative histograms showing GFPpos gated cells for shControl (filled black histograms), shENT1 (empty black histograms), and shENT1 treated with adenosine (empty red histograms) transduced cells are shown (left); gray shaded histograms correspond to nonspecific IgG staining and were used to evaluate positive staining. Quantification of 3 independent experiments is presented for each marker (right). ns, nonsignificant, *P < .05, **P < .01, ***P < .001, ****P < .0001. (E) shENT1-and shControl transduced CD34+ cells were stimulated with EPO and cultured in absence or presence of adenosine (15 µM). Surface expression levels of GPA were monitored at indicated days and plotted in scatter dot plot histograms as mean cell % ± SEM. Two-way analysis of variance statistical test was performed and statistical significance is indicated (n = 3 independent experiments). **P < .01; ***P < .001; ****P < .0001. (F) Intracellular concentrations of cAMP, cGMP, and adenine nucleotides inside erythroid precursors at day 3 of erythroid differentiation were measured by a liquid chromatography–mass spectrometry approach, and representative bar histograms are shown for control (black) and adenosine-treated cells (red). Results are expressed as mean ± SEM, n = 3. *P < .05; **P < .01; ***P < .001 (paired t test). (G) The phosphorylation state of CREB (Ser133) was evaluated by intracellular staining using an antiphosphoCREB antibody and analyzed by flow cytometry throughout erythroid terminal differentiation. GMFI (left) and percentages of P-CREB+ cells (right) are presented at the indicated days as means ± SEM of 4 independent experiments. **P < .01, ***P < .001. (H) Phosphorylation of PKA RIIβ (Ser114) was monitored at the indicated time points. GMFI (left) and the percentages of P-PKA+ cells (right) are shown as means ± SEM of 4 independent experiments. *P < .05, **P < .01.
Because adenosine is an important precursor in the synthesis of other adenine nucleotides, we analyzed the nucleotide metabolome of control erythroblasts cultured in the presence of adenosine. Interestingly, the cyclic nucleotides cAMP and cGMP were significantly increased in erythroblasts treated with adenosine (Figure 5F). Phosphorylation of the cAMP-response element-binding (CREB) protein, a transcription factor activated by cyclic nucleotides, decreased as a function of erythroid differentiation (supplemental Figure 11). However, under conditions where extracellular adenosine was increased, CREB phosphorylation was increased (Figure 5G; supplemental Figure 12). Accordingly, protein kinase A (PKA) phosphorylation was also significantly increased in the presence of adenosine, confirming an adenosine-stimulated cyclic nucleotide biosynthesis (Figure 5H). Together, these data reveal the importance of ENT1 in mediating adenosine uptake to regulate cyclic nucleotide biosynthesis and erythropoiesis.
Role of ABCC4 in cyclic nucleotide homeostasis in ENT1null cells
Although all ENT1null patients exhibited macrocytosis, the impact of ENT1 on RBC deformability was more pronounced in P3 compared with P1/P2. Furthermore, in vitro erythroid differentiation was altered in P3 progenitors but was not significantly attenuated in P1 and P2 progenitors. The attenuated erythroid phenotype of P1 and P2 compared with P3 was associated with increased RBC cyclic nucleotide levels (Figure 1G). In addition, P2 erythroblasts exhibited an increased accumulation of cAMP and cGMP compared with control erythroblasts, whereas shENT1-transduced erythroblasts exhibited a reduced level of cAMP (supplemental Figures 13 and 14). Thus, ENT1 may regulate erythropoiesis via cyclic nucleotide metabolism, and our data further suggest that a mutation in ABCC4 compensates for the absence of ENT1, attenuating the erythroid phenotype in patients P1 and P2.
To test this hypothesis, we evaluated the effect of an ABCC4 inhibitor (MK-571) on ex vivo erythropoiesis of healthy donors (supplemental Figure 15). As shown in Figure 6, MK-571 significantly enhanced erythropoiesis as indicated by the increased GPA expression (Figure 6A). Moreover, MK-571 increased terminal erythroblast maturation and dramatically increased enucleation by approximately twofold (P < .05; Figure 6B-C). MK-571 also enlarged the pool of erythroid cells as shown by a significant increase in expansion without changes in apoptosis or cell death (supplemental Figures 115B-C).
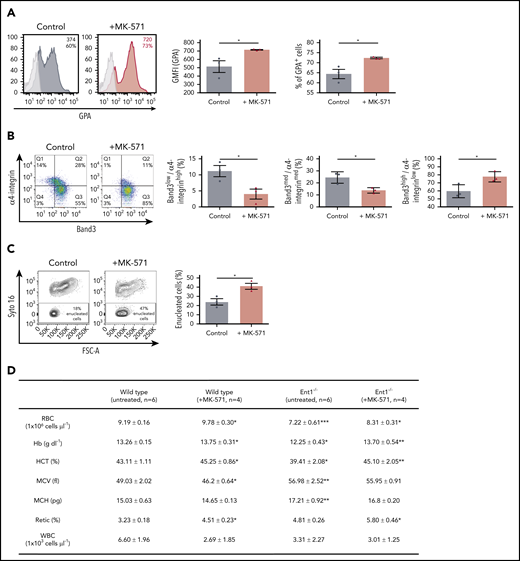

Reduced ABCC4 activity enhances in vitro erythropoiesis of human CD34+ cells as well as erythropoiesis in WT and Ent1−/− mice and enhances. (A) CD34+ cells from healthy donors were cultured in the presence or absence of MK-571 (100 μM), initiated 24 hours after CD34+ selection. GPA expression was monitored at day 3 of rEPO-induced erythroid differentiation and representative FACS histograms of control (black histogram) and MK571-treated progenitors (orange histogram) are presented, including percentages of GPA+ cells and GFMI (left). Shaded gray histograms correspond to unstained negative controls specifying negative gating. GMFI (middle) and the percentages of GPA+ cells (right) were quantified and means ± standard error of the mean (SEM) of 3 independent experiments are shown. *P < .05. (B) Erythroblast maturation was monitored at day 12 of differentiation in the presence or absence of MK-571 by α4-integrin/Band3 profiles of GPApos cells. Representative dot plots are shown (left), and the percentages of cells in each quadrant are indicated. Quantification of cells in the more immature α4-integrinhigh/Band3low and α4-integrinmed/Band3med subsets as compared with the more mature α4-integrinlow/Band3high subset is presented for 3 independent experiments (right). *P < .05. (C) Erythroblast enucleation was evaluated as a function of Syto16 nucleic acid staining and representative dot plots indicating the percentages of Syto16-enucleated cells (left) and quantification of enucleated cells in 3 independent experiments are presented (right). *P < .05. (D) Hematological parameters of WT and Ent1−/− mice under control conditions or following a 6-day treatment with MK-571. *P < .05, **P < .01, ***P < .001, WT treated vs WT, Ent1−/− treated vs Ent1−/− untreated. (E) Quantification of CMP, MEP, and GMP in BM of WT and Ent1−/− mice in the absence or presence of MK-571 treatment (10 mg/kg every other day for 1 week, n = 4-6). (F) Frequency of Lin−c-kit+ cells in BM and spleen of WT and Ent1−/− mice treated or not with MK-571. (G) Quantification of the frequencies of Ter119+ and Gr-1+ cells in BM of untreated and MK-571-treated WT and Ent1−/− mice are presented (n = 4-6). *P < .05, **P < .01.
Reduced ABCC4 activity enhances in vitro erythropoiesis of human CD34+ cells as well as erythropoiesis in WT and Ent1−/− mice and enhances. (A) CD34+ cells from healthy donors were cultured in the presence or absence of MK-571 (100 μM), initiated 24 hours after CD34+ selection. GPA expression was monitored at day 3 of rEPO-induced erythroid differentiation and representative FACS histograms of control (black histogram) and MK571-treated progenitors (orange histogram) are presented, including percentages of GPA+ cells and GFMI (left). Shaded gray histograms correspond to unstained negative controls specifying negative gating. GMFI (middle) and the percentages of GPA+ cells (right) were quantified and means ± standard error of the mean (SEM) of 3 independent experiments are shown. *P < .05. (B) Erythroblast maturation was monitored at day 12 of differentiation in the presence or absence of MK-571 by α4-integrin/Band3 profiles of GPApos cells. Representative dot plots are shown (left), and the percentages of cells in each quadrant are indicated. Quantification of cells in the more immature α4-integrinhigh/Band3low and α4-integrinmed/Band3med subsets as compared with the more mature α4-integrinlow/Band3high subset is presented for 3 independent experiments (right). *P < .05. (C) Erythroblast enucleation was evaluated as a function of Syto16 nucleic acid staining and representative dot plots indicating the percentages of Syto16-enucleated cells (left) and quantification of enucleated cells in 3 independent experiments are presented (right). *P < .05. (D) Hematological parameters of WT and Ent1−/− mice under control conditions or following a 6-day treatment with MK-571. *P < .05, **P < .01, ***P < .001, WT treated vs WT, Ent1−/− treated vs Ent1−/− untreated. (E) Quantification of CMP, MEP, and GMP in BM of WT and Ent1−/− mice in the absence or presence of MK-571 treatment (10 mg/kg every other day for 1 week, n = 4-6). (F) Frequency of Lin−c-kit+ cells in BM and spleen of WT and Ent1−/− mice treated or not with MK-571. (G) Quantification of the frequencies of Ter119+ and Gr-1+ cells in BM of untreated and MK-571-treated WT and Ent1−/− mice are presented (n = 4-6). *P < .05, **P < .01.
To specifically evaluate the impact of ABCC4 function on erythroid differentiation in the murine system, we inhibited ABCC4 function in Ent1−/− mice with MK-571.55 Retro-orbital administration of MK-571 (10 mg/kg for 6 days) increased total RBCs, Hb, and hematocrit in Ent1−/− mice to levels similar to those detected in WT mice (Figure 6D). Interestingly though, MK-571 treatment did not alter red cell macrocytosis in Ent1−/− mice, strongly suggesting that erythropoiesis, but not macrocytosis, is regulated by ABCC4 in the absence of ENT1. Moreover, our data suggest that ABCC4 negatively regulates erythroid differentiation even in the presence of ENT1. MK-571 treatment significantly increased total RBCs, Hb production, and hematocrit in WT mice. MK-571 treatment increased the percentage of circulating reticulocytes in both Ent1−/− and WT mice (Figure 6D), supporting this newly described association between ABCC4 and ENT1 in erythropoiesis. We then evaluated the potential impact of this drug on early stages of erythroid commitment. MK-571 treatment led to an increased percentage of BM MEPs in both WT and Ent1−/− mice (P < .05 and P < .001, respectively; Figure 6E; supplemental Figure 16), but did not alter the percentage of Lin−/cKit+ progenitors in either group (Figure 6F). This increase was associated with a significantly decreased percentage of BM GMPs in WT mice as well as BM CMPs in Ent1−/− mice (P < .05; Figure 6E). This MEP/CMP shift was coupled to a significant increase in BM Ter119+ erythroid cells in both WT and Ent1−/− mice and a decreased percentage of Gr-1+ cells in BM of WT mice (Figure 6G). These experiments, performed on patient cells and following pharmacological manipulation of both human and murine ENT1−/− progenitors, highlight a novel crosstalk between ABCC4 and ENT1 in regulating erythroid differentiation.
Discussion
Here, we show that ENT1null RBCs exhibit a defective phosphorylation of membrane proteins that is associated with distinct misshaped cells, confirming the crucial role of ENT1-mediated nucleoside transport in the regulation of metabolic pathways and kinase activities. Although the finely tuned regulation of membrane protein phosphorylation has previously been shown to be critical in the control of cell volume and membrane organization via ion channel activities and protein–protein interactions, respectively,42,56-59 our finding of dNTPs accumulation in ENT1null RBCs, reveals an important role of ENT1 in deoxynucleotide recycling and nucleotide homeostasis during erythroid diffrentiation.48 Balanced nucleotide pools, controlling replication stress, DNA damage, protein kinases, as well as transcription factors,19,23,60-62 have been shown to regulate hematopoietic lineage fate.13,14 Indeed, we provide unequivocal demonstration that ENT1-mediated adenosine transport regulates the intracellular level of cyclic nucleotides in hematopoietic progenitors, altering erythroid differentiation under conditions where the phosphoproteome of ENT1null RBCs is abnormal. Finally, our data show that knockdown of ENT1 in human CD34+ progenitors impede in vitro erythropoiesis while increasing ENT1-mediated adenosine transport enhances erythroid differentiation.
The absence of anemia in ENT1null patients is particularly intriguing considering the numerous erythroid alterations, including macrocytosis, anisopoikilocytosis, and abnormal deformability. These data are even more surprising given that Ent1−/− mice exhibit a reduced RBC count, Hb, and hematocrit. Interestingly though, red cells in Ent1−/− mice are not destroyed and ENT1null patients exhibit normal hemolysis markers. These data suggest that the lifespan of murine and human ENT1null RBCs is not shortened (supplemental Table 1). In this regard, it is notable that neither S-adenosyl-methionine nor nucleotides are significantly altered in mature murine Ent1−/− red cells.63 An attractive hypothesis to explain differences in the role of Ent1 in murine vs human red cell differentiation may be related to the hypoxia-mediated up regulation of key metabolites, including nucleotides, within the low-oxygen BM microenvironment.54,64-66
The hypoxic microenvironment of the BM niche influences the metabolic pathways used by HSCs and consequently their erythroid differentiation. In line with these findings, we have recently shown that ENT1 and adenosine signaling are involved in the adaptation to high-altitude hypoxia.45 Thus, molecules and signaling networks that are yet to be identified may complement ENT1 function in the murine spleen where Ter119+ cells were increased as compared with bone marrow where erythroid differentiation was negatively affected. Furthermore, although the specific ablation of Ent1 in erythroblasts, using an EpoR-Cre, also resulted in macrocytosis,67 RBC numbers as well as other RBC parameters were less affected than those reported here using a complete Ent1 knockout. These data therefore raise the important possibility that ENT1 plays a role in erythroid differentiation at a progenitor stage upstream of EpoR+ erythroblasts.
Our findings reveal a critical role of ABCC4 in regulating erythroid differentiation in the absence of ENT1; moreover, we find that inhibition of ABCC4 enhances human and murine erythroid differentiation under physiological conditions. Notably, we identified ABCC4 as a crucial factor by documenting its role in explaining the differences in the ex vivo erythroid differentiation potential of P1 and P2 progenitors compared with P3 progenitors. Mechanistically, we found that P1/P2 RBCs exhibited high levels of intracellular cyclic nucleotides, whereas P3 RBCs are characterized by low cyclic nucleotide levels. This significant difference was associated with a heterozygous loss-of-function variant in the ABCC4 cyclic nucleotide exporter in P1/P2, but not in P3. The finding that ABCC4 inhibitor significantly rescued the anemic phenotype and increased erythroid differentiation in Ent1−/− mice strongly suggests a crosstalk between ABCC4 and ENT1 in regulating erythropoiesis. Notably, though, ABCC4 inhibition did not correct the macrocytic phenotype of these Ent1−/− mice, indicating that in our murine model, the macrocytic red cell phenotype is ABCC4-independent. Collectively, these data indicate that the intracellular level of cyclic nucleotides is crucial for in vivo erythropoiesis and highlight the interdependence of the ABCC4 and ENT1 transporters in erythropoiesis.
In summary, we show that ENT1 plays a key role in nucleotide homeostasis and optimal erythropoiesis and provide both genetic and pharmacological evidence that ABCC4 is a key negative regulator of erythropoiesis in the absence of ENT1, exacerbating a perturbation in cyclic nucleotide homeostasis and downstream erythroid defects. Moreover, we find that inhibition of ABCC4 by MK-571 results in a rescue of the anemic phenotype in Ent1−/− mice, and an enhanced RBC production in WT mice without a significant reduction in circulating white blood cells. Notably, MK-571 has been tested in clinical trials as a therapeutic molecule to treat asthma,68-70 pulmonary arterial hypertension,71 and platelet aggregation55,72,73 via increasing the intracellular levels of cAMP and cGMP. The impact of MK-571 in pulmonary arterial hypertension was specific to its effects on ABCC4 because deletion of this gene resulted in a notable reduction in hypoxia-induced inflammatory response.71 MK-571 could therefore represent a novel drug for the therapeutic treatment of anemia.
For original data, please e-mail the corresponding authors.
The online version of this article contains a data supplement.
The publication costs of this article were defrayed in part by page charge payment. Therefore, and solely to indicate this fact, this article is hereby marked “advertisement” in accordance with 18 USC section 1734.
Acknowledgments
The authors are indebted to Bérengère Koehl for helpful comments and for reading the manuscript, and to Cédric Vrignaud and Romain Duval for their assistance at CNRGS in this research project. The authors thank Sara El Hoss, Sandrine Laurence, and Niloofar Reihani for their help with methylcellulose cultures, and Martina Moras and Marie Daumur for their assistance.
This work was supported by INSERM, the Institut National de la Transfusion Sanguine, and the Laboratory of Excellence GR-Ex (reference ANR-11-LABX-0051). The Labex GR-Ex is funded by the IdEx program “Investissements d’Avenir” of the French National Research Agency (reference ANR-18-IDEX-0001). This work is also supported by grants from the Fondation Recherche Médicale (N.T.), National Institutes of Health (NIH) National Institute of Diabetes and Digestive and Kidney Diseases (PO1 DK032094) (M.N., S.K., and N.T.), NIH National Heart, Lung, and Blood Institute (HL137990 and HL136969) (Y.X.), and the McGovern Fund at the University of Texas Health Science Center-McGovern Medical School (Y.X.). M.M. was funded by the Ministère de l’Enseignement Supérieur et de la Recherche (Ecole Doctorale BioSPC) and the Institut National de la Transfusion Sanguine. P.G.-M. was funded by the CLARIN-COFUND program from the Principado de Asturias and the European Union.
Authorship
Contribution: C.L.V.K., Y.C., O.H., M. Sitbon, N.T., T.P., and S.A. conceived the project and obtained funding; M.M., S.K., N.T., and S.A. designed the research study; Y.X. oversaw the design of the in vivo mouse studies; T.P. collected human samples and clinical data of ENT1null patients; M.M., P.G.-M., and S.K. performed most of the experiments; X.C. conducted the in vivo mouse studies; A.-C.B. and S.S. realized the metabolomic analyses; C.C. and I.C.G. performed the phosphoproteomic studies; Y.Z. performed mouse blood smear experiments; M.M., P.G.-M., X.C., M. Serra, A.K.D., S.K., N.M., T.P., Y.X., N.T., and S.A. analyzed the data; and M.M., N.M., N.T., and S.A. wrote the manuscript with editing from P.G.-M., S.K., M. Sitbon, X.C., C.L.V.K., T.P., and Y.X.
Conflict-of-interest disclosure: The authors declare no competing financial interests.
Correspondence: Slim Azouzi, INSERM, UMR S1134, INTS, 6 Rue Alexandre Cabanel, 75015 Paris, France; e-mail: slim.azouzi@inserm.fr; Naomi Taylor, Pediatric Oncology Branch, NCI, CCR, NIH, Bethesda, MD 20814; e-mail: taylorn4@mail.nih.gov; Thierry Peyrard, INSERM, UMR S1134, INTS, 6 Rue Alexandre Cabanel, 75015 Paris, France; e-mail: tpeyrard@ints.fr; and Yang Xia, Department of Biochemistry and Molecular Biology, University of Texas McGovern Medical School at Houston, Houston, TX 77030; e-mail: yang.xia@uth.tmc.edu.

This feature is available to Subscribers Only
Sign In or Create an Account Close Modal