

Key Points
The combination of Cy conditioning and IL-2 allows suppressive T cells to rescue scurfy mice after disease onset.
Transcriptomic analysis reveals a lasting restoration of Treg identity in FOXP3-transduced scurfy cells, even in an inflammatory environment.

Abstract
Immunodysregulation, polyendocrinopathy, enteropathy, X-linked (IPEX) syndrome is caused by mutations in forkhead box P3 (FOXP3), which lead to the loss of function of regulatory T cells (Tregs) and the development of autoimmune manifestations early in life. The selective induction of a Treg program in autologous CD4+ T cells by FOXP3 gene transfer is a promising approach for curing IPEX. We have established a novel in vivo assay of Treg functionality, based on adoptive transfer of these cells into scurfy mice (an animal model of IPEX) and a combination of cyclophosphamide (Cy) conditioning and interleukin-2 (IL-2) treatment. This model highlighted the possibility of rescuing scurfy disease after the latter’s onset. By using this in vivo model and an optimized lentiviral vector expressing human Foxp3 and, as a reporter, a truncated form of the low-affinity nerve growth factor receptor (ΔLNGFR), we demonstrated that the adoptive transfer of FOXP3-transduced scurfy CD4+ T cells enabled the long-term rescue of scurfy autoimmune disease. The efficiency was similar to that seen with wild-type Tregs. After in vivo expansion, the converted CD4FOXP3 cells recapitulated the transcriptomic core signature for Tregs. These findings demonstrate that FOXP3 expression converts CD4+ T cells into functional Tregs capable of controlling severe autoimmune disease.
Introduction
Immunodysregulation, polyendocrinopathy, enteropathy, X-linked (IPEX) syndrome is a primary immunodeficiency caused by mutations in the gene coding for the transcription factor forkhead box P3 (FOXP3).1,2 These mutations lead to the loss of function of CD4+CD25+ regulatory T cells (Tregs), a small subset of CD4+ T cells dedicated to the control of immune response.3-5 Patients with IPEX develop multiple autoimmune manifestations early in life.6 The current treatments for IPEX syndrome include supportive therapy, immunosuppressive therapy, and hematopoietic stem cell transplantation (HSCT). Immunosuppression is usually partially effective and is often limited by infectious complications and toxicities. At present, the only curative treatment is allogeneic HSCT. However, the lack of HLA-compatible donors and the patients’ condition result in high mortality. Effective alternative treatments are therefore urgently needed. From HSCT, we learned that partial donor chimerism and selective expansion of Tregs are sufficient for complete remission.7-9
Scurfy mice present a spontaneous Foxp3 mutation. Within the first 10 days of life, these mice develop a fatal disease with organ-specific autoimmunity10 that reproduces the most severe IPEX syndrome. Various studies of the scurfy mouse have demonstrated that the adoptive transfer of Tregs within the first 2 days of life is an effective treatment.3,11 However, no one has demonstrated that Treg transfer can cure scurfy disease. A new therapeutic strategy is required to broaden the therapeutic window and mimic the patient treatments.
Several gene therapies targeting mature T cells have been successfully developed.12,13 In Rag-deficient mice, the retroviral or lentiviral transfer of Foxp3 was sufficient to convert CD4+ T cells into suppressive lymphocytes able to control an inflammatory bowel disease.3 Furthermore, Passerini et al demonstrated that the adoptive transfer of FOXP3-transduced CD4+ T cells prevented graft-versus-host disease in a xenograft model.14 These preclinical studies suggest that the transfer of the wild-type (WT) FOXP3 gene into T cells is a promising treatment.3,14 At present, 2 caveats prevent the translation of these preclinical studies into the clinic: the adoptive transfer of Foxp3-transduced CD4+ T cells was used before the onset of autoimmune manifestations, and the FOXP3-transduced cells only partly reproduced the Treg’s transcriptional signature and suppressive function.15 The expression of FOXP3 must be stable and strong enough to provide suppressive function, and a surface marker is required to avoid adverse reactions related to the injection of noncorrected conventional T cells (Tconvs).
Here, we describe development and implementation of a full preclinical strategy for transferring FOXP3 into scurfy CD4+ T cells. We demonstrated that the resulting Tregs were able to rescue disease manifestations in the scurfy model after the onset of autoimmune disease. This gene-therapy strategy paves the way to clinical trials with curative intent in patients with IPEX.
Material and methods
Ethics
Animal procedures were approved by the animal committee of the University of Paris (Paris, France; 7 March 2017) and the Ministry of Agriculture (APAFIS#8440-2016062309559589). The procedures were performed in accordance with European Union (EU) Directive 2010/63/EU.
Mice
The scurfy phenotype was obtained by backcrossing on a B6.129S7-Rag1tm1Mom/J background, allowing the generation of XSf/ XSf.Rag1−/− female mice. Crossing of these female mice with WT C57BL/6J mice resulted in only diseased XSf/Y.Rag1−/+ male mice. These male mice developed a scurfy phenotype. We developed a specific scurfy disease score ranging from 0 (no disease) to 21 (most severe disease) (supplemental Table 1, available on the Blood Web site).
WT Tregs
Splenocytes and lymph nodes were harvested from B6LY5.1 CD45.1 mice.
Scurfy CD4+ T cells
Lymph nodes were collected from 10-day-old scurfy mice, and CD4+ T cells were separated using a murine CD4+ T-cell Isolation kit (Miltenyi Biotec, Paris, France).
Lentiviral vectors
The complementary DNAs coding for a truncated codon-optimized human low-affinity nerve growth factor receptor (ΔLNGFR) as a membranous reporter and a codon-optimized human FOXP3 (hFOXP3) were cloned into a pCCL backbone. We generated 8 vectors in total: 4 expressing FOXP3 and the 4 corresponding mocks.
Two vectors had a bidirectional promoter architecture. One allowed FOXP3 expression under the control of ubiquitous elongation factor 1 α (EF1α) and ΔLNGFR expression under the control of the phosphoglycerate (PGK) promoter (LNGFRp-eFOXP3 and LNGFRp-e, respectively), and the other allowed FOXP3 expression under the control of PGK and ΔLNGFR under the control of the short version of EF1α (EFS) (LNGFRe-pFOXP3 and LNGFRe-p, respectively). Two bicistronic vectors were created (using the 2A self-cleaving peptide system) to allow the coexpression of FOXP3 and ΔLNGFR (namely eLNGFR.t2a.FOXP3 and eLNGFR.t2a vs eFOXP3.t2a.LNGFR and e.t2a.LNGFR) (Figure 1A).
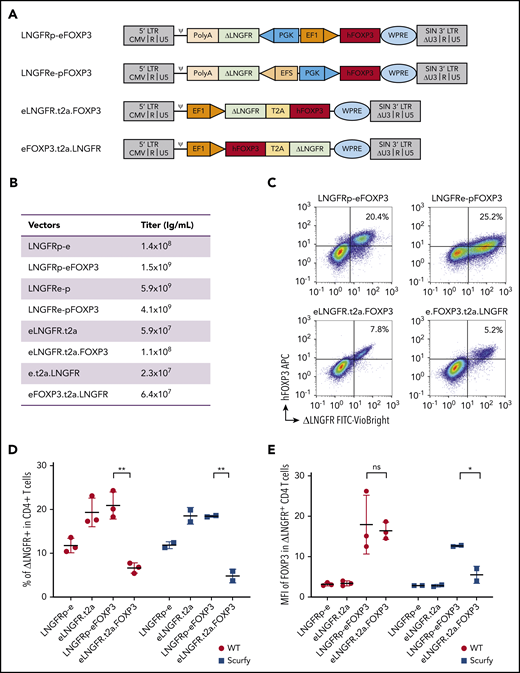
The efficiency of FOXP3 expression by lentiviral vectors. (A) Vector maps showing the design of the 4 vectors and their mock counterparts within the pCCL backbone. Two bidirectional vectors: LNGFRp-eFOXP3 expressing FOXP3 under the control of EF1α promoter and expressing the reporter protein ΔLNGFR under the control of PGK promoter, and its mock counterpart LNGFRp-e, and LNGFRe-pFOXP3 expressing FOXP3 under the control of PGK promoter and expressing the reporter protein ΔLNGFR under the control of the EFS promoter, and its mock counterpart LNGFRe-p. Two bicistronic vectors under the control of EF1 promoter, both based on a self-cleaving T2A sequence: eLNGFR.t2a.FOXP3 and its mock counterpart eLNGFR.t2a and eFOXP3.t2a.LNGFR, and its mock counterpart e.t2a.LNGFR. (B) Quantification of the titers of vector used for transduction. (C) Representative flow cytometry dot plots showing the expression of hFOXP3 and ΔLNGFR on WT murine CD4+ T cells 5 days after transduction with all the constructs expressing FOXP3. The correlation between FOXP3 expression and ΔLNGFR expression was quantified by calculating the Spearman correlation coefficient (r2 = 0.51, 0.54, 0.66, and 0.61 for the LNGFRp-eFOXP3, LNGFRe-pFOXP3, eLNGFR.t2a.FOXP3, and eFOXP3.t2a.LNGFR vectors, respectively). (D) Transduction efficacy quantified as the percentage of ΔLNGFR on day 5 after transduction in WT and scurfy CD4+ T cells. Transduction efficiency was significantly higher with the LNGFRp-eFOXP3 vector than with the LNGFR.t2a.FOXP3 vector for both WT CD4+ T cells and scurfy CD4+ T cells (P = .002 and .007, respectively, in a Mann-Whitney test). In contrast, transduction efficacy with the mock vectors was higher with the T2A construct (P = .02 and .04 in WT and scurfy CD4+ T cells, respectively). n = 3 independent experiments for WT CD4+ T cells and n = 2 independent experiments for scurfy CD4+ T cells. (E) The geometric MFI for FOXP3 expression was quantified on day 5 posttransduction (gated on CD4+ ΔLNGFR+) in WT cells or scurfy cells. The hFOXP3 MFI in WT CD4 T cells was similar with LNGFRp-eFOXP3 and LNGFR.t2a.FOXP3 vectors. The MFI was significantly higher in scurfy CD4 T cells transduced with the LNGFRp-eFOXP3 vector than in the same cell type transduced with LNGFR.t2a.FOXP3 (P = .04 in a Mann-Whitney test). n = 3 independent experiments for WT CD4+ T cells and n = 2 independent experiments for scurfy CD4+ cells. ψ, psi packaging element; *P < .05; **P < .01; APC, allophycocyanine; CMV, cytomegalovirus; FITC, fluorescein isothiocyanate; LTR, long terminal repeat; ns, not significant; PolyA, polyadenylation sequence; SIN, self-inactivating; WPRE, woodchuck hepatitis virus posttranscriptional regulatory element.
The efficiency of FOXP3 expression by lentiviral vectors. (A) Vector maps showing the design of the 4 vectors and their mock counterparts within the pCCL backbone. Two bidirectional vectors: LNGFRp-eFOXP3 expressing FOXP3 under the control of EF1α promoter and expressing the reporter protein ΔLNGFR under the control of PGK promoter, and its mock counterpart LNGFRp-e, and LNGFRe-pFOXP3 expressing FOXP3 under the control of PGK promoter and expressing the reporter protein ΔLNGFR under the control of the EFS promoter, and its mock counterpart LNGFRe-p. Two bicistronic vectors under the control of EF1 promoter, both based on a self-cleaving T2A sequence: eLNGFR.t2a.FOXP3 and its mock counterpart eLNGFR.t2a and eFOXP3.t2a.LNGFR, and its mock counterpart e.t2a.LNGFR. (B) Quantification of the titers of vector used for transduction. (C) Representative flow cytometry dot plots showing the expression of hFOXP3 and ΔLNGFR on WT murine CD4+ T cells 5 days after transduction with all the constructs expressing FOXP3. The correlation between FOXP3 expression and ΔLNGFR expression was quantified by calculating the Spearman correlation coefficient (r2 = 0.51, 0.54, 0.66, and 0.61 for the LNGFRp-eFOXP3, LNGFRe-pFOXP3, eLNGFR.t2a.FOXP3, and eFOXP3.t2a.LNGFR vectors, respectively). (D) Transduction efficacy quantified as the percentage of ΔLNGFR on day 5 after transduction in WT and scurfy CD4+ T cells. Transduction efficiency was significantly higher with the LNGFRp-eFOXP3 vector than with the LNGFR.t2a.FOXP3 vector for both WT CD4+ T cells and scurfy CD4+ T cells (P = .002 and .007, respectively, in a Mann-Whitney test). In contrast, transduction efficacy with the mock vectors was higher with the T2A construct (P = .02 and .04 in WT and scurfy CD4+ T cells, respectively). n = 3 independent experiments for WT CD4+ T cells and n = 2 independent experiments for scurfy CD4+ T cells. (E) The geometric MFI for FOXP3 expression was quantified on day 5 posttransduction (gated on CD4+ ΔLNGFR+) in WT cells or scurfy cells. The hFOXP3 MFI in WT CD4 T cells was similar with LNGFRp-eFOXP3 and LNGFR.t2a.FOXP3 vectors. The MFI was significantly higher in scurfy CD4 T cells transduced with the LNGFRp-eFOXP3 vector than in the same cell type transduced with LNGFR.t2a.FOXP3 (P = .04 in a Mann-Whitney test). n = 3 independent experiments for WT CD4+ T cells and n = 2 independent experiments for scurfy CD4+ cells. ψ, psi packaging element; *P < .05; **P < .01; APC, allophycocyanine; CMV, cytomegalovirus; FITC, fluorescein isothiocyanate; LTR, long terminal repeat; ns, not significant; PolyA, polyadenylation sequence; SIN, self-inactivating; WPRE, woodchuck hepatitis virus posttranscriptional regulatory element.
T-cell transduction
T-cell transduction was performed as previously described.16 Transduced cells were stained on day 5 posttransduction, using ΔLNGFR phycoerythrin antibodies (clone ME20.4-1.H4; Miltenyi Biotec), and sorted on an SH800 system (Sony Biotechnology, Weybridge, United Kingdom).
Adoptive T-cell transfer
First, scurfy mice were treated with 2 mg/kg temsirolimus (Te; LC Laboratories, Woburn, MA) via subcutaneous injections twice a week. An anti-CD3 Fab′2 (clone 145-2C11; BioXCell, West Lebanon, NH) was injected subcutaneously (20 µg per day) once a day for 5 days, starting on day 8 after birth. Cyclophosphamide (Cy) (European Pharmacopoeia Reference Standard; Merck KGaA, Darmstadt, Germany) was injected intraperitoneally at 50, 100, or 150 mg/kg 10 days after birth. On day 10 or day 14, CD4+CD25+ CD45.1+ cells or engineered CD4+ T cells from scurfy mice were injected intraperitoneally. In the indicated experiments, human interleukin-2 (IL-2) (PROLEUKIN; Novartis, Basel, Switzerland) was injected intraperitoneally at 1000 IU/g once a day for 5 days and then once a week. A reference survival curve of untreated scurfy mice was generated from all experiments.
Transcriptomic analysis
On day 50, 1000 CD45.1 or LNGFR+ CD4+ T cells were sorted twice from lymph nodes (using a flow cytometer [SH800; Sony Biotechnology]) directly into 5 µL of lysis buffer. Smart-seq2 libraries for ultra-low-input RNA sequencing (RNA-seq) were prepared as described previously.17,18 Samples were sequenced on an Illumina NextSeq500 system, using the 2- × 25-bp read option. Transcripts were quantified using the Broad Technology Labs computational pipeline.19 Normalized reads were further filtered and analyzed using Multiplot Studio in GenePattern software (https://www.genepattern.org/modules/docs/Multiplot/2) and R Studio (version 1.2.5019, RStudio Team 2020; PBC, Boston, MA; http://www.rstudio.com/). To reduce noise, only genes with a coefficient of variation between biological replicates <0.3 in either comparison group, and with at least 1 sample with an expression value >30, were selected.
Statistical analysis
Data were described as the mean plus or minus standard deviation (SD). All statistical analyses were performed with GraphPad Prism (version 8.0; GraphPad Software, Inc, San Diego, CA). Statistical tests included the nonparametric Mann-Whitney test, the Fisher exact test, and 2-way analysis of variance. The threshold for statistical significance was set to P < .05.
Results
Conversion of scurfy CD4+ T cells into Tregs by FOXP3 gene transfer
Four distinct vectors were generated: 2 bidirectional vectors using either a PGK/EF1α (p-e) or an EFS/PGK (e-p) promoter cassette driving the expression of ΔLNGFR in the reverse orientation and FOXP3 in the forward position, and 2 bicistronic vectors using the T2A self-cleaving peptide system to coexpress LNGFR and FOXP3, either LNGFR.t2a.FOXP3 or FOXP3.t2a.LNGFR (both driven by the EF1α promoter) (Figure 1A). The corresponding 4 mock vectors (driving the expression of ΔLNGFR only) were also generated.
The titers of the bidirectional vectors were >10 times higher than those of the bicistronic vectors (Figure 1B). Five days after transduction at a multiplicity of infection of 10 (Figure 1C), 5.2% to 25.2% of the WT CD4+ T cells expressed ΔLNGFR+. Spearman coefficient (r2) for the correlation between FOXP3 and ΔLNGFR expression was 0.51, 0.54, 0.66, and 0.61 for the LNGFRp-eFOXP3, LNGFRe-pFOXP3, eLNGFR.t2a.FOXP3, and eFOXP3.t2a.LNGFR vectors, respectively. The eFOXP3.t2a.LNGFR vector was excluded from further evaluation because of its low transduction efficiency. The LNGFRe-pFOXP3 construct gave a lower mean fluorescence intensity (MFI) for FOXP3 expression and was excluded. Both the LNGFRp-eFOXP3 and eLNGFR.t2a.FOXP3 constructs were tested in scurfy CD4+ T cells. As shown in Figure 1D, the level of transduction after 5 days was significantly higher with the bidirectional LNGFRp-eFOXP3 construct than with the bicistronic eLNGFR.t2a.FOXP3 construct for both WT CD4+ T lymphocytes and scurfy CD4+ T lymphocytes (P = .002 and .007, respectively). Importantly, the MFI of FOXP3 expression was similar for CD4LNGFRp-eFOXP3 and CD4eLNGFR.t2a.FOXP3 in WT cells but was significantly higher with the bidirectional LNGFRp-eFOXP3 construct, compared with the T2A construct in scurfy CD4+ T lymphocytes (P = .04) (Figure 1E). After sorting of the transduced cell and expansion, the vector copy number (VCN) in WT CD4+ T lymphocytes ranged from 0.9 to 1.9 for the bidirectional vector and from 0.9 to 1.4 in scurfy CD4 T cells. Scurfy CD4+ T cells transduced with the T2A vector were significantly less viable, not allowing VCN quantification. Because the 3 criteria (ie, transduction efficiency, FOXP3 expression level, and correlation between FOXP3 and ΔLNGFR expression) were met for LNGFRp-eFOXP3 and its mock counterpart LNGFRp-e, they were selected for functional evaluation (referred to hereafter as LNGFR.FOXP3 and LNGFR).
A combination of Cy, IL-2, and Treg cures scurfy syndrome
Hence, we sought to develop a new therapeutic approach to skew the immune response toward the regulatory arm by depleting activated Tconvs and promoting Treg expansion.
To this end, we evaluated various immunosuppressive regimens, including Te (a prodrug for sirolimus that doubles life expectancy in scurfy mice),20 anti-CD3 antibody, and cyclophosphamide (Cy). The experimental scheme consisted of injection of the immunosuppressive drug and then the transplantation of 5 × 10⁵ congenic WT CD45.1 CD4+CD25high Tregs (supplemental Figure 1A,D,G). To reproducibly evaluate the scurfy mouse phenotype, we developed a specific scurfy disease score (supplemental Table 1). Engraftment of WT Tregs was quantified in various tissues at the study end point. When combined with Tregs, Te and anti-CD3 did not significantly curb the course of scurfy disease (supplemental Figure 1B,E). In contrast, a combination of Cy conditioning with Tregs resulted in a significantly lower scurfy score, starting from 62 days of follow-up (supplemental Figure 1H). Chimerism at end point seemed lower after Cy conditioning compared with chimerism after Te or anti-CD3 treatment (supplemental Figure 1C,F,I). But it was evaluated at a later end point (day 77) thanks to a survival improvement with Cy treatment, while analyzed at day 28 and day 35, respectively, for Te and anti-CD3 treatment. We thus selected Cy as the immunosuppressive regimen, based on scurfy scores and survival.
The percentage of WT Tregs remained low (<2% of CD4+ cells) in all of the tissues analyzed, irrespective of the type of immunosuppressive drug used (supplemental Figure 1C,F,I). We therefore sought to increase the engraftment of Tregs by evaluating different dose levels of Cy (50, 100, or 150 mg/kg body weight [data not shown] administered intraperitoneally to scurfy male mice on day 10 of life. T-cell depletion was similar for all 3 doses, with a nadir between 3 and 5 days after Cy injection. However, we observed growth retardation and transient alopecia, which were correlated with the dose of Cy. We therefore selected the lowest Cy dose (ie, 50 mg/kg) in order to reduce drug toxicity. Treg transfer was performed on day 14 in mice conditioned with a single Cy injection on day 10 (supplemental Figure 1G).
We next sought to further tip the balance in favor of Tregs by promoting their expansion. On the basis of previous reports of a beneficial effect of low-dose IL-2 on Treg expansion,21-23 we treated scurfy recipients with IL-2 once a day for 5 days and then once a week (Figure 2A). With the combination of Cy conditioning, Tregs, and IL-2 injection, the scurfy score started to fall on day 22 after Treg transfer. The score on day 36 was significantly lower in treated mice (1.0 ± 0.3) than in control mice (4.2 ± 0.2) (P = .0001 in an analysis of variance) (Figure 2B). Fifty days after Treg transfer, the CD45.1+ chimerism among CD4+ T cells was 2.2% ± 0.6% in lymph nodes, 3.7% ± 1.4% in the spleen, 2.1% ± 0.5% in the blood, 3.5% ± 3.2% in the liver, and 3.3% ± 0.8% in the lung (Figure 2C). Lastly, the survival time of Treg-transferred mice (69 days) was greater than in Cy-treated mice (39 days; P = .0004) and, furthermore, than nontreated mice (PBS, 28 days; P < .0001) (Figure 2D). Interestingly, treatment with Cy plus IL-2 alone was associated with longer survival (median survival time, 51 days), despite the lack of FOXP3+ CD4+ T cells (P = .03). As additional evidence of Treg-induced homeostatic control of the host immune system, resident CD4+ T cells maintained a CD62L+ naive compartment in Treg-treated mice but not in control mice (Figure 2E).
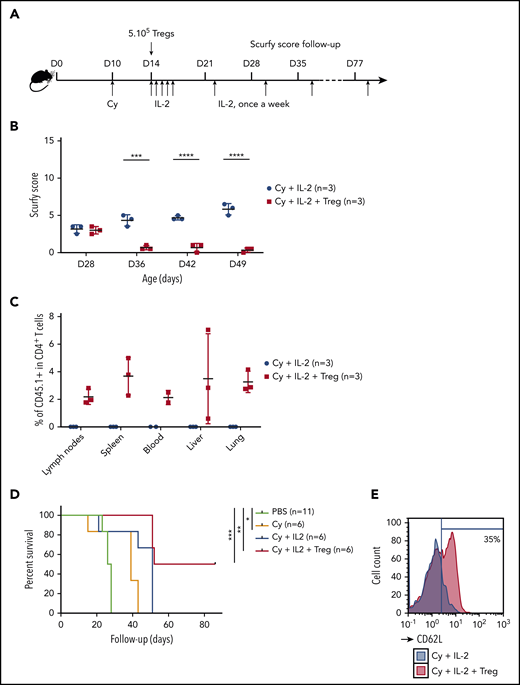
A specific combination of Cy conditioning, IL-2 treatment, and Treg transfer rescues scurfy syndrome. (A) Rescue of scurfy mice. Scurfy male mice (XSf/Y.Rag1+/− on a CD45.2 background) were conditioned by an intraperitoneal injection of 50 mg/kg Cy on day 10 and then received 5 × 10⁵ congenic CD45.1 WT Tregs on day 14. Next, 1000 IU/g IL-2 was injected intraperitoneally once a day for 5 days and then once a week. In an initial experiment, all mice were euthanized on day 50 for flow cytometry analysis. Survival was analyzed in a second experiment (n = 3 mice per group). (B) The scurfy disease score was rated (as described in “Materials and methods”) in Treg-treated mice and vehicle (PBS)-treated mice. Differences were apparent after day 31 (P = .003 in a Mann-Whitney test) and after day 38 (P < .001). (C) Flow cytometry analysis of CD45.1 chimerism, gated on CD4+ T cells in the lymph nodes, spleen, blood, liver, and lung. IL (n = 3 mice per group). (D) Survival of scurfy mice untreated (PBS), treated with Cy only (Cy), Cy and IL-2 (Cy+IL-2+PBS or Cy, IL-2, and 5 × 10⁵ Tregs (Cy+IL-2+Treg). There was a significant difference (P = .0004 in a log-rank test) between Cy+IL-2+PBS and Cy+IL-2+Treg groups (n = 6 mice per group). (E) A representative flow cytometry histogram of CD62L expression, gated on CD4+ T cells in mice that had received Treg or vehicle (n = 3 mice per group). ***P < .001; ****P < .0001.
A specific combination of Cy conditioning, IL-2 treatment, and Treg transfer rescues scurfy syndrome. (A) Rescue of scurfy mice. Scurfy male mice (XSf/Y.Rag1+/− on a CD45.2 background) were conditioned by an intraperitoneal injection of 50 mg/kg Cy on day 10 and then received 5 × 10⁵ congenic CD45.1 WT Tregs on day 14. Next, 1000 IU/g IL-2 was injected intraperitoneally once a day for 5 days and then once a week. In an initial experiment, all mice were euthanized on day 50 for flow cytometry analysis. Survival was analyzed in a second experiment (n = 3 mice per group). (B) The scurfy disease score was rated (as described in “Materials and methods”) in Treg-treated mice and vehicle (PBS)-treated mice. Differences were apparent after day 31 (P = .003 in a Mann-Whitney test) and after day 38 (P < .001). (C) Flow cytometry analysis of CD45.1 chimerism, gated on CD4+ T cells in the lymph nodes, spleen, blood, liver, and lung. IL (n = 3 mice per group). (D) Survival of scurfy mice untreated (PBS), treated with Cy only (Cy), Cy and IL-2 (Cy+IL-2+PBS or Cy, IL-2, and 5 × 10⁵ Tregs (Cy+IL-2+Treg). There was a significant difference (P = .0004 in a log-rank test) between Cy+IL-2+PBS and Cy+IL-2+Treg groups (n = 6 mice per group). (E) A representative flow cytometry histogram of CD62L expression, gated on CD4+ T cells in mice that had received Treg or vehicle (n = 3 mice per group). ***P < .001; ****P < .0001.
This is the first evidence to show that delayed Treg administration in combination with Cy conditioning and low-dose IL-2 can improve outcomes in scurfy mice.
Scurfy CD4+ T cells transduced with the LNGFR.FOXP3 vector rescue scurfy mice
We next used our adoptive transfer model to evaluate the ability of transduced CD4LNGFR.FOXP3 cells to control scurfy disease. First, to assess the dose of CD4LNGFR.FOXP3 cells required, Cy-conditioned scurfy male mice were injected at the age of 14 days with congenic 5 × 10⁵ CD45.1 Tregs or 5 × 10⁵, 7.5 × 10⁵, or 1 × 10⁶scurfy CD4LNGFR.FOXP3 cells. The results were not significant between the 3 different doses and WT Tregs. Importantly, 1 mouse was euthanized before reaching the 50-day end point in the 1 × 10e6 dose group because of severe scurfy injury. Therefore, the mean score at end point was underevaluated in this arm. In addition, the chimerism was higher in the 7.5 × 10⁵ group with 4.0% in the blood compared with the 1 × 10⁶ group and the 5 × 10⁵ group (with, respectively, 1.2% and 0.6%; supplemental Figure 2B-C). For those reasons, the dose of 7.5 × 10⁵ CD4LNGFR.FOXP3 was selected for further evaluation. The naive CD4+ T-cell compartment (characterized by CD62L staining) was restored to a similar extent by the 3 doses of CD4LNGFR.FOXP3 (supplemental Figure 2D).
Adoptive transfer experiments with 5 × 10⁵ WT Tregs, 7.5 × 10⁵ CD4LNGFR.FOXP3 cells, 7.5 × 10⁵ CD4LNGFR cells, and vehicle (phosphate-buffered saline [PBS]) were assessed. All mice received Cy and IL-2. The VCN of CD4LNGFR.FOXP3 and CD4LNGFR ranged from 1.2 to 1.5. Mice were carefully monitored until they were euthanized on day 50. The scurfy score rose above 7 in all groups in a similar manner, up to day 27 (Figure 3A). By day 32, the mean plus or minus SD score had risen toward the end point to the same extent in mice that received Cy and IL-2 alone or CD4LNGFR cells, but was significantly lower in mice treated with WT Tregs and CD4LNGFR.FOXP3 cells (6.5 ± 0.5 and 4.5 ± 0.5, respectively; P = .007 and .0008, respectively). More specifically, mice having received WT Tregs and CD4LNGFR.FOXP3 cells gained weight, had improved eczema on the tail and blepharitis, and recovered from Cy-induced alopecia. In contrast, mice having received vehicle or CD4LNGFR cells failed to thrive and presented severe eczema over the whole body (supplemental Figure 3A).
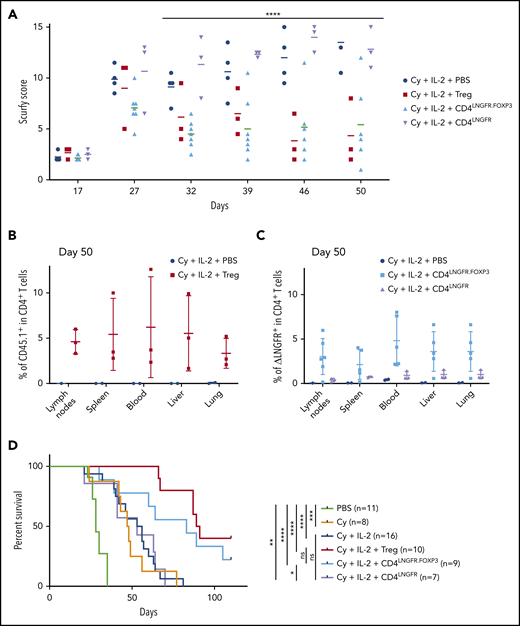
Scurfy CD4 T cells engineered with an LNGFR.FOXP3 vector rescue scurfy mice after disease onset. Male scurfy mice (XSf/Y.Rag1+/− on a CD45.2 background) were conditioned by an intraperitoneal injection of 50 mg/kg Cy on day 10 and then received either vehicle, 5 × 10⁵ congenic CD45.1 WT Tregs, CD4LNGFR transduced scurfy cells, or 0.75 × 10⁶ CD4LNGFR.FOXP3 transduced scurfy cells on day 14. Next, 1000 IU/g IL-2 were injected intraperitoneally once a day for 5 days and then once a week. Data from at least 2 independent experiments are shown. (A) The mean plus or minus SD scurfy disease score in mice treated with Tregs, CD4LNGFR, and CD4LNGFR.FOXP3, vs vehicle-treated mice (P = .01, .26, and .02 in a Mann-Whitney test, respectively) on day 42 (n ≥ 3 per group). (B) All of the mice were euthanized on day 50 for flow cytometry analysis. CD45.1 chimerism was analyzed on day 50 (gated on CD4+ T cells) for the lymph nodes, spleen, blood, liver, and lung in mice receiving WT Tregs or PBS. (C) ΔLNGFR chimerism was analyzed on day 50 (gated on CD4+ T cells) in the lymph nodes, spleen, blood, liver, and lung in mice receiving CD4LNGFR.FOXP3 cells, CD4LNGFR cells, or PBS. The level of chimerism was higher in CD4LNGFR.FOXP3-treated mice than in CD4LNGFR-treated mice (P = .001). (D) Survival of scurfy mice from 2 independent experiments. Treatment with IL-2 did not increase survival relative to treatment with Cy or CD4LNGFR cells. Mice treated with Tregs and CD4LNGFR.FOXP3 cells survived significantly longer than Cy-treated mice (P < .0001 and .0195, respectively; n ≥ 5 per group). Follow-up was continued up to 110 days. *P < .05; **P < .01; ***P < .001; ****P < .0001.
Scurfy CD4 T cells engineered with an LNGFR.FOXP3 vector rescue scurfy mice after disease onset. Male scurfy mice (XSf/Y.Rag1+/− on a CD45.2 background) were conditioned by an intraperitoneal injection of 50 mg/kg Cy on day 10 and then received either vehicle, 5 × 10⁵ congenic CD45.1 WT Tregs, CD4LNGFR transduced scurfy cells, or 0.75 × 10⁶ CD4LNGFR.FOXP3 transduced scurfy cells on day 14. Next, 1000 IU/g IL-2 were injected intraperitoneally once a day for 5 days and then once a week. Data from at least 2 independent experiments are shown. (A) The mean plus or minus SD scurfy disease score in mice treated with Tregs, CD4LNGFR, and CD4LNGFR.FOXP3, vs vehicle-treated mice (P = .01, .26, and .02 in a Mann-Whitney test, respectively) on day 42 (n ≥ 3 per group). (B) All of the mice were euthanized on day 50 for flow cytometry analysis. CD45.1 chimerism was analyzed on day 50 (gated on CD4+ T cells) for the lymph nodes, spleen, blood, liver, and lung in mice receiving WT Tregs or PBS. (C) ΔLNGFR chimerism was analyzed on day 50 (gated on CD4+ T cells) in the lymph nodes, spleen, blood, liver, and lung in mice receiving CD4LNGFR.FOXP3 cells, CD4LNGFR cells, or PBS. The level of chimerism was higher in CD4LNGFR.FOXP3-treated mice than in CD4LNGFR-treated mice (P = .001). (D) Survival of scurfy mice from 2 independent experiments. Treatment with IL-2 did not increase survival relative to treatment with Cy or CD4LNGFR cells. Mice treated with Tregs and CD4LNGFR.FOXP3 cells survived significantly longer than Cy-treated mice (P < .0001 and .0195, respectively; n ≥ 5 per group). Follow-up was continued up to 110 days. *P < .05; **P < .01; ***P < .001; ****P < .0001.
On day 50, chimerism analysis showed that the mean percentage of CD45.1 WT Tregs was 5% (1.7% to 12.6%) in lymph nodes, spleen, blood, liver, and lung (Figure 3B). In mice treated with CD4LNGFR.FOXP3 T cells, the percentage of chimerism was slightly lower, with a mean value of 3.4% (0.2% to 4.6%) in lymph nodes, spleen, blood, liver, and lung (Figure 3C). In contrast, CD4LNGFR T cells did not expand, and the percentage of chimerism remained below 1.5% in all tissues. Importantly, hFOXP3 expression in the lymph nodes was maintained 50 days after adoptive transfer in animals treated with ΔLNGFR+ CD4+ cells (supplemental Figure 3B). The ΔLNGFR+ cells were sorted from the lymph nodes, and the mean plus or minus SD VCN was 2.3 ± 0.8 in CD4LNGFR.FOXP3 T cells and 1.6 ± 0.7 in CD4LNGFR T cells (supplemental Figure 3C).
CD62L staining of the lymph nodes (supplemental Figure 3D) demonstrated that a subset of naive CD4+ T cells had been restored and maintained in mice treated with Tregs and CD4LNGFR.FOXP3 cells. The percentage of CD62L+ cells was 15.7% ± 0.6% in CD4+ T cells from scurfy mice treated with Cy and IL-2 and 78.1% ± 2.4% in WT mice. Adoptive transfer of Tregs or CD4LNGFR.FOXP3 T cells in scurfy mice increased the percentage of CD62L+ cells to 44.0% ± 6.2% and 31.1% ± 11.8%, respectively, whereas adoptive transfer of CD4LNGFR T cells maintained the level at 20.8% ± 2.5% (supplemental Figure 3D).
Survival was significantly extended following CD4LNGFR.FOXP3 treatment, relative to Cy-treated scurfy mice; the median survival times were 83 and 47 days, respectively (P = .0195). Median survival was significantly longer with WT Tregs (90 days) than with Cy alone (47 days) (P < .0001). Median survival for Treg-treated mice did not differ significantly from that in CD4LNGFR.FOXP3-treated mice (P = .285). Likewise, PBS- and CD4LNGFR-treated mice did not differ significantly in their survival, with median survival times of 54.5 and 53 days, respectively (P = .8729) (Figure 3D). After 110 days of follow-up, the degree of chimerism in CD4+ T cells from the CD45.1 Treg and CD4LNGFR.FOXP3 groups was lower than on day 50, with mean values of 1.5% and 1.1%, respectively (supplemental Figure 3E). Importantly, hFOXP3 could still be detected in CD4LNGFR.FOXP3 T cells, demonstrating the in vivo stability of this protein in transduced scurfy CD4+ T cells.
Overall, these results demonstrated that FOXP3 expression in scurfy CD4+ T cells recapitulated suppressor function and transduced CD4LNGFR.FOXP3 cells were able to rescue mice from scurfy autoimmune disease.
LNGFR.FOXP3-expressing scurfy CD4+ T cells significantly recapitulate the Treg transcriptomic profile
To determine whether the engineered CD4LNGFR.FOXP3 cells mimicked bona fide Tregs, we explored their transcriptomic profile 35 days after adoptive transfer in scurfy recipients. FOXP3-transduced CD4+ T cells have been analyzed before but only after in vitro culture; our present experiments were designed to reveal the effect of transducing with cells that have settled in vivo, that is, the direct impact of FOXP3 and secondary cell adaptations in vivo. We thus purified RNA from rescued scurfy mice CD4LNGFR.FOXP3, CD4LNGFR T cells, and WT Tregs for low-input RNA-seq transcriptomic analyses. Several important observations were made. First, the RNA-seq reads distinguished between the transduced hFOXP3 and the endogenous murine Foxp3 (mFoxp3) (supplemental Figure 4A). hFOXP3 transcripts were detected in all CD4LNGFR.FOXP3 samples at levels (∼1000 arbitrary units) that were somewhat higher than in healthy human blood Tregs (typically ∼150-200 in our studies; supplemental Figure 4A). mFoxp3 transcripts were also detected at slightly higher levels in CD4LNGFR.FOXP3 cells than in CD4LNGFR cells, although these levels were still much lower than in healthy murine Tregs (supplemental Figure 4B). Second, a comparison of the murine gene-expression profiles of CD4LNGFR.FOXP3 and CD4LNGFR cells showed that FOXP3 induced a significant shift toward the prototypic transcriptional signature of Tregs24 (Figure 4A; P = .005 and P = .003 for the upregulated and downregulated signatures, respectively). The direct comparison of Treg-signature genes in CD4LNGFR.FOXP3 and Tregs (supplemental Figure 4C) confirmed that upregulated transcripts were generally less expressed in CD4LNGFR.FOXP3 cells than in WT Tregs (this was most clear for mFoxp3 and Gpr83), and that downregulated transcripts were less expressed in WT Tregs than in CD4LNGFR.FOXP3 cells.
![CD4LNGFR.FOXP3 cells partly maintain the Treg signature after adoptive transfer on day 50 of life. All of the transcriptomic data came from a single experiment in which CD4LNGFR.FOXP3 cells, CD4LNGFR cells, and WT Tregs were isolated from the corresponding treated mice (respectively; n = 4, n = 2, and n = 2) euthanized at 50 days old. (A) A volcano plot (the fold change [FC] vs the P value) of the transcriptomes of CD4LNGFR.FOXP3 vs CD4LNGFR cells on day 50. The murine Treg-upregulated signature (in red), downregulated signature (in blue),24 and murine core Treg gene annotations are highlighted.25 The values in the top half represent the number of corresponding Treg signature genes induced (right) or repressed (left), with the number of upregulated signature genes in red and the number of downregulated signature genes in blue. P values for the Treg signature enrichment were obtained in a χ2 test. (B) A heat map showing expression of the core Treg genes.25 The values correspond to the FC for each gene in each sample, normalized against the mean value for CD4LNGFR cells. (C) The Treg signature score for the murine core Treg genes25 in CD4LNGFR.FOXP3 cells, where 0 and 1 correspond to expression in Tconvs (CD4.LNGFR) and Tregs, respectively. The mean plus or minus SD signature score for CD4LNGFR.FOXP3 cells is represented. (D) A heat map showing all of the significant differentially expressed genes (absolute FC > 2; P < .05) when comparing CD4LNGFR.FOXP3 cells with CD4LNGFR cells (n = 677). The log10 FC for the 3 groups of mice is shown. The Treg-downregulated signature belongs to the most downregulated genes (green). Most of the upregulated genes are involved in the cell cycle (GO:007049; false discovery rate < 0.001) whereas the most upregulated genes in both Tregs and CD4LNGFR.FOXP3 came from the Treg-upregulated signature (red). The gene names are given beside each group.](https://ash.silverchair-cdn.com/ash/content_public/journal/blood/137/17/10.1182_blood.2020009187/1/m_bloodbld2020009187f4.png?Expires=1769244455&Signature=CZvnRnE65z2CjWzcwC2u4nhmJKzVCLIySMdCUjlfHTFeIH-l6c3s3JaCadpfkwerjUI42GE1pRbLFx8JxNlFqNLVfSHJcm4vXma5-Mojm~TcQegWb2CiOdLdczCy2MoR-9qPtxMEijB3YMAdO-6pglitZx~4hOH2ClUJyipoAV7eLn2VyB-jNyACXCHeJypbODVolw-j~lwfr5cHa~QJotIJ4BRdNOIdyHI7HJ7U-7taB1FiVqlY4gcR8tQrsZYW78txhzsVXetDwrvtT~zb8ShrX7AU1gECHaHdhRsuMNAFpQWp4EIw26mgpLNS1UXH8jnO6~vsRc3Bh6UdqHrfnA__&Key-Pair-Id=APKAIE5G5CRDK6RD3PGA)
CD4LNGFR.FOXP3 cells partly maintain the Treg signature after adoptive transfer on day 50 of life. All of the transcriptomic data came from a single experiment in which CD4LNGFR.FOXP3 cells, CD4LNGFR cells, and WT Tregs were isolated from the corresponding treated mice (respectively; n = 4, n = 2, and n = 2) euthanized at 50 days old. (A) A volcano plot (the fold change [FC] vs the P value) of the transcriptomes of CD4LNGFR.FOXP3 vs CD4LNGFR cells on day 50. The murine Treg-upregulated signature (in red), downregulated signature (in blue),24 and murine core Treg gene annotations are highlighted.25 The values in the top half represent the number of corresponding Treg signature genes induced (right) or repressed (left), with the number of upregulated signature genes in red and the number of downregulated signature genes in blue. P values for the Treg signature enrichment were obtained in a χ2 test. (B) A heat map showing expression of the core Treg genes.25 The values correspond to the FC for each gene in each sample, normalized against the mean value for CD4LNGFR cells. (C) The Treg signature score for the murine core Treg genes25 in CD4LNGFR.FOXP3 cells, where 0 and 1 correspond to expression in Tconvs (CD4.LNGFR) and Tregs, respectively. The mean plus or minus SD signature score for CD4LNGFR.FOXP3 cells is represented. (D) A heat map showing all of the significant differentially expressed genes (absolute FC > 2; P < .05) when comparing CD4LNGFR.FOXP3 cells with CD4LNGFR cells (n = 677). The log10 FC for the 3 groups of mice is shown. The Treg-downregulated signature belongs to the most downregulated genes (green). Most of the upregulated genes are involved in the cell cycle (GO:007049; false discovery rate < 0.001) whereas the most upregulated genes in both Tregs and CD4LNGFR.FOXP3 came from the Treg-upregulated signature (red). The gene names are given beside each group.
CD4LNGFR.FOXP3 cells partly maintain the Treg signature after adoptive transfer on day 50 of life. All of the transcriptomic data came from a single experiment in which CD4LNGFR.FOXP3 cells, CD4LNGFR cells, and WT Tregs were isolated from the corresponding treated mice (respectively; n = 4, n = 2, and n = 2) euthanized at 50 days old. (A) A volcano plot (the fold change [FC] vs the P value) of the transcriptomes of CD4LNGFR.FOXP3 vs CD4LNGFR cells on day 50. The murine Treg-upregulated signature (in red), downregulated signature (in blue),24 and murine core Treg gene annotations are highlighted.25 The values in the top half represent the number of corresponding Treg signature genes induced (right) or repressed (left), with the number of upregulated signature genes in red and the number of downregulated signature genes in blue. P values for the Treg signature enrichment were obtained in a χ2 test. (B) A heat map showing expression of the core Treg genes.25 The values correspond to the FC for each gene in each sample, normalized against the mean value for CD4LNGFR cells. (C) The Treg signature score for the murine core Treg genes25 in CD4LNGFR.FOXP3 cells, where 0 and 1 correspond to expression in Tconvs (CD4.LNGFR) and Tregs, respectively. The mean plus or minus SD signature score for CD4LNGFR.FOXP3 cells is represented. (D) A heat map showing all of the significant differentially expressed genes (absolute FC > 2; P < .05) when comparing CD4LNGFR.FOXP3 cells with CD4LNGFR cells (n = 677). The log10 FC for the 3 groups of mice is shown. The Treg-downregulated signature belongs to the most downregulated genes (green). Most of the upregulated genes are involved in the cell cycle (GO:007049; false discovery rate < 0.001) whereas the most upregulated genes in both Tregs and CD4LNGFR.FOXP3 came from the Treg-upregulated signature (red). The gene names are given beside each group.
A focus on murine core Treg transcripts25 (Figure 4B) showed that their levels varied significantly in CD4LNGFR.FOXP3 cells: some were expressed at levels similar to those seen in WT Tregs (eg, Tnfrsf9, Capg, and Ctla4), whereas others were underexpressed (eg, Gpr83, Ikzf2, Tnfrsf1b, and mFoxp3). To provide a quantitative estimate, we computed a core Treg “signature score” (Figure 4C; supplemental Table 2), where 0 and 1 correspond to expression in Tconvs and Tregs, respectively). This score varied strongly, with some transcripts being induced to full Treg levels (Ctla4, Capg) and others less so (Gpr83, Ikzf2), giving a median [interquartile range] score of 0.41 [0.25-0.74].
More generally, we also examined the transcripts differentially expressed in CD4LNGFR.FOXP3 cells vs CD4LNGFR cells (those with a fold change [FC] > 2 and a nominal P < .01). The heat map (Figure 4D) highlighted the induction of Treg-signature genes in CD4LNGFR.FOXP3 cells and also the presence of a large gene cluster of overexpressed transcripts (relative to Tregs). A pathway analysis showed that these overexpressed transcripts were involved in cell cycling (Figure 4D). We hypothesize that this CD4LNGFR.FOXP3 population must be actively cycling, perhaps in response to homeostatic control that strongly drives Treg expansion in deficient environments. Thus, an analysis of the transcriptome revealed the lasting but partial restoration of Treg identity in FOXP3-transduced scurfy cells, even in the persistently inflammatory environment.
Discussion
Here, we described our development of a new Treg adoptive transfer model in the scurfy mouse. This model enables the long-term functional assessment of T-cell–based gene-therapy approaches for Foxp3-deficient autoimmune disease. Using a bidirectional lentiviral vector, we showed that FOXP3 gene transfer in scurfy CD4+ T cells generated potent, stable Tregs that recapitulated most of the Treg’s transcriptomic profile and rescued the scurfy syndrome.
Previously, the transfer of splenocytes, Tregs, or induced Tregs in scurfy mice has been shown to prevent the development of scurfy symptoms.3,11,26 However, there are no previous reports of rescue after symptoms have developed. Our results demonstrated that Treg transfer after the appearance of symptoms rescued scurfy symptoms. This was achieved by Cy conditioning prior to Treg injection and repeated IL-2 injections to favor Treg expansion. In this model, Treg engraftment, a significantly lower clinical score, and a threefold longer survival time (∼100 days) were observed.
Of the various Treg adoptive-transfer strategies tested here, Cy conditioning was associated with the best control of autoimmunity. Cy has been shown to deplete the T-cell niche in mice.27,28 Moreover, Cy inhibits the function of activated T cells and thus results in relative enrichment in Tregs.29,30 However, even low-dose levels of Cy resulted in adverse events in young mice. To tip the balance between Tregs and Tconvs in clinical applications, another type of conditioning would be required as anti-CD3 or anti–T-cell receptor antibodies. Those strategies would allow a selective depletion of activated T cells sparing other cell subsets and limiting side effects. However, anti-CD3 antibody was not sufficient in our model to reach an adequate level of Tconv depletion. Furthermore, low-dose IL-2 has been shown to favor Treg expansion in the context of type I diabetes,31 systemic lupus erythematous,32 and several other autoimmune diseases.33-35 IL-2 also enhances the proliferation of donor-specific Tregs and promotes tolerance in allogeneic transplantation.36,37 The safety and biological efficacy of low-dose IL-2 as a Treg inducer in a set of 14 autoimmune diseases was assessed in the TRANSREG study.34 Similar to this study, the initial induction in our mouse model was followed by weekly maintenance injections of IL-2. Importantly, treatment with low-dose IL-2 did not worsen autoimmunity in scurfy mice, suggesting that it is possible to maintain IL-2 treatment in patients. Moreover, we observed a trend toward extended survival with IL-2 alone. We hypothesized that treatment with IL-2 could expand a cell subset with suppressive properties even in the absence of FOXP3 expression.38
In our model of Treg adoptive transfer, the CD4+ T cells transduced with the LNGFR.FOXP3 vector were able to rescue the scurfy disease, demonstrating the lentiviral vector’s efficiency in restoring regulatory function. Interestingly, scurfy CD4+ T cells transduced with the LNGFR.FOXP3 vector expanded more readily than those transduced with the mock LNGFR vector. This increased sensitivity to IL-2 might have been due to a higher level of CD25 expression demonstrated by flow cytometry (not shown) and in transcriptomic data (Figure 4A-C). Moreover, these adoptively transferred Tregs were stably maintained for 110 days in an inflammatory context, expressed FOXP3 in a lasting manner, and thus kept their regulatory profile. Importantly, a transcriptomic analysis demonstrated that hFOXP3 expression was associated with the induction of mFOXP3, suggesting that the homology between human and murine FOXP3 allows the human protein to act as a transcription factor in murine CD4+ T cells.
In our assay, scurfy disease was controlled slightly better by the transfer of WT Tregs than by the transfer of CD4LNGFR.FOXP3 cells. First, the difference might be explained by the level of chimerism with CD4LNGFR.FOXP3 cells being half that seen with WT Tregs. Second, our vector expressed hFOXP3 at a lower level than mFoxp3 in WT Tregs (despite the higher level compared with human WT Tregs) (supplemental Figure 4); this may explain why the CD4LNGFR.FOXP3 cells do not fully recapitulate the murine Treg’s transcriptomic program. However, the proportion of cells expressing hFOXP3 in the present study was higher than previously reported.24 Third, the engineered CD4+ Tregs were collected from scurfy mice, activated in vitro for 5 days. This issue would require an optimization of manufacturing procedure to reduce cell activation and improve Treg retargeting of CD4+ T cells. Preselecting naive T cells might result in more effective suppressor activity.14 In the present study, some of the scurfy mice died (mostly from the recurrence of scurfy symptoms). Therefore, improvement of cell manufacturing to preserve naive or T stem cells would be interesting to improve long-term latency of transduced cells. Moreover, multiple injections of Tregs, higher-dose levels of IL-2, and/or more frequent injections of IL-2 or IL-2 mutein to preferentially expend suppressive cells could be interesting methods of improving scurfy disease control.
Our present results demonstrated the feasibility of a T-cell–based gene-therapy approach for restoring CD4+ T cells’ suppressive properties and controlling a severe autoimmune condition. Recently, Masiuk et al developed a hematopoietic stem/progenitor cell (HSPC)-based model of gene therapy using a lentiviral vector expressing FOXP3 under the control of its endogenous promoter.39 Scurfy HSPCs were engineered using this FOXP3 lentiviral vector and transplanted into WT mice to produce corrected CD4+ T cells. The CD4FOXP3 cells demonstrated their ability to prevent the onset of scurfy phenotype. The total number of corrected scurfy CD4+ T cells injected in scurfy neonates was over 1.8 × 10⁷ with a VCN ranging from 3.3 to 5.8. Our genetic engineering of CD4+ T cells obtained a curative effect with a slightly lower cell dose and a lower VCN. These results demonstrated the feasibility of a HSPC gene therapy but suggest that FOXP3 expression driven by the endogenous promoter might require a higher VCN and a higher CD4+ cell dose. Gene therapy with CD4+ T cells expressing FOXP3 under the control of a ubiquitous promoter and gene therapy with HSPCs expressing FOXP3 under the control of its own promoter are strategies that could be used separately or serially, depending on the patient profile. Gene editing in HSPCs might also be an alternative approach for full recapitulation of Treg ontogeny.40 However, treatment with genetically engineered CD4+ T cells would require mild conditioning and would then be applicable to severely diseased IPEX patients as not only full curative therapy but also as a potential bridge therapy toward stem cell gene therapy in patients with the more severe disease.6
The data reported in this article have been deposited in the Gene Expression Omnibus database (accession number GSE166017).
The online version of this article contains a data supplement.
The publication costs of this article were defrayed in part by page charge payment. Therefore, and solely to indicate this fact, this article is hereby marked “advertisement” in accordance with 18 USC section 1734.
Acknowledgments
The authors are grateful to Aurélia Dujardin, Camila Piat, Laura Zapata, Jennifer Alonso, and Emilie Panafieu from the Structure Fédérative de Recherche (SFR) Necker animal facility; Sophie Berissi, Noémie Gadessaud, and Sonita Ing from the SFR Necker histology facility; and Olivier Pellé and Corinne Cordier from the SFR Necker cytometry facility. The authors also thank Gisèle Froment, Didier Nègre, and Caroline Costa from the lentiviral production facility/SFR BioSciences Gerland-Lyon Sud (UMS3444/US8).
This work was supported by a European Research Council grant (Gene for Cure: E16145KK). This project has received State funding from the French National Research Agency (ANR) Investments for the Future Program (PIA) under grant agreement ANR-18-RHUS-0003.
Authorship
Contribution: M.D. and J.L. conceptualized the study, provided the study methodology, conducted investigations, provided formal analysis, wrote the original draft of the manuscript, and edited and reviewed the manuscript; F.B., R.K., S.L., and H.V. conducted investigations and provided formal analysis; S.S., R.T., A.M., A.G., J.O., and S.C. conducted investigations; C.L.-P. conceptualized the study, provided the study methodology, and edited and reviewed the manuscript; M.A., A.S., and D.G. conceptualized the study and provided the study methodology; B.L. conducted investigations, provided formal analysis, and edited and reviewed the manuscript; C.B., J.Z., I.A., and E.S. conceptualized the study, provided the study methodology, supervised the study, and edited and reviewed the manuscript; and M.C. conceptualized the study, provided the study methodology, acquired funding, supervised the study, and edited and reviewed the manuscript.
Conflict-of-interest disclosure: The authors declare no competing financial interests.
Correspondence: Marianne Delville, Hôpital Necker Enfant Malades, 149, rue de Sèvres, 75015 Paris, France; e-mail: marianne.delville@gmail.com.
