

Key Points
MCL-1 is required for the survival of early erythroid progenitors but is dispensable at later points as BCL-xL expression increases.
The critical function of MCL-1 in definitive erythropoiesis is to prevent apoptosis.

Abstract
Although BCL-xL is critical to the survival of mature erythrocytes, it is still unclear whether other antiapoptotic molecules mediate survival during earlier stages of erythropoiesis. Here, we demonstrate that erythroid-specific Mcl1 deletion results in embryonic lethality beyond embryonic day 13.5 as a result of severe anemia caused by a lack of mature red blood cells (RBCs). Mcl1-deleted embryos exhibit stunted growth, ischemic necrosis, and decreased RBCs in the blood. Furthermore, we demonstrate that MCL-1 is only required during early definitive erythropoiesis; during later stages, developing erythrocytes become MCL-1 independent and upregulate the expression of BCL-xL. Functionally, MCL-1 relies upon its ability to prevent apoptosis to promote erythroid development because codeletion of the proapoptotic effectors Bax and Bak can overcome the requirement for MCL-1 expression. Furthermore, ectopic expression of human BCL2 in erythroid progenitors can compensate for Mcl1 deletion, indicating redundancy between these 2 antiapoptotic family members. These data clearly demonstrate a requirement for MCL-1 in promoting survival of early erythroid progenitors.
Introduction
Erythropoiesis requires the cytokine erythropoietin (EPO), which promotes red blood cell (RBC) development by facilitating erythroid differentiation and promoting survival.1-3 EPO binds to its receptor, activating the downstream receptor JAK2 and recruiting the transcription factors STAT5a/b.4,5 Active STAT5 can bind the Bcl2l1 (encodes BCL-xL) promoter,6 and EPO signaling induces BCL-xL expression by 36 hours after the initiation of terminal erythroid differentiation.7,8 EPO signaling is critical because mice lacking Epo or EpoR die around embryonic day 12.5 (E12.5) as a result of a deficiency in definitive erythropoiesis.2
Prosurvival BCL-2 molecules prevent apoptosis by inhibiting the activation of the proapoptotic effectors BAX and BAK.9 Genetic models have provided insight into the roles of individual antiapoptotic molecules during hematopoiesis. Bcl2-deficient mice are viable but exhibit a spectrum of abnormalities, including lymphocyte apoptosis; otherwise, hematopoiesis proceeds unperturbed.10-12 Loss of 3 isoforms of Bcl2a1 causes only minor defects in hematopoiesis.13 BCL-w is not required for hematopoiesis.14-16 Bcl2l1-deficient mice (lacking BCL-xL) form blood progenitors but lack mature RBCs and die around E12.5,17 indicating that BCL-xL is a survival factor downstream of EPO signaling. Bcl2l1 conditional–knockout animals, which survive, develop hemolytic anemia,18 demonstrating that BCL-xL is not required for promoting the survival of erythroid progenitors, but of late-stage reticulocytes.19 BCL-xL is also required for the survival of mature platelets.20 In contrast, Mcl1 is essential for the survival of multiple lineages, including stem cells,21 lymphocytes,22-26 and neutrophils,27,28 but whether MCL-1 plays any critical role during erythropoiesis is poorly understood.
Here, we report that conditional Mcl1 deletion, using an erythroid-specific mouse that contains GFPcre knocked into the Epo receptor (EpoR) locus,29 leads to failure of RBC maturation, anemia, and embryonic lethality. Using an ex vivo culture system, we demonstrate that expression of MCL-1 is required during early erythropoiesis but is dispensable later. Finally, Bax and Bak deletion or lentiviral-mediated overexpression of the prosurvival factor BCL2 can rescue Mcl1 loss in murine erythropoiesis. These data reveal a requirement for MCL-1 during early erythropoiesis that is mediated by its antiapoptotic function.
Materials and methods
Mice
Mcl1F/F and Mcl1F/FRosa26-ERCreT2 mice were described previously.30,31 EpoR-Cre29 mice were crossed with Mcl1F/F animals on a C57BL/6 background. BaxF/FBak−/− mice32 were crossed with Mcl1F/FRosa26-ERCreT2+ animals. All procedures were approved by the St Jude Institutional Animal Care and Use Committee.
Fetal liver studies
Mcl1F/FRosa-ERCreT2 and C57BL/6 fetal liver cells were isolated and/or cultured.33,34 Progenitors isolated using anti-TER119–biotin MicroBeads (Miltenyi Biotec) were seeded on fibronectin-coated plates (Corning). For inducible deletion, 4-OH-tamoxifen (4-OHT; 0.5 µM; Sigma-Aldrich) was added during the first 18 hours of culture or overnight the second day of culture. Day 1 (stem cell factor [SCF]) media consisted of Iscove modified Dulbecco medium (IMDM) containing 15% fetal bovine serum (FBS), 1% penicillin-streptomycin, 2 mM l-glutamine, 10−4 M 2-mercaptoethanol, SCF (50 ng/mL; Rockland Immunochemicals), FLT-3L (30 ng/mL; Rockland Immunochemicals), and interleukin-6 [IL-6]; 20 ng/mL; Rockland Immunochemicals). Day 2 (EPO) media consisted of IMDM containing 15% FBS, 1% penicillin-streptomycin, 1% bovine serum albumin (STEMCELL Technologies), 200 μg/mL holo-transferrin (Sigma-Aldrich), 10 μg/mL human insulin (Sigma-Aldrich), l-glutamine, 2-mercaptoethanol, and 2 U/mL EPO (R&D Systems). Day 3 media consisted of IMDM containing 20% FBS, 1% penicillin-streptomycin, l-glutamine, and 2-mercaptoethanol.
Lentivirus studies
Human complementary DNAs (cDNAs), cloned into pHAGE-UBC-GFP-zsGreen vector, were packaged.35 TER119− fetal liver cells were infected (multiplicity of infection 5) in LentiBOOST (Sirion Biotech) for 16 hours, followed by 4-OHT treatment and media changes as above.
Transplant studies
Bone marrow (BM) from donors (CD45.2+) was transplanted into irradiated (1100 rad) recipients (B6.SJL-Ptprca Pepcb/BoyJ; The Jackson Laboratory). After 4 weeks of engraftment, half of the recipients received tamoxifen (Sigma) to activate Cre (1 mg/d for 5 consecutive days by gavage) and were monitored for 8 weeks and then harvested. Control mice received sunflower seed oil vehicle. Where required, animals that died or became moribund were harvested before the predetermined end point.
Pathology
Embryos fixed in 10% formalin (ThermoFisher) were embedded, sectioned, mounted (SuperfrostPlus; ThermoFisher), and stained with hematoxylin and eosin. Immunohistochemical staining with antiactive caspase-3 (Biocare Medical) and anti-TER119 (BD Biosciences) was detected using a ChromoMap DAB Kit (Ventana Medical Systems).
Cytospins and colony-forming assays
Colony-forming assays were performed in triplicate using semisolid medium (MethoCult M3434 for burst forming unit-erythroid [BFU-E] and MethoCult M3534 for myeloid; STEMCELL Technologies). Colonies were counted after 7 to 10 days in culture. Cytospins were performed with a Cyto-Tek centrifuge (Miles Scientific) using SuperfrostPlus slides and Wright-Giemsa stain (Eng Scientific) or One Step Wrights stain (Hardy Diagnostics). Micrographs were acquired using Leica LAS X software and a Leica SP8 microscope (Leica Microsystems).
Real-time PCR, immunoblot, and flow cytometry
RNA was extracted using TRIzol Reagent (Invitrogen) or an RNeasy Kit (QIAGEN) and reverse transcribed using SuperScript III (Life Technologies). Real-time polymerase chain reaction (PCR) was performed using SYBR Green (ThermoFisher). Data acquired by a QuantStudio7 Flex Real-Time PCR System (ThermoFisher) were analyzed by the ΔΔCt method with a housekeeping gene (ubiquitin) compared with unstimulated cells. Primer sequences are available by request.
Immunoblotting was performed as previously described36 using antibodies against: murine MCL-1 (Rockland Immunochemicals), BAK, Actin (Millipore), BAX, BCL-w, BCL-xL, BFL-1, human MCL-1, TOM20 (Cell Signaling Technology), BCL-2 (BD Biosciences), and anti-rabbit, anti-hamster, or anti-mouse horseradish peroxidase–conjugated secondary antibodies (Jackson Immunochemical).
Intracellular staining for hemoglobin-ε (anti–HBE-1; Proteintech) was performed, using bovine serum albumin block and 100% MeOH fixation. Anti–HBE-1 was detected using Donkey Anti-Rabbit IgG H&L (Alexa Fluor 488) (ThermoFisher). Anti-DNA stain (Draq5; BioLegend) was used according to the manufacturer’s instructions. Annexin V antibody (FITC or APC) was from BioLegend. Surface antibodies (available by request) were from BD Biosciences, eBioscience, and BioLegend. Flow cytometry was performed on an LSR II, LSRFortessa, or FACSCanto II (BD Biosciences) in the Flow Cytometry and Cell Sorting Shared Resource. Sorting was performed using FACSAria sorters (BD Biosciences). Data were analyzed using FlowJo v10 (FlowJo).
Statistical analyses were performed using GraphPad Prism v6.02 (GraphPad Software).
Results
MCL-1 is expressed early in erythropoiesis
To explore the expression of antiapoptotic family members during erythropoiesis, wild-type C57BL/6 E12.5 fetal livers were sorted into populations correlating with their differentiation stages.33 Analyses revealed a stepwise progression from S0 (primitive progenitors; TER119−, CD71−), to S1 (proerythroblasts; TER119−, CD71+), S2 (early basophilic erythroblasts; TER119low, CD71+), S3 (late basophilic erythroblasts; TER119high, CD71+), S4 (chromatophilic and early orthochromatophilic erythroblasts; TER119high, CD71low), and S5 (late orthochromatophilic erythroblasts and reticulocytes; TER119high, CD71−). Quantitative PCR of messenger RNA and immunoblot analyses of sorted populations revealed that S0 progenitors express low levels of the antiapoptotic family members MCL-1 and BCL-xL (Figure 1A-B). As the cells differentiated into S1/S2 progenitors, expression of MCL-1 increased at the messenger RNA and protein levels (Figure 1A-B). However, as differentiation continued beyond S1/S2, MCL-1 expression decreased, whereas BCL-xL expression increased (Figure 1A-B). Antiapoptotic BCL-2, BCL-W, or BFL-1 was undetectable at any stage of erythroid differentiation (Figure 1A-B). The proapoptotic effectors BAX and BAK were minimally expressed in S0 progenitors, but both effectors were induced with progression to S1/S2 and subsequently decreased as the progenitors continued to differentiate (Figure 1A-B). By the S4 stage, protein expression of all BCL-2 family members declined, consistent with the elimination of mitochondria during late erythropoiesis (Figure 1B).
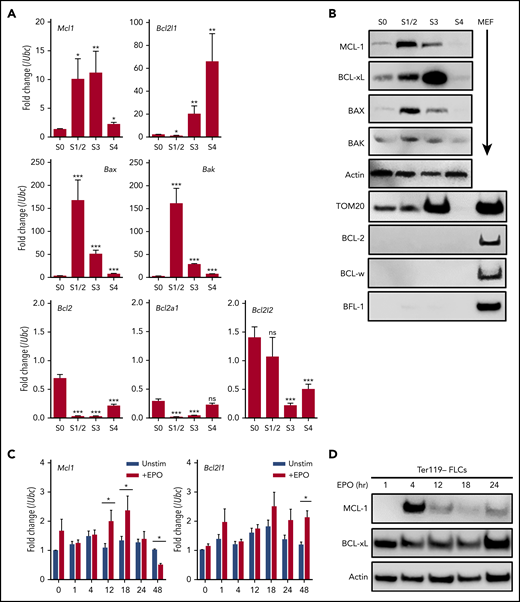
MCL-1 is expressed in early erythropoiesis. (A-B) Mouse fetal livers were isolated from E12.5 embryos and mechanically dissociated. Fetal liver cells were labeled with CD45, CD71, and TER119 antibodies. Following CD45− gating, cells were sorted 4 ways using a FACSAria; S1 and S2 were combined because of low cell number. (A) Quantitative PCR was performed on sorted populations for the indicated anti- or proapoptotic family members. Expression is represented as fold change relative to housekeeping gene (Ubc). n = 12 embryos from 3 litters, bars represent mean ± standard error of the mean. *P < .05, **P < .1, ***P < .01, vs S0 with α = 0.05, 1-way analysis of variance (ANOVA). (B) Cells were lysed in RIPA buffer containing phosphatase inhibitor cocktail and then immunoblot was performed on sorted cell populations. Wild-type murine embryonic fibroblast (MEF) lysates are included as positive control where indicated. (C-D) Fetal liver cells were isolated from E12.5 wild-type embryos; TER119− progenitor cells were purified using MACS MicroBeads and then cultured on fibronectin-coated plates for the indicated time points without (Unstim) or with 2 U/mL human EPO (+EPO). (C) Quantitative PCR was performed for the indicated anti- or proapoptotic family members. Expression is represented as fold change relative to housekeeping gene (Ubc); n = 12 embryos from 3 litters. *P < .05, 1-way ANOVA with α = 0.05, where indicated. (D) Immunoblot was performed to detect the indicated proteins. ns, not significant.
MCL-1 is expressed in early erythropoiesis. (A-B) Mouse fetal livers were isolated from E12.5 embryos and mechanically dissociated. Fetal liver cells were labeled with CD45, CD71, and TER119 antibodies. Following CD45− gating, cells were sorted 4 ways using a FACSAria; S1 and S2 were combined because of low cell number. (A) Quantitative PCR was performed on sorted populations for the indicated anti- or proapoptotic family members. Expression is represented as fold change relative to housekeeping gene (Ubc). n = 12 embryos from 3 litters, bars represent mean ± standard error of the mean. *P < .05, **P < .1, ***P < .01, vs S0 with α = 0.05, 1-way analysis of variance (ANOVA). (B) Cells were lysed in RIPA buffer containing phosphatase inhibitor cocktail and then immunoblot was performed on sorted cell populations. Wild-type murine embryonic fibroblast (MEF) lysates are included as positive control where indicated. (C-D) Fetal liver cells were isolated from E12.5 wild-type embryos; TER119− progenitor cells were purified using MACS MicroBeads and then cultured on fibronectin-coated plates for the indicated time points without (Unstim) or with 2 U/mL human EPO (+EPO). (C) Quantitative PCR was performed for the indicated anti- or proapoptotic family members. Expression is represented as fold change relative to housekeeping gene (Ubc); n = 12 embryos from 3 litters. *P < .05, 1-way ANOVA with α = 0.05, where indicated. (D) Immunoblot was performed to detect the indicated proteins. ns, not significant.
EPO can induce BCL-xL during erythroid differentiation.7 To determine whether the expression of MCL-1 can also be induced by EPO signaling, TER119-depleted fetal liver cells were stimulated, and expression was assessed. EPO triggered a rapid, but transient, induction of MCL-1 expression (Figure 1C-D). In support of previous observations, EPO stimulation induced BCL-xL expression more slowly, but its expression was maintained in the cultures (Figure 1C-D). These data indicate that MCL-1 and BCL-xL can respond to EPO signaling with different kinetics, with MCL-1 having a rapid, but transient, expression.
EpoR-Cre–mediated Mcl1 deletion results in failure of erythropoiesis
To determine whether MCL-1 was important during early erythropoiesis, Mcl1 conditional mice30 (Mcl1F/F) were bred to mice expressing the Cre-recombinase under control of the EpoR gene (EpoR-Cre).29 Expression of EpoR begins during the BFU-E stage, reaches its highest expression at the erythroid colony-forming unit stage, and then decreases.2,37 EpoR-Cre mice induce >90% recombination efficiency in the fetal liver, primarily in early erythroid progenitor cells.29,38 Intercrosses did not produce any Mcl1F/FEpoR-Cre+ mice, indicating that loss of Mcl1 in the erythroid lineage results in embryonic lethality (Tables 1 and 2). Notably, Mcl1F/wt EpoR-Cre+ mice were found at the expected frequency, demonstrating that deletion of a single allele of Mcl1 is tolerated.
Result of crosses between Mcl1F/F female mice and Mcl1F/wt; EpoR-Cre+ male mice at 3 weeks of age
| Genotype | Observed, n | Expected, n | Result |
|---|---|---|---|
| Mcl1F/F; EpoR-Cre+ | 0 | 40 | χ2 = 59.550 |
| Mcl1F/wt; EpoR-Cre+ | 49 | 40 | P < .0001 |
| Mcl1F/F; EpoR-Cre− | 66 | 40 | |
| Mcl1F/wt; EpoR-Cre− | 45 | 40 | |
| Total | 160 | 160 |
| Genotype | Observed, n | Expected, n | Result |
|---|---|---|---|
| Mcl1F/F; EpoR-Cre+ | 0 | 40 | χ2 = 59.550 |
| Mcl1F/wt; EpoR-Cre+ | 49 | 40 | P < .0001 |
| Mcl1F/F; EpoR-Cre− | 66 | 40 | |
| Mcl1F/wt; EpoR-Cre− | 45 | 40 | |
| Total | 160 | 160 |
Result of crosses between Mcl1F/wt; EpoR-Cre+ male and female mice at 3 weeks of age
| Genotype | Observed, n | Expected, n | Result |
|---|---|---|---|
| Mcl1F/F; EpoR-Cre+ | 0 | 20 | χ2 = 54.750 |
| Mcl1F/wt; EpoR-Cre+ | 40 | 40 | P < .0001 |
| Mcl1wt/wt; EpoR-Cre+ | 26 | 20 | |
| Mcl1F/F; EpoR-Cre− | 18 | 10 | |
| Mcl1F/wt; EpoR-Cre− | 25 | 10 | |
| Mcl1wt/wt; EpoR-Cre− | 11 | 20 | |
| Total | 120 | 120 |
To determine when Mcl1F/FEpoR-Cre+ mice were lost, embryos were obtained from timed pregnancies. Mcl1F/FEpoR-Cre+ embryos were observed at the expected ratios at E13.5 but were underrepresented beyond that point (Tables 3 and 4). Phenotypically, Mcl1F/FEpoR-Cre+ embryos at E12.5 and beyond were smaller and paler than littermate controls (Figure 2A). Pathologically, erythroid Mcl1–deleted fetal livers were smaller, exhibited ischemic necrosis, and lacked mature RBCs in the sinusoids (Figure 2Bi-ii). Additionally, apoptotic cells were evident in Mcl1F/FEpoR-Cre+ fetal livers compared with littermate controls (Figure 2Bii, arrowheads). Circulating RBCs were reduced in Mcl1F/FEpoR-Cre+ embryos and retained their nuclei, unlike those observed in control Mcl1F/wtEpoR-Cre+ embryos (Figure 2Biii). EpoR-Cre can induce genetic deletion as early as E8.5, at which point primitive erythropoiesis is occurring.39 Littermate control and Mcl1F/FEpoR-Cre+ E10.5 embryos exhibited vascularized yolk sacs (Figure 2A). Cytospins from E10.5 fetal livers from Mcl1F/wtEpoR-Cre+ and Mcl1F/FEpoR-Cre+ embryos revealed nucleated primitive erythrocytes, indicating that primitive erythropoiesis occurs, despite EpoR-Cre–mediated Mcl1 deletion (Figure 2C). Intracellular staining of E10.5 fetal liver cells revealed expression of fetal hemoglobin ε, indicative of primitive erythrocytes (Figure 2E, left panel).40 DNA analyses of E10.5 fetal livers from unsorted EpoR-Cre+ embryos showed evidence of Mcl1 deletion (Figure 2F). In contrast, cytospins from E13.5 fetal livers revealed that, unlike Mcl1F/wtEpoR-Cre+ embryos, which exhibit mature enucleated erythrocytes, the erythroid cells from Mcl1F/FEpoR-Cre+ fetal livers retained their nuclei (Figure 2C). Intracellular staining of E13.5 embryos revealed that Mcl1F/FEpoR-Cre+ fetal liver cells expressed fetal hemoglobin ε, in contrast to Mcl1F/wtEpoR-Cre+ embryos, indicating that these cells are residual primitive erythrocytes (Figure 2E, right panel). These data indicate that EpoR-Cre–mediated Mcl1 deletion does not overtly disrupt primitive erythropoiesis, but definitive erythropoiesis is substantially impaired.
Embryos obtained on E13.5 from timed matings of Mcl1F/F female mice with Mcl1F/wt; EpoR-Cre+ male mice
| Genotype | Observed, n | Expected, n | Result |
|---|---|---|---|
| Mcl1F/F; EpoR-Cre+ | 31 | 26 | χ2 = 3.618 |
| Mcl1F/wt; EpoR-Cre+ | 27 | 26 | P = .3061 |
| Mcl1F/F; EpoR-Cre− | 18 | 26 | |
| Mcl1F/wt; EpoR-Cre− | 28 | 26 | |
| Total | 104 | 104 |
| Genotype | Observed, n | Expected, n | Result |
|---|---|---|---|
| Mcl1F/F; EpoR-Cre+ | 31 | 26 | χ2 = 3.618 |
| Mcl1F/wt; EpoR-Cre+ | 27 | 26 | P = .3061 |
| Mcl1F/F; EpoR-Cre− | 18 | 26 | |
| Mcl1F/wt; EpoR-Cre− | 28 | 26 | |
| Total | 104 | 104 |
Embryos obtained on E13.5 from timed matings of Mcl1F/wt; EpoR-Cre+ male and female mice
| Genotype | Observed, n | Expected, n | Result |
|---|---|---|---|
| Mcl1F/F; EpoR-Cre+ | 4 | 4.75 | χ2 = 5.450 |
| Mcl1F/wt; EpoR-Cre+ | 15 | 9.5 | P = .3635 |
| Mcl1wt/wt; EpoR-Cre+ | 9 | 9.5 | |
| Mcl1F/F; EpoR-Cre− | 16 | 19 | |
| Mcl1F/wt; EpoR-Cre− | 4 | 4.75 | |
| Mcl1wt/wt; EpoR-Cre− | 6 | 9.5 | |
| Total | 57 | 57 |
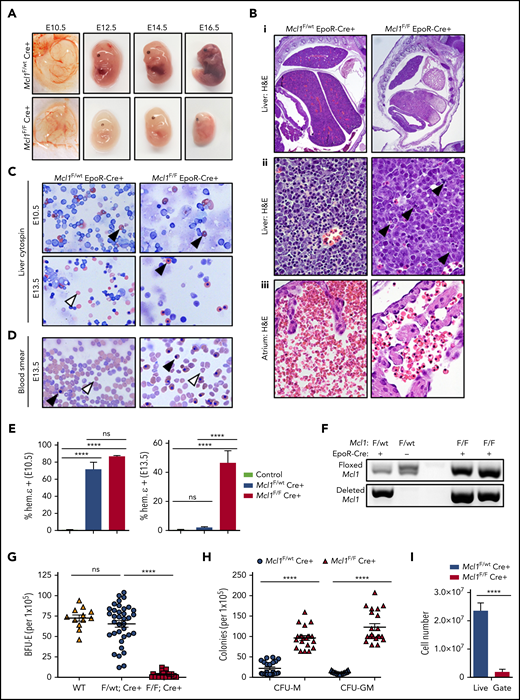
EpoR-Cre–mediated Mcl1 deletion leads to lethal failure of blood development. (A) Photographs of representative Mcl1F/F EpoR-Cre+ and Mcl1F/wt EpoR-Cre+ embryos at E10.5, E12.5, E14.5, and E16.5. (B) Representative images of hematoxylin and eosin (H&E)–stained sections from E12.5 embryos showing size and gross morphology of liver (original magnification ×2) (i), areas of apoptosis of liver (black arrowheads; original magnification ×60) (ii), and atrium of heart showing number and phenotype of RBCs (original magnification ×60) (iii). (C) Cytospin preparations from livers from E10.5 (upper panels) or E13.5 (lower panels) embryos (original magnification ×40, Wright-Giemsa stain). White arrowheads denote nonnucleated mature cells, and black arrowheads denote nucleated primitive cells. (D) Blood smears of whole blood from E13.5 embryos (original magnification ×40, Wright-Giemsa stain). White arrowheads denote nonnucleated mature cells, and black arrowheads denote nucleated primitive cells. (E) Intracellular staining of hemoglobin ε chain in E10.5 (left panel) or E13.5 (right panel) fetal livers. Control bar is isotype stain; n > 5 embryos per group. Bars represent mean ± standard error of the mean (SEM). ****P < .001, 1-way analysis of variance (ANOVA) with α = 0.05. (F) Genomic PCR for floxed or deleted allele of Mcl1 from E10.5 fetal liver cells. (G-H) Methylcellulose colony-forming assays were performed using total fetal liver cells and media as indicated; each point represents a plate (n > 12). Data are mean ± SEM. (G) Enumeration of BFU-Es grown on MethoCult GF M3434 (contains EPO). ****P < .001, 1-way ANOVA with α = 0.05. (H) Enumeration of granulocyte-macrophage progenitor cells (CFU-M and CFU-GM) grown on MethoCult GF M3534 (without EPO). ****P < .001, 1-way ANOVA with α = 0.05. (I) Enumeration of cells within the live gate by flow cytometry of fetal liver cells (n = 8-12 embryos from 4 litters). Data are mean ± SEM. ****P < .001, Student t test. ns, not significant; WT, wild-type.
EpoR-Cre–mediated Mcl1 deletion leads to lethal failure of blood development. (A) Photographs of representative Mcl1F/F EpoR-Cre+ and Mcl1F/wt EpoR-Cre+ embryos at E10.5, E12.5, E14.5, and E16.5. (B) Representative images of hematoxylin and eosin (H&E)–stained sections from E12.5 embryos showing size and gross morphology of liver (original magnification ×2) (i), areas of apoptosis of liver (black arrowheads; original magnification ×60) (ii), and atrium of heart showing number and phenotype of RBCs (original magnification ×60) (iii). (C) Cytospin preparations from livers from E10.5 (upper panels) or E13.5 (lower panels) embryos (original magnification ×40, Wright-Giemsa stain). White arrowheads denote nonnucleated mature cells, and black arrowheads denote nucleated primitive cells. (D) Blood smears of whole blood from E13.5 embryos (original magnification ×40, Wright-Giemsa stain). White arrowheads denote nonnucleated mature cells, and black arrowheads denote nucleated primitive cells. (E) Intracellular staining of hemoglobin ε chain in E10.5 (left panel) or E13.5 (right panel) fetal livers. Control bar is isotype stain; n > 5 embryos per group. Bars represent mean ± standard error of the mean (SEM). ****P < .001, 1-way analysis of variance (ANOVA) with α = 0.05. (F) Genomic PCR for floxed or deleted allele of Mcl1 from E10.5 fetal liver cells. (G-H) Methylcellulose colony-forming assays were performed using total fetal liver cells and media as indicated; each point represents a plate (n > 12). Data are mean ± SEM. (G) Enumeration of BFU-Es grown on MethoCult GF M3434 (contains EPO). ****P < .001, 1-way ANOVA with α = 0.05. (H) Enumeration of granulocyte-macrophage progenitor cells (CFU-M and CFU-GM) grown on MethoCult GF M3534 (without EPO). ****P < .001, 1-way ANOVA with α = 0.05. (I) Enumeration of cells within the live gate by flow cytometry of fetal liver cells (n = 8-12 embryos from 4 litters). Data are mean ± SEM. ****P < .001, Student t test. ns, not significant; WT, wild-type.
To examine the effects of EpoR-Cre–mediated loss of Mcl1 on erythropoiesis, as well as on other hematopoietic lineages, fetal liver cells were cultured in methylcellulose containing hematopoietic growth factors to assess colony formation.33,41 Fetal liver cells from Mcl1F/FEpoR-Cre+ embryos failed to produce BFU-Es, whereas mice lacking 1 allele of Mcl1 formed similar numbers of BFU-Es as wild-type animals when cultured in EPO (Figure 2G). The inability to give rise to BFU-Es was not reflective of a general inability to produce hematopoietic colonies, because Mcl1F/FEpoR-Cre+ fetal liver cells formed monocyte colony-forming units (CFU-Ms) and mixed granulocyte/macrophage colony-forming units (CFU-GMs) (Figure 2H). These data indicate that fetal livers from Mcl1F/FEpoR-Cre+ embryos are defective in definitive erythropoiesis but are capable of forming nonerythroid hematopoietic colonies.
EpoR-Cre–mediated Mcl1 deletion does not perturb hematopoietic progenitors
Although the EpoR-Cre expressing mouse has been commonly used to assess erythropoiesis, it has been reported that EpoR-Cre expression can occur even earlier in early hematopoietic progenitors.42 Because MCL-1 is essential for promoting survival during early hematopoiesis,21 we wanted to confirm that the loss of erythropoiesis was not due to earlier deletion in hematopoietic progenitors. Although the cellularity and number of erythroid progenitors of Mcl1F/FEpoR-Cre+ fetal livers were reduced in comparison with littermate controls (Figure 2I; supplemental Figure 1A, available on the Blood Web site), the number of nonerythroid cells was similar in Mcl1F/FEpoR-Cre+ embryos compared with Mcl1F/wtEpoR-Cre+ littermate controls (supplemental Figure 1B). When hematopoietic progenitor numbers were compared directly, numbers were similar in the Mcl1F/FEpoR-Cre+ fetal liver compared with controls, and the percentages were not significantly altered (supplemental Figure 1C-D). Further analysis confirmed the comparable numbers of downstream hematopoietic lineages from Mcl1F/FEpoR-Cre+ and Mcl1F/wtEpoR-Cre+ embryos (supplemental Figure 1E-F). These data indicate that the loss of definitive erythropoiesis in Mcl1F/FEpoR-Cre+ embryos is not due to an earlier hematopoietic defect but is caused by Mcl1 deletion during erythropoiesis.
MCL-1 loss arrests development beyond early basophilic erythroblasts
To determine when during erythropoiesis EpoR-Cre–mediated Mcl1 deletion affects development, flow cytometry was used to evaluate fetal livers from timed pregnancies.33 Analysis of control Mcl1F/wtEpoR-Cre+ fetal livers revealed a progression from S0 (primitive progenitors) to S5 (late orthochromatophilic erythroblasts and reticulocytes) over 4 days of fetal liver development (from E11.5 to E15.5) (Figure 3A). Conversely, in Mcl1F/FEpoR-Cre+ fetal livers, most cells were restricted to the S0 and S1 populations. Few Mcl1F/FEpoR-Cre+ fetal liver cells progressed beyond the S1 (proerythroblast) stage, even when harvested as late as E15.5 (Figure 3A). Furthermore, unlike Mcl1F/wtEpoR-Cre+, which exhibited increased fetal liver cellularity as development progressed through the S3 (late basophilic erythroblasts) and S4 (chromatophilic and early orthochromatophilic erythroblasts) stages, the numbers of Mcl1F/FEpoR-Cre+ fetal liver erythroid progenitors were reduced (Figure 3B). The reduction in cellularity was due, in part, to increased apoptotic (Annexin V+) erythroid progenitors in the Mcl1F/FEpoR-Cre+ fetal livers, whereas deletion of only a single allele of Mcl1 did not increase apoptotic cells (Figure 3C).
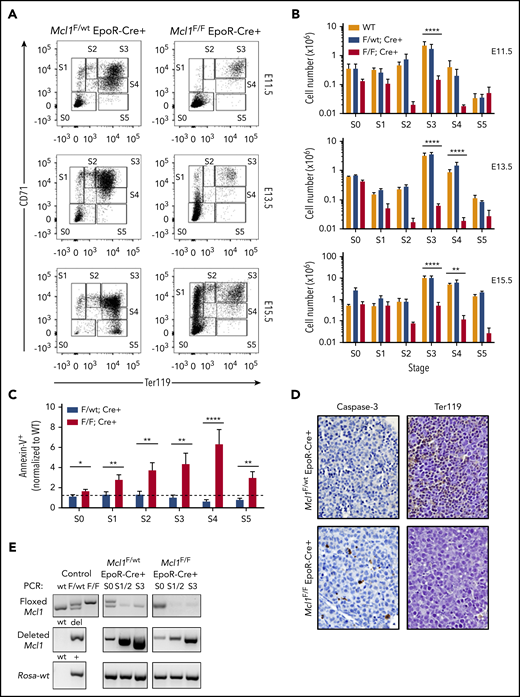
EpoR-Cre–mediated deletion of Mcl1 leads to blockade early in erythrocyte development. (A-C) Mouse fetal liver cells were isolated from Mcl1F/F EpoR-Cre+ or Mcl1F/wt EpoR-Cre+ embryos on the indicated day, labeled with CD45, CD71, TER119, or Annexin V antibodies, and analyzed by flow cytometry. (A) CD45− cells representing E11.5 (top panels), E13.5 (middle panels), and E15.5 (bottom panels) embryos. (B) Absolute cell numbers in each differentiation stage, as represented in (A). E11.5 (top panels), E13.5 (middle panels), and E15.5 (bottom panels) are shown (n ≥ 5 biological replicates with 4 embryos each). Data are mean ± standard error of the mean (SEM). **P < .1, ***P < .01, ****P < .001, 1-way analysis of variance with α = 0.05. (C) Annexin V+ (dead) cells in E13.5 Mcl1F/F EpoR-Cre+ or Mcl1F/wt EpoR-Cre+ fetal livers. Graph represents percentage relative to wild-type control (n > 13 embryos from 5 litters. *P < .5, **P < .01, ****P < .001, Student t test. Dashed line denotes fold change of 1. (D) Liver sections from representative embryos subjected to immunohistochemical staining for caspase-3 (left panels) and a glycophorin A–associated protein (TER119; right panel) (original magnification ×60). See "Materials and methods" for further details. (E) DNA from fetal liver cells isolated from Mcl1F/F EpoR-Cre+ or Mcl1F/wt EpoR-Cre+ embryos were analyzed by PCR. “Control” indicates PCR control and represents the expected banding pattern.
EpoR-Cre–mediated deletion of Mcl1 leads to blockade early in erythrocyte development. (A-C) Mouse fetal liver cells were isolated from Mcl1F/F EpoR-Cre+ or Mcl1F/wt EpoR-Cre+ embryos on the indicated day, labeled with CD45, CD71, TER119, or Annexin V antibodies, and analyzed by flow cytometry. (A) CD45− cells representing E11.5 (top panels), E13.5 (middle panels), and E15.5 (bottom panels) embryos. (B) Absolute cell numbers in each differentiation stage, as represented in (A). E11.5 (top panels), E13.5 (middle panels), and E15.5 (bottom panels) are shown (n ≥ 5 biological replicates with 4 embryos each). Data are mean ± standard error of the mean (SEM). **P < .1, ***P < .01, ****P < .001, 1-way analysis of variance with α = 0.05. (C) Annexin V+ (dead) cells in E13.5 Mcl1F/F EpoR-Cre+ or Mcl1F/wt EpoR-Cre+ fetal livers. Graph represents percentage relative to wild-type control (n > 13 embryos from 5 litters. *P < .5, **P < .01, ****P < .001, Student t test. Dashed line denotes fold change of 1. (D) Liver sections from representative embryos subjected to immunohistochemical staining for caspase-3 (left panels) and a glycophorin A–associated protein (TER119; right panel) (original magnification ×60). See "Materials and methods" for further details. (E) DNA from fetal liver cells isolated from Mcl1F/F EpoR-Cre+ or Mcl1F/wt EpoR-Cre+ embryos were analyzed by PCR. “Control” indicates PCR control and represents the expected banding pattern.
Immunohistochemistry of E12.5 Mcl1F/FEpoR-Cre+ fetal livers revealed fewer TER119-expressing cells compared with littermate control Mcl1F/wtEpoR-Cre+ fetal liver sections (Figure 3D).43 Furthermore, more cells stained for activated caspase-3 in Mcl1F/FEpoR-Cre+ fetal livers than in control fetal livers (Figure 3D). Fewer TER119+ cells and more abundant expression of activated caspase-3 indicate a defect in erythroid differentiation that is likely due to increased apoptosis.44
To assess when EpoR-Cre was inducing recombination, we performed PCR on DNA from flow-sorted erythroid progenitors. In Mcl1F/wtEpoR-Cre+ and Mcl1F/FEpoR-Cre+ fetal livers, there was evidence of recombined Mcl1 as early as the S0 stage of erythropoiesis, but the unrecombined floxed Mcl1 genomic allele was absent by the S1/S2 stages, indicating efficient deletion (Figure 3E). These data indicate that EpoR-Cre deletion is initiated by the S0 stage but was most efficient at mediating recombination of Mcl1 at the S1/S2 stages of differentiation.
MCL-1 promotes early erythropoiesis but is dispensable during later stages
Mcl1F/FEpoR-Cre+ fetal livers indicate that MCL-1 is required during the early stages of erythroid differentiation; however, these experiments are unable to assess whether MCL-1 plays similar critical roles later in erythroid differentiation. To control the timing of Mcl1 deletion, we used fetal livers from Mcl1F/FRosa-ERCreT2 mice, to which 4-OHT can be added to the cultures to induce recombination at specified times.19 TER119-depleted E12.5 fetal liver cells isolated from Mcl1F/FRosa-ERCreT2+ or Mcl1F/wtRosa-ERCreT2+ littermates were incubated for 18 hours in SCF media, which contains SCF, IL-6, and FLT-3L to maintain progenitors, after which they were washed and replated in EPO media containing EPO to promote erythroid differentiation.33,34
To induce Mcl1 deletion at the earliest stages of erythropoiesis, 4-OHT was added immediately with SCF media to induce recombination early during culture (time [T] = 0). In contrast, to assess MCL-1’s function at later stages of erythropoiesis, Mcl1 deletion was induced by adding 4-OHT after 24 hours in culture, when the cells have been switched into EPO media and were already in the process of erythroid differentiation (T = 24) (Figure 4A). Addition of 4-OHT to Mcl1F/wtRosa-ERCreT2+ cultures at T = 0 or T = 24 did not alter erythroid development (supplemental Figure 2B-C). PCR showed floxed Mcl1 deletion at both time points (Figure 4B), whereas immunoblotting showed a clear decrease in MCL-1 protein in Mcl1F/FRosa-ERCreT2+ cells following 4-OHT treatment (Figure 4C). Untreated Mcl1F/FRosa-ERCreT2+ and Mcl1F/wtRosa-ERCreT2+ littermate control fetal liver cells were able to differentiate efficiently, as assessed by CD71 and TER119 staining, and they underwent enucleation, as assessed by anti-DNA staining (Figure 4D, bottom panels; supplemental Figure 2A,D,G). Early addition of 4-OHT to Mcl1F/FRosa-ERCreT2+ fetal liver cells (T = 0) resulted in >50% of cells failing to progress beyond the S0 stage, and those residual cells still contained nuclear DNA (Figure 4D, top panels; supplemental Figure 2B,E,G); however, later addition of 4-OHT (T = 24) did not alter erythropoiesis relative to the untreated condition, and the cells were able to eliminate their nuclear DNA (Figure 4D, middle panels; supplemental Figure 2C,F-G). Cytospins revealed that Mcl1F/wtRosa-ERCreT2+ cells were able to differentiate regardless of when 4-OHT is added, indicating that deletion of a single Mcl1 allele was not deleterious (Figure 4E). In contrast, Mcl1F/FRosa-ERCreT2+ cells treated with 4-OHT at T = 0 generated mostly debris, whereas the same cells treated with 4-OHT at T = 24 differentiated normally and produced enucleated erythrocytes (Figure 4E; supplemental Figure 2F). Annexin V staining indicated that >80% of Mcl1F/FRosa-ERCreT2+ fetal liver cells treated with 4-OHT at T = 0 were apoptotic, suggesting that MCL-1 is needed to promote survival (Figure 4F).
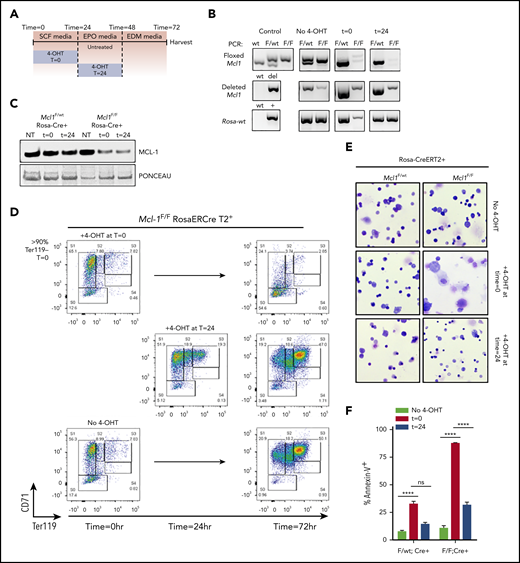
Ex vivo culture system allows temporally controlled deletion of Mcl1 from erythroid cultures. Fetal liver cells were isolated from E12.5 Mcl1F/F Rosa-ERCreT2+ or Mcl1F/wt Rosa-ERCreT2+ embryos; TER119− progenitor cells were purified using MACS MicroBeads and then cultured on fibronectin-coated plates. To induce Mcl1 deletion, fetal liver cells were treated with 4-OHT during the first 18 hours/overnight of culture (t = 0) or overnight the second day of culture (t = 24). Controls did not receive 4-OHT (No 4-OHT). (A) Diagram showing conditions and the time at which 4-OHT was added. (B) Cells were cultured as indicated and then harvested and analyzed by PCR. “Control” indicates PCR control and represents the expected banding pattern; No 4-OHT represents experimental control and represents nondeleted cells. (C) Immunoblot of MCL-1 levels in in vitro–differentiated cells treated with 4-OHT, as indicated. Ponceau S staining was used to indicate loading. (D) Representative flow cytometric analysis of CD45− in vitro–differentiated Mcl1F/F Rosa-ERCreT2+ fetal liver cells. (E) Cytospin preparations from Mcl1F/wt Rosa-ERCreT2+ or Mcl1F/F Rosa-ERCreT2+ fetal liver cells treated with 4-OHT overnight the second day of culture (original magnification ×40, Wright-Giemsa stain). (F) Cells were differentiated as indicated, harvested, and labeled with CD45, CD71, TER119, and Annexin V antibodies. Graph shows the percentage of Annexin V− (live) cells (n > 6 embryos from 2 biological replicates). Data are mean ± standard error of the mean. ****P < .001, 1-way analysis of variance, with α = 0.05. ns, not significant; NT, no treatment.
Ex vivo culture system allows temporally controlled deletion of Mcl1 from erythroid cultures. Fetal liver cells were isolated from E12.5 Mcl1F/F Rosa-ERCreT2+ or Mcl1F/wt Rosa-ERCreT2+ embryos; TER119− progenitor cells were purified using MACS MicroBeads and then cultured on fibronectin-coated plates. To induce Mcl1 deletion, fetal liver cells were treated with 4-OHT during the first 18 hours/overnight of culture (t = 0) or overnight the second day of culture (t = 24). Controls did not receive 4-OHT (No 4-OHT). (A) Diagram showing conditions and the time at which 4-OHT was added. (B) Cells were cultured as indicated and then harvested and analyzed by PCR. “Control” indicates PCR control and represents the expected banding pattern; No 4-OHT represents experimental control and represents nondeleted cells. (C) Immunoblot of MCL-1 levels in in vitro–differentiated cells treated with 4-OHT, as indicated. Ponceau S staining was used to indicate loading. (D) Representative flow cytometric analysis of CD45− in vitro–differentiated Mcl1F/F Rosa-ERCreT2+ fetal liver cells. (E) Cytospin preparations from Mcl1F/wt Rosa-ERCreT2+ or Mcl1F/F Rosa-ERCreT2+ fetal liver cells treated with 4-OHT overnight the second day of culture (original magnification ×40, Wright-Giemsa stain). (F) Cells were differentiated as indicated, harvested, and labeled with CD45, CD71, TER119, and Annexin V antibodies. Graph shows the percentage of Annexin V− (live) cells (n > 6 embryos from 2 biological replicates). Data are mean ± standard error of the mean. ****P < .001, 1-way analysis of variance, with α = 0.05. ns, not significant; NT, no treatment.
Removal of apoptosis rescues Mcl1 deficiency in a transplant model
To investigate whether Mcl1 exerts its critical function by inhibiting apoptosis, we sought to delete Mcl1 along with the proapoptotic effector molecules Bax and Bak. Cells lacking Bax and Bak are unable to undergo canonical apoptosis45 ; therefore, we hypothesized that removal of Mcl1 on this background should rescue erythropoiesis if MCL-1’s critical function is to restrain apoptosis. Irradiated CD45.1+ recipient animals were transplanted with whole BM from the donor groups shown in Figure 5A. After engraftment, tamoxifen was administered to induce deletion of Mcl1F/FRosa-ERCreT2+, BaxF/FBak−/−Rosa-ERCreT2+, or Mcl1F/FBaxF/FBak−/−Rosa-ERCreT2+ donor BM, whereas control (nondeleted) mice received only vehicle (Figure 5A). Complete blood counts and flow cytometry were conducted every 2 weeks after treatment. These analyses revealed that total BM cellularity and RBC, lymphocyte, and neutrophil populations were not affected by tamoxifen-mediated deletion across all cohorts, with the exception of tamoxifen-treated Mcl1F/FRosa-ERCreT2 recipients (supplemental Figure 3A-C). In contrast, all tamoxifen-treated recipients bearing Mcl1F/FRosa-ERCreT2 BM died or became moribund within 14 days of tamoxifen treatment as a result of BM failure similar to that reported previously46 ; only residual recipient-derived CD45.1+ cells remained in their BM at harvest (Figure 5B; supplemental Figure 3A-E). Therefore, these animals were unable to be used for ex vivo erythroid differentiation.
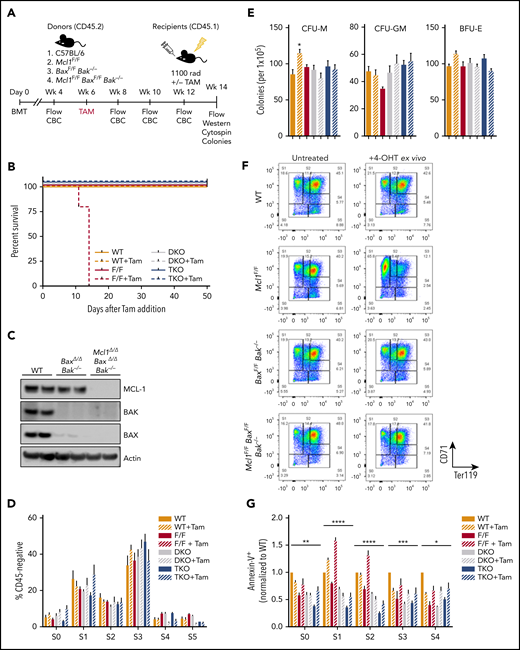
Removal of apoptosis rescues erythropoiesis defect caused by deletion of Mcl1. (A) Schematic diagram of transplant studies indicating lethally irradiated CD45.1+ recipients and 4 groups of CD45.2+ donors: C57BL/6 wild-type, Mcl1F/F Rosa-ERCreT2, BaxF/FBak−/−Rosa-ERCreT2, and Mcl1F/FBaxF/FBak−/− Rosa-ERCreT2 (n = 5-11 recipients per donor group; see "Materials and methods"). These 4 groups were further subdivided into untreated or tamoxifen treated, for a total of 8 treatment groups. (B) Kaplan-Meyer survival plot of recipient animals following tamoxifen treatment. (C) Immunoblot of recipient spleens (2 lanes each) following BM transplant and tamoxifen-mediated deletion of floxed alleles. (D) BM from vehicle or tamoxifen-treated recipients was differentiated into erythroblasts on fibronectin-coated plates in EPO-containing media. Cells were labeled with CD45, CD71, and TER119 and then analyzed by flow cytometry; CD45− fraction is shown divided into developmental stages S0 through S5. Bars represent mean ± standard error of the mean (SEM). One-way analysis of variance (ANOVA) with α = 0.05 was used to compare each group vs wild-type (WT). (E) Methylcellulose colony-forming assays were performed using recipient total BM; BFU-Es were grown on MethoCult GF M3434 (contains EPO), whereas CFU-Ms and CFU-GMs were grown on MethoCult GF M3534 (without EPO). (F-G) Recipient BM was harvested and differentiated into erythroblasts on fibronectin-coated plates as in Figure 4. (F) BM from mice that did not receive tamoxifen during the transplant study was differentiated with or without 4-OHT, as indicated. Cells were labeled with CD45, CD71, and TER119 and then analyzed by flow cytometry; representative plots of the CD45− fraction are shown. (G) Ex vivo–differentiated BM was labeled with CD45, CD71, TER119, and Annexin V antibodies and analyzed by developmental stage (n = 5-11 recipient animals per donor group). Data are mean ± SEM. *P < .05, **P < .1, ***P < .01, ****P < .001, 2-way ANOVA with α = 0.05. DKO, double knockout; F/F, Mcl1F/F; Tam, tamoxifen; TKO, triple knockout; WT, wild-type.
Removal of apoptosis rescues erythropoiesis defect caused by deletion of Mcl1. (A) Schematic diagram of transplant studies indicating lethally irradiated CD45.1+ recipients and 4 groups of CD45.2+ donors: C57BL/6 wild-type, Mcl1F/F Rosa-ERCreT2, BaxF/FBak−/−Rosa-ERCreT2, and Mcl1F/FBaxF/FBak−/− Rosa-ERCreT2 (n = 5-11 recipients per donor group; see "Materials and methods"). These 4 groups were further subdivided into untreated or tamoxifen treated, for a total of 8 treatment groups. (B) Kaplan-Meyer survival plot of recipient animals following tamoxifen treatment. (C) Immunoblot of recipient spleens (2 lanes each) following BM transplant and tamoxifen-mediated deletion of floxed alleles. (D) BM from vehicle or tamoxifen-treated recipients was differentiated into erythroblasts on fibronectin-coated plates in EPO-containing media. Cells were labeled with CD45, CD71, and TER119 and then analyzed by flow cytometry; CD45− fraction is shown divided into developmental stages S0 through S5. Bars represent mean ± standard error of the mean (SEM). One-way analysis of variance (ANOVA) with α = 0.05 was used to compare each group vs wild-type (WT). (E) Methylcellulose colony-forming assays were performed using recipient total BM; BFU-Es were grown on MethoCult GF M3434 (contains EPO), whereas CFU-Ms and CFU-GMs were grown on MethoCult GF M3534 (without EPO). (F-G) Recipient BM was harvested and differentiated into erythroblasts on fibronectin-coated plates as in Figure 4. (F) BM from mice that did not receive tamoxifen during the transplant study was differentiated with or without 4-OHT, as indicated. Cells were labeled with CD45, CD71, and TER119 and then analyzed by flow cytometry; representative plots of the CD45− fraction are shown. (G) Ex vivo–differentiated BM was labeled with CD45, CD71, TER119, and Annexin V antibodies and analyzed by developmental stage (n = 5-11 recipient animals per donor group). Data are mean ± SEM. *P < .05, **P < .1, ***P < .01, ****P < .001, 2-way ANOVA with α = 0.05. DKO, double knockout; F/F, Mcl1F/F; Tam, tamoxifen; TKO, triple knockout; WT, wild-type.
Six weeks after tamoxifen administration, hematopoietic tissues from surviving animals were examined. Mice receiving wild-type marrow showed robust expression of MCL-1, BAX, and BAK, whereas tamoxifen-treated recipients receiving BaxF/FBak−/−Rosa-ERCreT2 marrow maintained expression of MCL-1, and tamoxifen-treated mice receiving Mcl1F/FBaxF/FBak−/−Rosa-ERCreT2 marrow were devoid of BAX, BAK, and MCL-1 expression, indicating effective transplant and tamoxifen-mediated deletion (Figure 5C). When BM from vehicle- or tamoxifen-treated recipients was cultured on fibronectin in EPO-containing media, efficient erythroid differentiation was observed, as assessed by expression of CD71 and Ter119 in the CD45− population in all genotypes and treatment groups (Figure 5D). Further, colony-forming assays of BM on growth factor–containing methylcellulose demonstrated that Bax and Bak deficiency does not compromise colony formation, because wild-type, control (nondeleted), and BaxΔ/ΔBak−/−Rosa-ERCreT2 BM efficiently differentiated into BFU-E, CFU-M, and CFU-GM (Figure 5E). Similarly, Mcl1Δ/ΔBaxΔ/ΔBak−/−Rosa-ERCreT2 cells also generated BFU-E when cultured in EPO-containing methylcellulose and differentiated into CFU-M and CFU-GM (Figure 5E). These data indicate that deletion of Bax and Bak rescued erythroid differentiation in the absence of Mcl1, without any deleterious effects on myeloid differentiation.
To further confirm the requirement for MCL-1’s antiapoptotic effects during erythropoiesis, we isolated BM from recipient mice transplanted with wild-type, Mcl1F/FRosa-ERCreT2+, BaxF/FBak−/−Rosa-ERCreT2+, or Mcl1F/FBaxF/FBak−/−Rosa-ERCreT2+ BM, which were not treated with tamoxifen, for ex vivo differentiation cultures (as described for fetal liver). The ex vivo BM was lineage depleted and cultured on fibronectin-coated plates in EPO-containing media, with or without the addition of 4-OHT, as indicated to active Cre-recombinase. Donor marrow samples from each untreated genotype were able to efficiently differentiate into erythroid cells, as indicated by loss of CD45 and expression of erythroid markers (Figure 5F). When 4-OHT was added during differentiation to induce deletion of Mcl1 and/or Bax, we observed a similar block of Mcl1Δ/ΔRosa-ERCreT2 RBCs in S1, whereas wild-type, BaxΔ/ΔBak−/−, and Mcl1Δ/ΔBaxΔ/ΔBak−/−Rosa-ERCreT2 cells differentiated efficiently following 4-OHT treatment (Figure 5F). Cytospins confirmed the presence of mature enucleated erythrocytes in cultures derived from all tested genetic backgrounds, with the exception of 4-OHT–treated Mcl1F/FRosa-ERCreT2 BM (supplemental Figure 3F). Finally, the ex vivo–differentiated BM was stained with Annexin V; as expected, BaxΔ/ΔBak−/−Rosa-ERCreT2 BM exhibited a lower frequency of apoptotic cells relative to wild-type controls (Figure 5G). Further, Mcl1Δ/ΔBaxΔ/ΔBak−/−Rosa-ERCreT2 cells displayed decreased apoptosis at all stages of erythroid development compared with their wild-type counterparts, whereas Mcl1Δ/ΔRosa-ERCreT2 cells exhibited significantly increased apoptosis in S1/S2 (Figure 5G). These data confirm that hematopoiesis can occur normally, despite the loss of MCL-1, if the canonical apoptotic mediators BAX and BAK are ablated; taken together, these data suggest that the critical function of MCL-1 is to protect early-stage erythrocytes from apoptosis.
Ectopic BCL2 expression rescues Mcl1 deficiency in an ex vivo differentiation model
It is still unclear whether MCL-1 is essential during early erythropoiesis simply because it is expressed early prior to the induction of other antiapoptotic regulators, like BCL-xL (Figure 1B). Alternatively, MCL-1 may play a critical function in promoting survival that cannot be compensated for by other antiapoptotic molecules. To differentiate between these hypotheses, we tested whether the ectopic expression of human BCL2 could compensate for Mcl1 deletion during ex vivo erythroid culture. TER119-depleted fetal liver cells from E12.5 Mcl1F/FRosa-ERCreT2+ or Mcl1F/wtRosa-ERCreT2+ littermate controls were infected with lentivirus containing human cDNAs encoding BCL2, MCL1, or negative control EGFP in the presence of SCF, IL-6, and FLT-3L to maintain stemness. During this time, 4-OHT was added to induce Mcl1 deletion. After 16 hours, the media were replaced with EPO-containing media to induce the erythroid-differentiation program.
Because the lentiviral vectors coexpressed ZsGreen, flow cytometry was performed within 24 hours after transduction to assess its efficiency (Figure 6A-B; supplemental Figure 4C). Successful transduction was confirmed by amplification of the human cDNAs encoded for by each lentivirus from cultured erythrocytes, as well as the efficiency of Mcl1 deletion (Figure 6C). Immunoblotting confirmed expression of full-length human proteins from transduction using the same viruses in the murine 3T3 cell line (supplemental Figure 4A). Nondeleted fetal liver cells generated erythroid cells, regardless of whether they expressed BCL2 or MCL1, indicating that ectopic expression did not hamper erythroid differentiation (Figure 6D).

Lentivirus-mediated expression of human BCL-2 can rescue loss of MCL-1 in early erythropoiesis. TER119-depleted fetal liver cells from E12.5 Mcl1F/F Rosa-ERCreT2+ or Mcl1F/wt Rosa-ERCreT2+ littermate controls were infected with zsGreen-tagged lentivirus encoding human cDNAs (BCL2, MCL1) or EGFP for 16 hours. Cultures were pulsed with 4-OHT for the next 16 hours and then media were changed to EPO-containing media to support erythroid differentiation. (A-B) Flow cytometric analysis of viral vector expression in fetal liver cells; UTC, untransduced control cells. (A) Percentage of zsGreen+ cells in the singlet gate. (B) Mean fluorescence intensity (MFI) of zsGreen signal (n ≥ 3 biological replicates with 3 embryos each). Data are mean ± standard error of the mean (SEM). *P < .5, **P < .01, ***P < .01, ****P < .001, 1-way analysis of variance (ANOVA) with α = 0.05. (C) Fetal liver cells were infected with the indicated virus, pulsed with 4-OHT as indicated, harvested, and analyzed by PCR. Top row is floxed Mcl1. Second row is deleted Mcl1, where the presence of band indicates deletion. Third row is the human lentivirus insert encoding MCL1. Fourth row is the human lentivirus insert encoding BCL2. (D-E) Counts of lentivirus-infected cells following erythroid-differentiation protocol. Cells were left untreated (D) or pulsed with 4-OHT (E), harvested, and counted. Counts are represented as fold change relative to empty vector (n ≥ 3 biological replicates with 3 embryos each). Data are mean ± SEM. ****P < .001, 1-way ANOVA with α = 0.05. (F-H) Cells infected with the indicated viruses were differentiated, harvested, and analyzed by flow cytometry. CD45− cells falling into the live gate were analyzed by expression of CD71 and TER119. (F) Representative plots of empty vector–expressing cells left untreated (upper right panel) or pulsed with 4-OHT (lower right panel); graph shows cumulative differentiation stage data. MCL1-expressing (G) and BCL2-expressing (H) cells (n ≥ 3 biological replicates with 3 embryos each), Data are mean ± SEM. F/wt, Mcl1F/wt; F/F, Mcl1F/F; LV, lentivirus; Tam, tamoxifen.
Lentivirus-mediated expression of human BCL-2 can rescue loss of MCL-1 in early erythropoiesis. TER119-depleted fetal liver cells from E12.5 Mcl1F/F Rosa-ERCreT2+ or Mcl1F/wt Rosa-ERCreT2+ littermate controls were infected with zsGreen-tagged lentivirus encoding human cDNAs (BCL2, MCL1) or EGFP for 16 hours. Cultures were pulsed with 4-OHT for the next 16 hours and then media were changed to EPO-containing media to support erythroid differentiation. (A-B) Flow cytometric analysis of viral vector expression in fetal liver cells; UTC, untransduced control cells. (A) Percentage of zsGreen+ cells in the singlet gate. (B) Mean fluorescence intensity (MFI) of zsGreen signal (n ≥ 3 biological replicates with 3 embryos each). Data are mean ± standard error of the mean (SEM). *P < .5, **P < .01, ***P < .01, ****P < .001, 1-way analysis of variance (ANOVA) with α = 0.05. (C) Fetal liver cells were infected with the indicated virus, pulsed with 4-OHT as indicated, harvested, and analyzed by PCR. Top row is floxed Mcl1. Second row is deleted Mcl1, where the presence of band indicates deletion. Third row is the human lentivirus insert encoding MCL1. Fourth row is the human lentivirus insert encoding BCL2. (D-E) Counts of lentivirus-infected cells following erythroid-differentiation protocol. Cells were left untreated (D) or pulsed with 4-OHT (E), harvested, and counted. Counts are represented as fold change relative to empty vector (n ≥ 3 biological replicates with 3 embryos each). Data are mean ± SEM. ****P < .001, 1-way ANOVA with α = 0.05. (F-H) Cells infected with the indicated viruses were differentiated, harvested, and analyzed by flow cytometry. CD45− cells falling into the live gate were analyzed by expression of CD71 and TER119. (F) Representative plots of empty vector–expressing cells left untreated (upper right panel) or pulsed with 4-OHT (lower right panel); graph shows cumulative differentiation stage data. MCL1-expressing (G) and BCL2-expressing (H) cells (n ≥ 3 biological replicates with 3 embryos each), Data are mean ± SEM. F/wt, Mcl1F/wt; F/F, Mcl1F/F; LV, lentivirus; Tam, tamoxifen.
To test whether other antiapoptotic molecules could compensate for Mcl1 deletion, experiments were performed with 4-OHT to assess whether erythroid progenitors expressing virally encoded cDNAs were able to undergo differentiation (Figure 6F-H). EGFP expression alone was unable to promote erythroid differentiation when Mcl1 was deleted; the cultures were stuck in S1, comparable to Mcl1F/FEpoR-Cre fetal liver cells (Figure 6E-F). In contrast, expression of ectopic MCL1 efficiently rescued erythroid differentiation in 4-OHT–treated cultures, indicating that human MCL-1 can compensate for deletion of endogenous Mcl1 (Figure 6E,G). Ectopic expression of BCL2 supported the expansion and differentiation of erythroid cells treated with 4-OHT (Figure 6E,H). Cytospins of reconstituted fetal liver cells treated with 4-OHT indicated that, although control (EGFP) expression did not rescue erythrocyte development, expression of human BCL-2 or MCL-1 resulted in efficient erythroid differentiation like that observed in cells without 4-OHT (supplemental Figure 4B). These data demonstrate that BCL2 can functionally compensate for Mcl1 deletion during erythroid differentiation, indicating that MCL-1 does not have a unique functional role in erythroid differentiation that cannot be provided by human BCL-2.
Discussion
BCL-xL promotes survival at the reticulocyte stage and has been linked to EPO signaling during erythroid development.8,17,19,47 Despite this knowledge, it remained unclear which factors were responsible for promoting survival during early erythroid development.48 We found that Mcl1-deletion during early erythropoiesis impairs survival beyond the S0/S1 stages and led to mid-gestational lethality by E13.5. Phenotypically, Mcl1-ablation looks similar to Epo- or EpoR-deficient mice.2 In contrast, deletion of Bcl2l1 (encodes BCL-xL) leads to defective erythroid differentiation later in development.17,18,47 While the EpoR-Cre model induces deletion as early as E10.5, we did not observe any overt defects in primitive erythropoiesis from Mcl1-deleted embryos. However, we cannot exclude the contribution of nondeleted cells to primitive erythropoiesis in these early embryos. These data indicate that MCL-1 plays a critical survival role during the early stages of definitive erythropoiesis, when EPO signaling promotes survival. Indeed, we found that EPO stimulation triggered a rapid, but transient, induction of MCL-1. In contrast, BCL-xL is induced more slowly, but is maintained longer, in cultured erythroid cells.7 These data indicate that MCL-1 is a downstream target of the EPO signaling pathway, but it is still unclear whether MCL-1 is a direct or indirect target.
We find that developing definitive erythrocytes switch their dependency on prosurvival BCL-2 family members. During early erythroid differentiation, endogenous MCL-1 provides an essential antiapoptotic function to promote cell survival, but it becomes dispensable as BCL-xL expression increases. These data correlate with our observations that, during the S1/S2 stages, MCL-1 expression increases; however, with subsequent differentiation, MCL-1 expression wanes and BCL-xL expression increases.7,8
It is still unclear why developing erythrocytes switch between MCL-1 and BCL-xL during development. MCL-1 and BCL-xL exhibit differences in their ability to antagonize individual proapoptotic BCL-2 family members.49 Although both prosurvival molecules can interact and antagonize proapoptotic BIM, PUMA, and BID, MCL-1 has specificity for NOXA, but not BAD. In contrast, BCL-xL can bind BAD, but not NOXA. Therefore, it is possible that MCL-1 is needed during early erythropoiesis to counter the effects of NOXA, making it unique among prosurvival molecules. Alternatively, MCL-1 and BCL-xL have been reported to preferentially inhibit the proapoptotic effector BAK,50 so perhaps it is the kinetics of expression that matters; MCL-1 may antagonize BAK in early erythrocytes, but as BCL-xL is induced it takes over at later stages. During hematopoiesis, the concomitant loss of PUMA provided hematopoietic stem cells with a significant, but transient, protection from acute deletion of Mcl1.46 Therefore, it is possible that MCL-1 is needed to counter PUMA induction during early erythropoiesis and, again, it is just the kinetics of expression that matter. In either case, ectopic BCL-2 overexpression supersedes the role for MCL-1 in early erythroid development, indicating that any selective role can be overcome by human BCL-2. We look forward to future studies designed to untangle which specific proapoptotic molecules are being activated during erythropoiesis to assess the overall contribution of BAX and/or BAK in regulating erythroid homeostasis.
MCL-1 is structurally distinct from other BCL-2 family members, possessing a predominantly unstructured amino terminus containing regulatory regions.51 It seemed possible that this region contributes to erythroid differentiation; however, ectopic expression of human BCL-2, which lacks the unstructured domain found in MCL-1, compensated for MCL-1 function during early erythropoiesis. Furthermore, Bax and Bak codeletion can also overcome the requirement for MCL-1 during early erythropoiesis. Together, these data suggest that MCL-1 and BCL-xL function primarily to prevent cell death during erythropoiesis, and any other functional contributions are dispensable. These data do not exclude the possibility that MCL-1 possesses additional unidentified functions in other cell types or plays less critical roles in homeostasis.
The finding that MCL-1 is required to protect early erythroid precursors adds to the variety of hematopoietic cell lineages that depend upon MCL-1.48 Although it is still unclear why MCL-1 plays such a broad role during hematopoiesis, 1 potential reason is that it undergoes rapid proteasome-mediated degradation.36,52,53 This triggers robust basal turnover in most cell types; however, posttranslational modifications, including phosphorylation and ubiquitinylation, can enhance MCL-1 protein stability or potentiate its turnover, making it an ideal regulator of survival, poised to respond rapidly to extracellular signaling.51,53-55 Our data indicate that MCL-1 responds to extracellular cues, such as EPO signaling, to promote survival. Future research will be necessary to better understand how EPO signaling affects MCL-1 expression and whether this occurs via transcriptional or posttranscriptional mechanisms. Our studies have revealed that MCL-1 is the critical antiapoptotic regulator during early erythroid development.
Data sharing requests should be sent to Joseph T. Opferman (joseph.opferman@stjude.org).
The online version of this article contains a data supplement.
The publication costs of this article were defrayed in part by page charge payment. Therefore, and solely to indicate this fact, this article is hereby marked “advertisement” in accordance with 18 USC section 1734.
Acknowledgments
The authors thank the members of the J.T.O. laboratory and M. Kundu (St Jude Children’s Research Hospital) for helpful discussions and providing EpoR-Cre mice. The authors also thank the St Jude Children’s Research Hospital Animal Resource Center, Veterinary Pathology Core, and Flow Cytometry and Cell Sorting Shared Resource for support of this project.
This work was supported by National Institutes of Health grants from the National Heart, Lung, and Blood Institute (R01HL123543; J.T.O.) and the National Cancer Institute (R01CA201069; J.T.O.), Cancer Center Support Grant P30CA021765, and the American Lebanese Syrian Associated Charities of St Jude.
Authorship
Contribution: J.T.O., P.A.N., and M.E.T. conceived the study, designed experiments, and wrote the manuscript; M.E.T., E.K., K.H.S., and B.J.K. performed experiments, analyzed data, and prepared figures; R.A.A. and J.D.L. provided flow cytometry expertise and analysis; P.V. performed pathology imaging and analyses; and J.T.O. supervised the project.
Conflict-of-interest disclosure: The authors declare no competing financial interests.
Correspondence: Joseph T. Opferman, St Jude Children’s Research Hospital, 262 Danny Thomas Pl, MS 340, Memphis, TN 38105-3678; e-mail: joseph.opferman@stjude.org.

This feature is available to Subscribers Only
Sign In or Create an Account Close Modal