

Key Points
Elevated glycolysis is a dominant metabolic feature of pathogenic alloreactive T cells early in the course of GVHD.
Metabolic magnetic resonance imaging using a glycolytic tracer detects GVHD in the liver ahead of animals developing apparent signs of GVHD.

Abstract
Graft-versus-host disease (GVHD) is a prominent barrier to allogeneic hematopoietic stem cell transplantation (AHSCT). Definitive diagnosis of GVHD is invasive, and biopsies of involved tissues pose a high risk of bleeding and infection. T cells are central to GVHD pathogenesis, and our previous studies in a chronic GVHD mouse model showed that alloreactive CD4+ T cells traffic to the target organs ahead of overt symptoms. Because increased glycolysis is an early feature of T-cell activation, we hypothesized that in vivo metabolic imaging of glycolysis would allow noninvasive detection of liver GVHD as activated CD4+ T cells traffic into the organ. Indeed, hyperpolarized 13C-pyruvate magnetic resonance imaging detected high rates of conversion of pyruvate to lactate in the liver ahead of animals becoming symptomatic, but not during subsequent overt chronic GVHD. Concomitantly, CD4+ T effector memory cells, the predominant pathogenic CD4+ T-cell subset, were confirmed to be highly glycolytic by transcriptomic, protein, metabolite, and ex vivo metabolic activity analyses. Preliminary data from single-cell sequencing of circulating T cells in patients undergoing AHSCT also suggested that increased glycolysis may be a feature of incipient acute GVHD. Metabolic imaging is being increasingly used in the clinic and may be useful in the post-AHSCT setting for noninvasive early detection of GVHD.
Introduction
Allogeneic hematopoietic stem cell transplantation (AHSCT) is a curative therapy for patients with aggressive hematologic malignancies, nonmalignant hematologic diseases, and a consolidation therapy for patients receiving chimeric antigen receptor T cells. Acute and chronic graft-versus-host disease (GVHD) following AHSCT are prevalent and morbid and may share pathophysiologic features. Acute GVHD (aGVHD) is the most significant risk factor for the development of chronic GVHD (cGVHD), and jointly they represent a major barrier to successful AHSCT.1-3 In addition, GVHD of the liver and the gastrointestinal tract poses a particular diagnostic challenge.4,5 Biopsies of these tissues are invasive, associated with serious bleeding and infection risks for the AHSCT recipient, and, although diagnostic, do not inform treatment selection. Responses to therapy are also difficult to assess and are being ascertained by tabulating and tracking the severity of clinical signs and symptoms.2,4-7 Noninvasive objective approaches to diagnose and monitor GVHD are needed.8
T cells are the primary mediators of GVHD.2 Therefore, therapies and prevention strategies for GVHD have targeted T cells,9,10 their subsets,11,12 differentiation,13,14 survival,15 and milieu, including antigen-presenting cells16,17 and cytokines.18,19 T-cell activation is an early event in GVHD pathogenesis and thus an attractive target for early diagnosis and intervention. Antigen-driven CD4+ T-cell activation has been directly tied to increased rates of glycolysis, and increased glycolytic flux is essential for CD4+ T-cell effector function.20-22 We previously showed that target organs of cGVHD are infiltrated by pathogenic alloreactive CD4+ T effector memory (Tem) cells in advance of overt disease.23 Thus, we hypothesized that metabolic tracing of a glycolytic metabolite in GVHD target organs may allow early noninvasive detection of GVHD in vivo.
Metabolic imaging provides important biological insights when combined with anatomical imaging. Currently, the most widely used metabolic imaging technique, fluorodeoxyglucose (FDG)-positron emission tomography (PET), detects increased glucose uptake but not its downstream metabolites. As a result, FDG-PET is unable to distinguish increases in glycolytic flux from increases in oxidative phosphorylation.24 To overcome this limitation, 13C-labeled metabolites detected by spectroscopic magnetic resonance imaging (MRI) have become increasingly used for functional imaging primarily in the setting of malignancy,25-30 and more recently in other inflammatory conditions.31,32 Ex vivo dynamic nuclear hyperpolarization (DNP) of the 13C-pyruvate tracer prior to infusion has improved the sensitivity of its MRI detection to allow real-time spectroscopic, nonradioactive measurement of in vivo glycolytic activity within tissues in preclinical and clinical studies.33,34
We hypothesized that early posttransplant antigen-stimulated T cells would have elevated glycolytic metabolism, which could allow in vivo detection of GVHD via metabolic imaging of target organs infiltrated by these cells. Thus, we applied hyperpolarized 13C-pyruvate MRI to an established minor histocompatibility antigen-mismatched GVHD model23,35-38 to evaluate whether increased glycolysis within a target organ could be detected ahead of overt clinical disease manifestations. Furthermore, we tested whether similar metabolic patterns would be present in circulating CD4+ T cells in patients prior to onset of aGVHD clinical symptoms.
Methods
Mice
Female BALB/cAnNCr (H-2d, #555) mice were purchased from Charles River (Wilmington, MA). Age-matched female B10.D2 (H-2d, #000463) mice were acquired from The Jackson Laboratory (Bar Harbor, ME). All mice were acclimatized for at least 4 weeks before transplantations and kept on a 12-hour/12-hour light-dark cycle with unrestricted access to food and water in a specific pathogen-free environment. All animal studies were reviewed and approved by the National Cancer Institute (NCI) Animal Care and Use Committee.
GVHD
Recipient female mice at 12 to 13 weeks of age were conditioned with 850 cGy total body irradiation delivered in 2 doses 3 hours apart on day −1. Age-matched BALB/c mice served as donor for matched, syngeneic transplants, whereas B10.D2 mice were used for allogeneic transplants. Recipients were reconstituted with 15 million unfractionated splenocytes and 8 million bone marrow cells injected via tail vein on day 0. The injection buffer contained gentamicin (100 μg/mL). No additional antibiotics were administered posttransplant. Animals were weighed, and cGVHD scoring was performed twice weekly using a previously described clinical scoring system.39
Metabolomics analysis
Fluorescence-activated cell sorter (FACS)-purified T-cell subsets (∼500 000 cells) from the spleen were collected directly into a 15-mL polypropylene centrifuge tube and processed immediately, including quenching of enzymes. Mass spectrometry analysis was performed by HMT Metabolome (Tokyo, Japan). A detailed description of the sample processing and analysis is included in the supplemental methods, available on the Blood Web site.
RNAseq and analysis of metabolic gene expression
Details regarding the RNA isolation from splenic CD4+ T-cell subsets, library preparation, and sequencing can be found in the supplemental methods. For the RNA sequencing (RNAseq) analysis, the counts per million with trimmed mean of M values normalization data were used to assess differences in gene expression between samples. For each gene, the expression in Tem cells was compared with the expression in phenotypically naive T cells (Tn) and expressed as a ratio (Tem/Tn).
Single-cell RNA sequencing and analysis
Single-cell sequencing of mouse CD45+ CD4+ cells isolated from the liver and human peripheral blood mononuclear cells (PBMCs) was performed using the 10× Genomics platform.40 The R package Seurat (v3.1.1) was used for the downstream analysis following the vignette for the analysis of an integrated dataset.41 A detailed description of the sample selection, cell preparation, initial sequencing, and analysis is included in the supplemental methods.
Hyperpolarized 13C-pyruvate magnetic resonance spectroscopic imaging (MRSI)
MRI scans were performed on a 3-T scanner controlled with EasyScan and PowerScan (MR Solutions, Acton, MA). Mice were placed into a 35-mm 13C-1H saddle coil (custom built in-house). T2-weighted anatomical images were obtained using a fast spin-echo sequence with echo time of 13 milliseconds, repetition time of 2500 milliseconds, 8 slices, 2-mm thickness, and a resolution of 0.25 × 0.25 mm. [1-13C]Pyruvic acid (30 μL; Cambridge Isotope Laboratories, Tewksbury, MA) containing 15 mM OX063 and 2.5 mM gadolinium chelate ProHance (Bracco Diagnostics, Milan, Italy) was hyperpolarized at 3.35 T and 1.45 K using a Hypersense DNP polarizer (Oxford Instruments, Abingdon, United Kingdom) for 40 to 60 minutes. The hyperpolarized [1-13C]pyruvic acid was rapidly dissolved in 4.5 mL of a superheated alkaline buffer comprising 50 mM Tris, 60 mM NaOH, and 100 mg/L EDTA to a final concentration of 96 mmol/L and was IV injected into the mouse through a catheter placed in the tail vein (12 μL/g body weight). 13C 2-dimensional spectroscopic images were acquired 25 seconds after the beginning of the [1-13C]pyruvate solution injection, with a 32 × 32-mm field of view in an 8-mm coronal slice through the body, a matrix size of 16 × 16, spectral width of 3330 Hz, repetition time of 85 milliseconds, and an excitation pulse with a flip angle of 20°. The total time required to acquire each image was 22 seconds.
Statistics
Statistical analyses were performed using Prism (GraphPad Software, La Jolla, CA). All graphs represent the mean ± standard error of the mean (SEM). Repeated measurements were compared using a mixed-effects model with Sidak’s multiple comparison test. All other datasets were analyzed using Welch’s 1-way analysis of variance (ANOVA) followed by Dunnet’s T3 multiple comparison test, or a 2-way ANOVA with Sidak’s correction for multiple testing as indicated in each figure legend. A value of P < .05 was considered statistically significant.
Results
Intracellular metabolic screen identifies high intracellular lactate within alloreactive CD4+ T cells
We previously demonstrated infiltration of liver, gut, skin, and spleen by donor-derived alloreactive CD4+ T cells in the B10.D2 into BALB/c mouse model.23 These cells were predominantly of the effector memory (Tem) phenotype (CD44highCCR7−) at day 14, when mice still appear largely asymptomatic (Figure 1A), are gaining weight (Figure 1B), and show no overt signs of disease (supplemental Figure 1A). Meanwhile, CD4+ Tem cells continue to predominate in the target organs when animals manifest measurable clinical signs of disease.23 Thus, we sought to elucidate the metabolic features of CD4+ T-cell subsets on day 14, a presymptomatic time point, to gain insight into GVHD pathogenesis, and potentially exploit metabolic properties of infiltrating T cells for noninvasive early detection of GVHD.
![Mass spectrometry screen of intracellular metabolites in CD4+ T-cell subsets early in cGVHD reveals increased aerobic glycolysis in allogeneic Tem cells. Representative example of the clinical score (A) and body weight (B) changes over time in the B10.D2 into BALB/c cGVHD model, n = 5 (syngeneic [syn]), n = 16 (allogeneic [allo]). (C) Schematic indicating the potential fate of pyruvate by being converted to either lactate (anaerobic/aerobic glycolysis), acetyl-CoA (TCA cycle), or alanine (transamination). (D-G) Intracellular concentrations of metabolites: lactate (D), citric acid (E), malic acid (F), and alanine (G). Single-cell suspensions were generated from pooled, freshly harvested spleens of syn (n = 19) and allo (n = 22) HSCT recipients on day 14. The cells underwent positive selection using CD4 microbeads. FACS-purified T-cell subsets were collected, and the enzyme activity was quenched with methanol. All samples were supplemented with an internal standard solution, and relative quantification was carried out using capillary electrophoresis time-of-flight mass spectrometry. Cells were pooled from 2 independent HSCTs. Each sample for MS analysis contained ∼3 million cells; n = 1 for syn/allo Tn samples, n = 2 for syngeneic Tem, and n = 3 for allogeneic Tem. Data are represented as mean + SEM, as appropriate. PDH, pyruvate dehydrogenase.](https://ash.silverchair-cdn.com/ash/content_public/journal/blood/137/1/10.1182_blood.2020005770/1/m_bloodbld2020005770f1.png?Expires=1770128034&Signature=h~-wquLD0Qt38PK56YUaCyOkxjWPII~PEXZIbdTlo~yoc8SUlyVkFEQG4aoR52xpbWsIpGKtcBg2xUORX6PR~Ol0X3HGargb-bJ6UeiFfDutDqjAMITuCV~Xzx6UwxroUv7A~2xJxx4R9Z8qe2rbuuyG-pAcy5K~MLGb7DHtoU8yWGZrZVjWRob3FC36PhDnJ0fd96utMPxdNzalZ3npTcDu4i-I3BMbcUdfImxv6jYNkgMsxErBnsMg6BlbxAYdYPnuM97hNEu7k3w-zyVowO1YbRKZrAxMTIQ-28q4HNwihG-a9e1q8epQk2gf9VaMLCYlc8jgmC02WqzVAYZ35A__&Key-Pair-Id=APKAIE5G5CRDK6RD3PGA)
Mass spectrometry screen of intracellular metabolites in CD4+ T-cell subsets early in cGVHD reveals increased aerobic glycolysis in allogeneic Tem cells. Representative example of the clinical score (A) and body weight (B) changes over time in the B10.D2 into BALB/c cGVHD model, n = 5 (syngeneic [syn]), n = 16 (allogeneic [allo]). (C) Schematic indicating the potential fate of pyruvate by being converted to either lactate (anaerobic/aerobic glycolysis), acetyl-CoA (TCA cycle), or alanine (transamination). (D-G) Intracellular concentrations of metabolites: lactate (D), citric acid (E), malic acid (F), and alanine (G). Single-cell suspensions were generated from pooled, freshly harvested spleens of syn (n = 19) and allo (n = 22) HSCT recipients on day 14. The cells underwent positive selection using CD4 microbeads. FACS-purified T-cell subsets were collected, and the enzyme activity was quenched with methanol. All samples were supplemented with an internal standard solution, and relative quantification was carried out using capillary electrophoresis time-of-flight mass spectrometry. Cells were pooled from 2 independent HSCTs. Each sample for MS analysis contained ∼3 million cells; n = 1 for syn/allo Tn samples, n = 2 for syngeneic Tem, and n = 3 for allogeneic Tem. Data are represented as mean + SEM, as appropriate. PDH, pyruvate dehydrogenase.
Mass spectrometry screen of intracellular metabolites in CD4+ T-cell subsets early in cGVHD reveals increased aerobic glycolysis in allogeneic Tem cells. Representative example of the clinical score (A) and body weight (B) changes over time in the B10.D2 into BALB/c cGVHD model, n = 5 (syngeneic [syn]), n = 16 (allogeneic [allo]). (C) Schematic indicating the potential fate of pyruvate by being converted to either lactate (anaerobic/aerobic glycolysis), acetyl-CoA (TCA cycle), or alanine (transamination). (D-G) Intracellular concentrations of metabolites: lactate (D), citric acid (E), malic acid (F), and alanine (G). Single-cell suspensions were generated from pooled, freshly harvested spleens of syn (n = 19) and allo (n = 22) HSCT recipients on day 14. The cells underwent positive selection using CD4 microbeads. FACS-purified T-cell subsets were collected, and the enzyme activity was quenched with methanol. All samples were supplemented with an internal standard solution, and relative quantification was carried out using capillary electrophoresis time-of-flight mass spectrometry. Cells were pooled from 2 independent HSCTs. Each sample for MS analysis contained ∼3 million cells; n = 1 for syn/allo Tn samples, n = 2 for syngeneic Tem, and n = 3 for allogeneic Tem. Data are represented as mean + SEM, as appropriate. PDH, pyruvate dehydrogenase.
Because activated CD4+ T cells have been shown to have a distinct metabolic profile, including elevated glycolysis in settings of cancer and autoimmunity,42-44 we focused on metabolites generated from pyruvate, the metabolite situated at the crossroads between aerobic glycolysis, the tricarboxylic acid (TCA) cycle, and amino acid metabolism (Figure 1C). We found that phenotypically naive splenic CD4+ T cells (Tn, CD44lowCCR7+) in AHSCT recipients had three- to fourfold higher intracellular levels of lactate compared with allogeneic Tem, as well as CD4+ T cells extracted from syngeneic recipients (Figure 1D). This indicates that while these cells still express CCR7 and have low CD44 expression, they are likely already antigen stimulated. Allogeneic CD4+ Tem showed an ∼50% higher intracellular lactate compared with their syngeneic counterparts. In contrast, citric acid and malic acid, intermediates of the TCA cycle, were more abundant in syngeneic Tem cells (Figure 1E-F). Allogeneic CD4+ T cells showed no differences between Tn and Tem with regard to citric acid, whereas malic acid levels were increased in both subsets compared with syngeneic Tn cells. No clear difference in intracellular alanine between syngeneic Tn or Tem was detected, whereas alanine levels in both allogeneic T-cell subsets were slightly higher compared with syngeneic subsets (Figure 1G). Based on these results, increased conversion of pyruvate to lactate appeared to be a distinguishing metabolic feature of allogeneic CD4+ T cells.
CD4+ Tem cells extracted from AHSCT recipients display a high ECAR
Next, we FACS purified CD4+ Tn and Tem cells from spleens of allogeneic and syngeneic hematopoietic stem cell transplantation (HSCT) recipients on day 14 and measured their extracellular acidification rate (ECAR) and oxygen consumption rate, surrogate measures for glycolysis, and oxidative phosphorylation, respectively (Figure 2A-B). Allogeneic CD4+ Tem cells were distinguished from other subsets by the highest basal ECAR (Figure 2B). Although both syngeneic and allogeneic Tem cells showed elevated basal glycolysis compared with Tn, this difference was more pronounced between allogeneic Tem and Tn cells with the highest basal glycolysis observed in allogeneic Tem cells (Figure 2C). Similarly, the glycolytic capacity of allogeneic Tem cells was higher compared with the other subsets (Figure 2D). Syngeneic Tem cells had a lower basal respiration and basal glycolysis than allogeneic Tem cells. Based on the high extracellular lactate export and the low intracellular lactate levels, we hypothesized that upon differentiation from a naive surface phenotype, Tem cells continue to rely on glycolysis and produce lactate, but do not accumulate lactate intracellularly due to an increased extracellular transport.
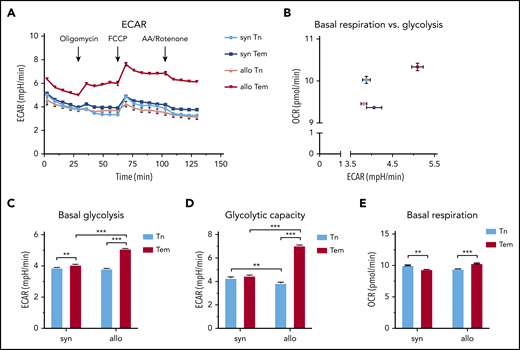
CD4+ Tem cells exhibit a higher ECAR compared with CD4+ Tn or syngeneic CD4+ Tem in cGVHD. (A) Single-cell suspensions were generated from pooled harvested spleens of syngeneic (n = 5 mice) and allogeneic (n = 9 mice) HSCT recipients on day 14. The cells underwent positive selection using CD4 magnetic microbeads, followed by FACS. FACS-purified T cells were plated using CellTak at a seeding density of 100 000 live sorted cells per well and treated with oligomycin (1 µM), carbonyl cyanide 4-(trifluoromethoxy)phenylhydrazone (FCCP; 0.5 µM), and antimycin A (AA)/Rotenone (1 µM) at indicated time points. The number of technical replicates equals n = 8 to 32 wells per subtype; data are representative of 2 independent experiments. (B) Basal glycolysis vs basal respiration. (C) Basal glycolysis based on the mean of the 2 time points before oligomycin injection. (D) Glycolytic capacity measured after FCCP addition (mean of 4 time points). (E) Basal respiration rate based on the mean of the 3 time points before oligomycin injection. All data are represented as mean + SEM, statistical testing using a 2-way ANOVA, *P < .05, **P < .01, ***P < .001. OCR, oxygen consumption rate.
CD4+ Tem cells exhibit a higher ECAR compared with CD4+ Tn or syngeneic CD4+ Tem in cGVHD. (A) Single-cell suspensions were generated from pooled harvested spleens of syngeneic (n = 5 mice) and allogeneic (n = 9 mice) HSCT recipients on day 14. The cells underwent positive selection using CD4 magnetic microbeads, followed by FACS. FACS-purified T cells were plated using CellTak at a seeding density of 100 000 live sorted cells per well and treated with oligomycin (1 µM), carbonyl cyanide 4-(trifluoromethoxy)phenylhydrazone (FCCP; 0.5 µM), and antimycin A (AA)/Rotenone (1 µM) at indicated time points. The number of technical replicates equals n = 8 to 32 wells per subtype; data are representative of 2 independent experiments. (B) Basal glycolysis vs basal respiration. (C) Basal glycolysis based on the mean of the 2 time points before oligomycin injection. (D) Glycolytic capacity measured after FCCP addition (mean of 4 time points). (E) Basal respiration rate based on the mean of the 3 time points before oligomycin injection. All data are represented as mean + SEM, statistical testing using a 2-way ANOVA, *P < .05, **P < .01, ***P < .001. OCR, oxygen consumption rate.
CD4+ Tem cells upregulate transcription of glycolytic enzymes and transporters
To gain additional insight into the metabolic properties of CD4+ subsets, we performed RNAseq on splenic allogeneic Tem and Tn cells to compare their expression of key metabolic enzymes in glycolysis and the TCA cycle (Figure 3). Consistent with our intracellular and ex vivo metabolic data, higher transcriptional levels of multiple glycolytic enzymes were detected in Tem vs Tn cells. Specifically, transcripts for key regulatory glycolytic enzymes, such as hexokinase 2 (Hk2), glyceraldehyde 3-phosphate dehydrogenase (Gapdh), and pyruvate kinase (Pkm), were expressed at higher levels in allogeneic CD4+ Tem compared with Tn cells (Figure 3A-B). Along with increased transcriptional expression of glycolytic enzymes, transporters for glucose (Slc2a1/Glut1 and Slc2a3/Glut3) and lactate (Slc16a1/Mct) were also upregulated in the CD4+ Tem subset. The latter may explain the decreased levels of intracellular lactate concurrent with the higher ECAR in allogeneic Tem compared with Tn. The increased RNA expression of Glut1, Hk2, and Gapdh in the spleen was also confirmed at the protein level. The expression of all 3 proteins was increased in allogeneic CD4+ Tem cells compared with CD4+ Tn based on the ratio of their median fluorescence intensity, and this difference was more pronounced in CD4+ T cells isolated from allogeneic animals (Figure 3C; supplemental Figure 2 A-C).
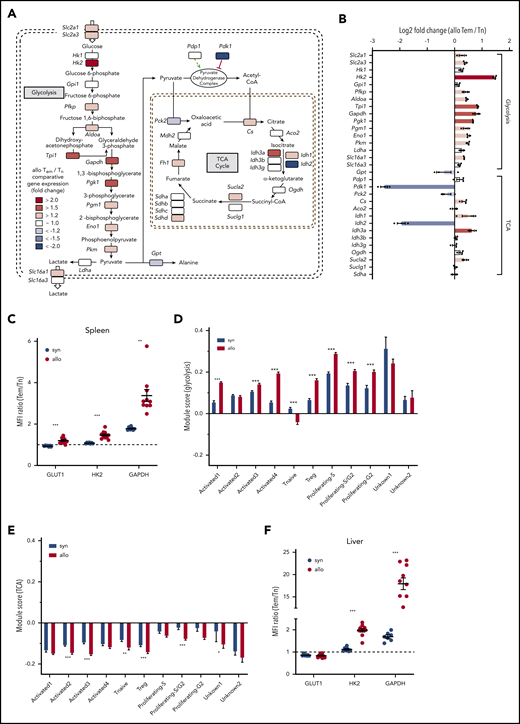
RNAseq of allogeneic CD4+ Tn and Tem cells indicates an overall upregulation of glycolytic enzymes in alloreactive Tem cells. (A) FACS-purified allogeneic Tem and Tn cells from the spleen (>0.5 million cells per sample) were pooled from multiple study animals on day 14. RNA was extracted from pooled samples of each cell type (n = 1 for Tn, n = 3 for Tem), and the library was generated using the HyperPrep RNA-Seq Kit. All samples were sequenced on a HiSeq4000 (Illumina), and the reads were trimmed, mapped to the reference genome, and normalized to the library size as counts per million. The shaded squares indicate an increased (red) or decreased (blue) expression in Tem cells over Tn cells, and log2 fold-change values are indicated in panel B. (C) CD4+ T cells were isolated from the spleen of syngeneic and allogeneic animals on day 14 posttransplant and analyzed via flow cytometry to analyze the protein expression of GLUT1, HK2, and GAPDH in naive CD4+ and Tem cells. The ratio of the median fluorescence intensity of Tem to Tn cells is displayed as mean ± SEM; n = 7 (syn)/10 (allo) animals; Welch’s ANOVA test with Dunnett’s T3 multiple comparison test. (D) Gene expression module score of glycolysis genes and (E) TCA cycle genes in a single-cell sequencing data set of CD4+ cells isolated from the liver of syngeneic and allogeneic mice on day 14 posttransplant quantifying the up- or downregulation of a predefined set of genes (see also supplemental Table 3). Data were generated from 3 separately processed biological replicates for each condition that were pooled for the bioinformatic analysis. Two-way ANOVA with Sidak’s multiple comparison test; bar graphs represent mean ± SEM. (F) Quantification of the protein expression of GLUT1, HK2, and GAPDH in T-cell subsets isolated from the liver on day 14 as described in panel C. Aco2, aconitase 2; Aldoa, fructose-bisphosphate aldolase A; Cs, citrate synthase; Eno1, enolase 1; Fh, fumarate hydratase; Gpi1, glucose phosphate isomerase 1; Gpt, glutamate pyruvate transaminase; Hk1, hexokinase 1; Idh, isocitrate dehydrogenase 1; Ldha, lactose dehydrogenase A; Mdh, malate dehydrogenase; MFI, mean fluorescence intensity; Ogdh, oxoglutarate dehydrogenase; Pck2, phosphoenolpyruvate carboxykinase 2; Pdk1, pyruvate dehydrogenase kinase 1; Pdp1, pyruvate dehydrogenase phosphatase 1; Pfkp, phosphofructokinase; Pgk1, phosphoglycerate kinase 1; Pgm1, phosphoglucomutase1; Slc2a1, solute carrier family 2 member 1 (GLUT1); Slc2a3, solute carrier family 2 member 3 (GLUT3); Slc16a1, solute carrier family member 16 (MCT1); Slc16a3, solute carrier family 2 member 1 (MCT4); Sucla, succinyl-CoA ligase; Sudh, succinate dehydrogenase. *P < .05, **P < .01, ***P < .001.
RNAseq of allogeneic CD4+ Tn and Tem cells indicates an overall upregulation of glycolytic enzymes in alloreactive Tem cells. (A) FACS-purified allogeneic Tem and Tn cells from the spleen (>0.5 million cells per sample) were pooled from multiple study animals on day 14. RNA was extracted from pooled samples of each cell type (n = 1 for Tn, n = 3 for Tem), and the library was generated using the HyperPrep RNA-Seq Kit. All samples were sequenced on a HiSeq4000 (Illumina), and the reads were trimmed, mapped to the reference genome, and normalized to the library size as counts per million. The shaded squares indicate an increased (red) or decreased (blue) expression in Tem cells over Tn cells, and log2 fold-change values are indicated in panel B. (C) CD4+ T cells were isolated from the spleen of syngeneic and allogeneic animals on day 14 posttransplant and analyzed via flow cytometry to analyze the protein expression of GLUT1, HK2, and GAPDH in naive CD4+ and Tem cells. The ratio of the median fluorescence intensity of Tem to Tn cells is displayed as mean ± SEM; n = 7 (syn)/10 (allo) animals; Welch’s ANOVA test with Dunnett’s T3 multiple comparison test. (D) Gene expression module score of glycolysis genes and (E) TCA cycle genes in a single-cell sequencing data set of CD4+ cells isolated from the liver of syngeneic and allogeneic mice on day 14 posttransplant quantifying the up- or downregulation of a predefined set of genes (see also supplemental Table 3). Data were generated from 3 separately processed biological replicates for each condition that were pooled for the bioinformatic analysis. Two-way ANOVA with Sidak’s multiple comparison test; bar graphs represent mean ± SEM. (F) Quantification of the protein expression of GLUT1, HK2, and GAPDH in T-cell subsets isolated from the liver on day 14 as described in panel C. Aco2, aconitase 2; Aldoa, fructose-bisphosphate aldolase A; Cs, citrate synthase; Eno1, enolase 1; Fh, fumarate hydratase; Gpi1, glucose phosphate isomerase 1; Gpt, glutamate pyruvate transaminase; Hk1, hexokinase 1; Idh, isocitrate dehydrogenase 1; Ldha, lactose dehydrogenase A; Mdh, malate dehydrogenase; MFI, mean fluorescence intensity; Ogdh, oxoglutarate dehydrogenase; Pck2, phosphoenolpyruvate carboxykinase 2; Pdk1, pyruvate dehydrogenase kinase 1; Pdp1, pyruvate dehydrogenase phosphatase 1; Pfkp, phosphofructokinase; Pgk1, phosphoglycerate kinase 1; Pgm1, phosphoglucomutase1; Slc2a1, solute carrier family 2 member 1 (GLUT1); Slc2a3, solute carrier family 2 member 3 (GLUT3); Slc16a1, solute carrier family member 16 (MCT1); Slc16a3, solute carrier family 2 member 1 (MCT4); Sucla, succinyl-CoA ligase; Sudh, succinate dehydrogenase. *P < .05, **P < .01, ***P < .001.
To further assess the transcriptional status of CD4+ T cells in a target organ of GVHD, we performed single-cell RNAseq of CD45+CD4+ cells isolated from the liver of syngeneic and allogeneic animals at day 14. For a direct comparison between CD4+ T-cell subsets, syngeneic and allogeneic datasets were integrated to identify conserved RNA transcript markers (supplemental Figure 3A-C).41 After removal of non–T-cell clusters, the dataset contained 2 dominant clusters that were either enriched in allogeneic (Activated1) or syngeneic animals (Activated2; supplemental Figure 3D-G). The predominant cluster in syngeneic animals was characterized by expression of T helper 1–associated genes, such as Id2 and Cxcr6 (supplemental Figure 3E-F).45 The dominant cluster in allogeneic animals (Activated1) showed a similar signature but was additionally characterized by expression of Ccl3, Ccl4, Ccl5, Ifng as well as several exhaustion markers, such as Pdcd1 and Lag3 (supplemental Figure 3F). Cluster Activated3 and Activated4 contained signature genes for central memory cells with cluster Activated 4 additionally expressing genes that characterize T follicular helper cells. Other cell clusters were identified as CD4+ T regulatory cells based on Foxp3 and Ikzf2 expression, naive (Tnaive, based on Ccr7 and Lef1 expression), as well as clusters marked by proliferation associated genes of the S- (Proliferating-S, Proliferating-S/G2) or G2- cell-cycle phase (Proliferating-S/G2, Proliferating-G2).45,46 Using the genes of the glycolysis pathway as indicated in Figure 3A, a module score was calculated to test preferential up- or downregulation of this gene set compared with a random control gene set.46 Except for the naive CD4+ T-cell cluster, every cluster showed enrichment for glycolytic genes, and this increase was significantly more pronounced in the activated T-cell cluster dominant in allogeneic animals (Activated1) as well as the proliferating and CD4+ T regulatory cell clusters (Figure 3D). In contrast, TCA genes were generally found to be downregulated in both syngeneic and allogeneic animals (Figure 3E). Again, these changes were confirmed on the protein level for HK2 and GAPDH in CD4+ T cells isolated from the liver on day 14 (Figure 3F). Only GLUT1 showed a slightly decreased expression in CD4+ Tem cells, and this did not differ between syngeneic and allogeneic animals. With regards to myeloid cells, only GLUT1 levels were increased in allogeneic CD11b+ Ly6C+ cells, whereas HK2 and GAPDH levels did not differ between the syngeneic and allogeneic group (supplemental Figure 2D-E).
Hyperpolarized [1-13C]pyruvate MRI demonstrates high conversion of pyruvate to lactate within the liver
Because highly glycolytic activated T cells infiltrate target organs, we hypothesized that these metabolic changes could be exploited to visualize affected organs, differentiating them from unaffected tissues or syngeneic recipients. To test this, we performed 13C-hyperpolarized MRI over the post-HSCT course. As stated, the method tracks 13C-labeled hyperpolarized pyruvate and its 13C-labeled metabolites in tissue (Figure 4A). We performed serial 13C-MRI scans on mice that underwent syngeneic HSCT or AHSCT starting from post-HSCT day 7 through 28. The liver was first defined anatomically as a region of interest and, immediately following the infusion of the hyperpolarized [1-13C]pyruvic acid, the peaks for [1-13C]pyruvate and its metabolites [1-13C]alanine and [1-13C]lactate were measured at ∼171, 177, and 183 ppm, respectively (Figure 4B). On day 14, we observed a significantly increased liver lactate/pyruvate ratio in AHSCT recipients compared with syngeneic controls (mean 1.65 vs 0.49, P = .01), indicating higher rates of lactate dehydrogenase activity and increased generation of lactate in the livers of AHSCT recipients (Figure 4C-D). This difference was only observed on day 14, suggesting that glycolytic activity in the GVHD target organ was dynamic and transient (Figure 4D). Importantly, increased conversion of pyruvate to lactate was detectable in the liver before animals developed clinical signs of GVHD. We inferred that the elevated lactate conversion in the liver was at least in part due to high rates of lactate production and secretion by infiltrating alloreactive CD4+ Tem cells. To test whether elevated lactate production in the liver leads to concurrent systemic lactate elevation, we collected serial plasma samples over the post-HSCT course to quantify the plasma lactate concentration (Figure 4E). Interestingly, we observed that the plasma lactate levels peaked on day 7 and were significantly higher in allogeneic than in syngeneic animals. Other time points showed no significant differences between cohorts (Figure 4E). Concurrently, we assessed the number of circulating alloreactive CD4+ T cells and found significantly higher numbers of circulating CD4+ Tem cells in allogeneic compared with syngeneic recipients on day 7 and 14, with a higher number on day 7 (supplemental Figure 4).
![Hyperpolarized 13C-pyruvate in vivo MRI performed over the postsyngeneic and allogeneic HSCT course. [1-13C]Pyruvic acid (30 μL), containing 15 mM OX063 and 2.5 mM gadolinium chelate, was hyperpolarized using the Hypersense DNP Polarizer (Oxford Instruments). After hyperpolarization was achieved, the sample was dissolved in 4.5 mL of heated alkaline buffer, ie, 40 mM 4-(2-hydroxyethyl)-1 piperazineethanesulfonic acid, 30 mM of NaCl, and 100 mg/L of EDTA. The hyperpolarized [1-13C]pyruvate solution (96 mM) was then administered through an IV tail vein catheter. 13C MRI studies were performed on a 3-T MR Solutions MRI using a custom 13C-1H saddle coil for spectroscopic and anatomical imaging. (A) Schematic representation of the pyruvate-to-lactate conversion with the hyperpolarized 13C indicated in red. (B) Representative coronal anatomical MRI images overlaid with the 13C MRSI spectra for each voxel and an exemplary 13C spectrum indicating the lactate, alanine, and pyruvate peaks shown for a syngeneic (top) and allogeneic (bottom) animal at day 14. (C) MRSI images of syn (top) and allo (bottom) at day 14, indicating the signal intensity for lactate, pyruvate, as well as the combined lactate/pyruvate ratio. A region of interest was drawn around the liver based on the anatomical MRI, which was then used to quantify the signal intensity for each peak. (D) Lactate/pyruvate signal intensity in the liver over time after HSCT in syngeneic and allogeneic animals, n = 3 to 6 animals per group and time point, **P < .01 in a mixed-effect analysis with Sidak’s multiple comparison test. (E) Mouse plasma was collected via mandibular bleed at indicated time points in sodium fluoride/EDTA–coated microtubes. After centrifugation, an internal standard was added, and the lactate levels were quantified using ultra performance liquid chromatography–mass spectrometry, n = 4 to 17 per group and time point, **P < .01 in a mixed-effect analysis with Sidak’s multiple comparison test. All data are shown as mean ± SEM. ALT, alanine aminotransferase.](https://ash.silverchair-cdn.com/ash/content_public/journal/blood/137/1/10.1182_blood.2020005770/1/m_bloodbld2020005770f4.png?Expires=1770128034&Signature=SaYFA3RUXtM7f9~u4l3GFw3AfUo~9JoJSgsGQs-H5IEwCwUwNtQmGc~BlkIT1Kx5IRfOxX0YZ5s7qGKt4c1oCV2nH6qqvGtZ0GlBUFbI4S5562rwnBkciyUItopnurMqqaFYJm2WsyUsoiY9YwOHUtC-OekEbUSb1CV48nxy57Yisfr22beMniHLIUO5dzaW6WYHcl4N593Nz-foz~fyO8dHozs0Lg5j-baKCINGYi73ork7Zr46sA8kcCBzlu7ch5CHZ5BJbmOB7d5z0W2WX4xC7n5jdQWqBTUIakMypcFBbRbj4LqrK3Q1qYlvsfuXTYWFoLsXKX8qblBGMw68Ww__&Key-Pair-Id=APKAIE5G5CRDK6RD3PGA)
Hyperpolarized 13C-pyruvate in vivo MRI performed over the postsyngeneic and allogeneic HSCT course. [1-13C]Pyruvic acid (30 μL), containing 15 mM OX063 and 2.5 mM gadolinium chelate, was hyperpolarized using the Hypersense DNP Polarizer (Oxford Instruments). After hyperpolarization was achieved, the sample was dissolved in 4.5 mL of heated alkaline buffer, ie, 40 mM 4-(2-hydroxyethyl)-1 piperazineethanesulfonic acid, 30 mM of NaCl, and 100 mg/L of EDTA. The hyperpolarized [1-13C]pyruvate solution (96 mM) was then administered through an IV tail vein catheter. 13C MRI studies were performed on a 3-T MR Solutions MRI using a custom 13C-1H saddle coil for spectroscopic and anatomical imaging. (A) Schematic representation of the pyruvate-to-lactate conversion with the hyperpolarized 13C indicated in red. (B) Representative coronal anatomical MRI images overlaid with the 13C MRSI spectra for each voxel and an exemplary 13C spectrum indicating the lactate, alanine, and pyruvate peaks shown for a syngeneic (top) and allogeneic (bottom) animal at day 14. (C) MRSI images of syn (top) and allo (bottom) at day 14, indicating the signal intensity for lactate, pyruvate, as well as the combined lactate/pyruvate ratio. A region of interest was drawn around the liver based on the anatomical MRI, which was then used to quantify the signal intensity for each peak. (D) Lactate/pyruvate signal intensity in the liver over time after HSCT in syngeneic and allogeneic animals, n = 3 to 6 animals per group and time point, **P < .01 in a mixed-effect analysis with Sidak’s multiple comparison test. (E) Mouse plasma was collected via mandibular bleed at indicated time points in sodium fluoride/EDTA–coated microtubes. After centrifugation, an internal standard was added, and the lactate levels were quantified using ultra performance liquid chromatography–mass spectrometry, n = 4 to 17 per group and time point, **P < .01 in a mixed-effect analysis with Sidak’s multiple comparison test. All data are shown as mean ± SEM. ALT, alanine aminotransferase.
Hyperpolarized 13C-pyruvate in vivo MRI performed over the postsyngeneic and allogeneic HSCT course. [1-13C]Pyruvic acid (30 μL), containing 15 mM OX063 and 2.5 mM gadolinium chelate, was hyperpolarized using the Hypersense DNP Polarizer (Oxford Instruments). After hyperpolarization was achieved, the sample was dissolved in 4.5 mL of heated alkaline buffer, ie, 40 mM 4-(2-hydroxyethyl)-1 piperazineethanesulfonic acid, 30 mM of NaCl, and 100 mg/L of EDTA. The hyperpolarized [1-13C]pyruvate solution (96 mM) was then administered through an IV tail vein catheter. 13C MRI studies were performed on a 3-T MR Solutions MRI using a custom 13C-1H saddle coil for spectroscopic and anatomical imaging. (A) Schematic representation of the pyruvate-to-lactate conversion with the hyperpolarized 13C indicated in red. (B) Representative coronal anatomical MRI images overlaid with the 13C MRSI spectra for each voxel and an exemplary 13C spectrum indicating the lactate, alanine, and pyruvate peaks shown for a syngeneic (top) and allogeneic (bottom) animal at day 14. (C) MRSI images of syn (top) and allo (bottom) at day 14, indicating the signal intensity for lactate, pyruvate, as well as the combined lactate/pyruvate ratio. A region of interest was drawn around the liver based on the anatomical MRI, which was then used to quantify the signal intensity for each peak. (D) Lactate/pyruvate signal intensity in the liver over time after HSCT in syngeneic and allogeneic animals, n = 3 to 6 animals per group and time point, **P < .01 in a mixed-effect analysis with Sidak’s multiple comparison test. (E) Mouse plasma was collected via mandibular bleed at indicated time points in sodium fluoride/EDTA–coated microtubes. After centrifugation, an internal standard was added, and the lactate levels were quantified using ultra performance liquid chromatography–mass spectrometry, n = 4 to 17 per group and time point, **P < .01 in a mixed-effect analysis with Sidak’s multiple comparison test. All data are shown as mean ± SEM. ALT, alanine aminotransferase.
scRNAseq of human PBMCs suggests increased transcription of glycolytic enzymes in CD4+ T cells prior to onset of aGVHD
To evaluate whether metabolic changes within CD4+ T cells observed in the preclinical model are also present in patients, we performed single-cell RNA sequencing (scRNAseq) on human PBMCs obtained with consent from 2 patients who underwent T-cell replete AHSCT. We retrospectively screened annotated clinical data from a GVHD clinical study performed at the NCI (#NCT00520130) and identified 2 patients who underwent the same reduced intensity conditioning regimen and GVHD prophylaxis after receiving peripheral blood hematopoietic stem cells from an unrelated donor for lymphoma in complete remission. A PBMC blood sample was collected with consent for both patients on day 30 as part of the study protocol. The “pre-GVHD” patient became symptomatic 5 days after and was diagnosed with aGVHD 7 days after PBMC collection, whereas the “no-GVHD” patient did not develop any signs of GVHD (Figure 5A; for details see supplemental methods). The analysis was performed analogous to the mouse data set and resulted in a total of 5969 and 4297 cells analyzed for the “no GVHD” and “pre-GVHD” patient, respectively (supplemental Figure 5A). Uniform Manifold Approximation and Projection–based dimensional reduction generated 14 distinct clusters after integration of both samples, and their identity was assigned using known cellular markers published in previous scRNAseq datasets (supplemental Figure 5B-C).40 Both samples consisted mainly of monocytes (∼60% to 70%) as well as dendritic cells, natural killer, and T cells (supplemental Figure 5D). T cells further clustered into separate CD4+ and CD8+ as well as a mixed CD4/CD8 cluster that was strongly associated with gene expression indicating proliferation, eg, MKI67 (designated as T_proliferating; supplemental Figure 5E). Comparing the gene expression of the CD4+ and T_proliferating clusters between both patients showed increased expression of genes associated with T-cell activation, ie, CD69, GADD45B as well as JUN and FOS in the “pre-GVHD” patient (Figure 5B). In addition, SLC2A3 expression, the gene for the glucose transporter GLUT3, was significantly increased in both CD4+ T-cell–containing clusters of the “pre-GVHD” patient sample. Although CD8+ T cells from the “pre-GVHD” sample also showed an increase in activation-related genes, SLC2A3 transcription did not appear to be significantly increased (supplemental Figure 5F). The scaled expression level of key genes within the glycolysis pathway for the 2 CD4+ T-cell–containing clusters indicated that several genes, ie, SLC2A3, PKM, ENO1, and LDHA, displayed an increased expression in the “pre-GVHD” patient sample (Figure 5C), and this was also reflected in higher module scores for the glycolysis gene set, whereas the average expression of TCA genes was not upregulated and did not differ between the 2 patients (Figure 5D).
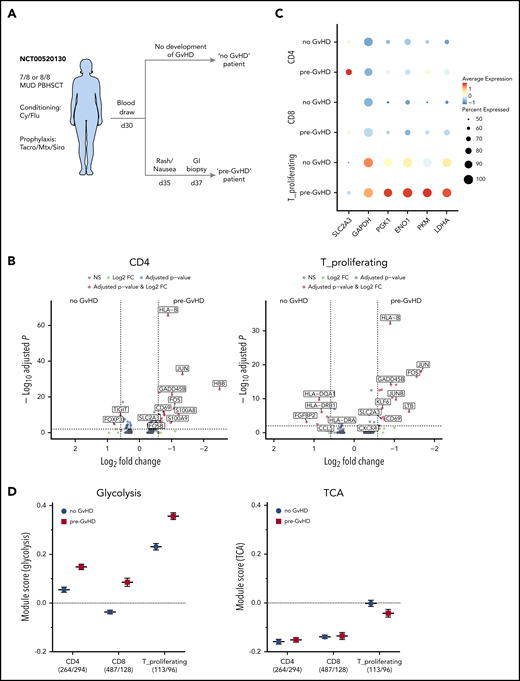
Single-cell RNAseq of AHSCT patient-derived PBMCs. (A) Diagram depicting sample selection. PBMCs of 2 patients, one of which developed GVHD shortly after sample collection (pre-GVHD) and one who did not (no GVHD), were thawed; red blood cells were lysed, and cell viability was assessed. Single-cell preparation was performed using the Chromium Next GEM Single Cell 5′ Library & Gel Bead Kit (10× Genomics). Sequenced reads were aligned to the human GRCh38 reference sequence provided by 10× Genomics. Clustering and visualization were performed in R using the Seurat package (v3.1.1) with integrated datasets. (B) Volcano plot of the differential gene expression within 1 cluster comparing the no GVHD vs pre-GVHD sample for the CD4 cluster (left) and T_proliferating cluster (right). Genes with a fold change >1.5 and adjusted P value <.01 are highlighted in red. (C) Dot plot visualizing the scaled gene expression level of key glycolysis enzymes for the CD4, CD8, and T_proliferating cluster. (D) Comparison of the module scores for Glycolysis (left) and TCA (right) between both patients for CD4, CD8, and proliferating T cells. The analyzed cell numbers for each cluster are indicated in parentheses. Data displayed as mean ± SEM. FC, fold change; GI, gastrointestinal; MUD, matched unrelated donor; NS, not significant; PBHSCT, peripheral blood hematopoietic stem cell transplantation.
Single-cell RNAseq of AHSCT patient-derived PBMCs. (A) Diagram depicting sample selection. PBMCs of 2 patients, one of which developed GVHD shortly after sample collection (pre-GVHD) and one who did not (no GVHD), were thawed; red blood cells were lysed, and cell viability was assessed. Single-cell preparation was performed using the Chromium Next GEM Single Cell 5′ Library & Gel Bead Kit (10× Genomics). Sequenced reads were aligned to the human GRCh38 reference sequence provided by 10× Genomics. Clustering and visualization were performed in R using the Seurat package (v3.1.1) with integrated datasets. (B) Volcano plot of the differential gene expression within 1 cluster comparing the no GVHD vs pre-GVHD sample for the CD4 cluster (left) and T_proliferating cluster (right). Genes with a fold change >1.5 and adjusted P value <.01 are highlighted in red. (C) Dot plot visualizing the scaled gene expression level of key glycolysis enzymes for the CD4, CD8, and T_proliferating cluster. (D) Comparison of the module scores for Glycolysis (left) and TCA (right) between both patients for CD4, CD8, and proliferating T cells. The analyzed cell numbers for each cluster are indicated in parentheses. Data displayed as mean ± SEM. FC, fold change; GI, gastrointestinal; MUD, matched unrelated donor; NS, not significant; PBHSCT, peripheral blood hematopoietic stem cell transplantation.
Discussion
In this paper, we describe a metabolic MRI approach that detects target organ involvement ahead of overt symptoms in a preclinical cGVHD model. We found concomitant increased transcription of glycolytic enzymes and glucose transporters along with metabolite and protein level evidence of increased glycolysis within an alloreactive pathogenic CD4+ T-cell subset during the early phase of GVHD when such cells traffic to the target organs, including T cells that were extracted from the liver. A limited single-cell RNAseq analysis of circulating CD4+ T cells from 2 patients undergoing HSCT suggests that increased transcription of glycolytic genes prior to onset of overt acute GVHD clinical symptoms may occur in the clinical AHSCT setting.
Consistent with previous work on CD4+ T-cell metabolism in mouse models of GVHD, we observed a glycolytic phenotype in allogeneic CD4+ Tem cells. Specifically, an upregulation of glucose and lactate transporters in CD4+ T cells in acute GVHD models has been previously described,47,48 and our research reports the glucose transporters Glut1 and Glut3 to be upregulated early in the context of cGVHD. However, despite increased lactate excretion by CD4+ Tem cells, we did not observe a further upregulation of Ldha transcription, likely because we compared allogeneic CD4+ Tem to Tn cells that were already antigen stimulated, while previously bulk CD4+ T cells from allogeneic and syngeneic cohorts were compared.47 Because allogeneic Tn cells in our study already had high levels of intracellular lactate, indicating high activity of LDHA, the latter is likely sustained through the phenotypic transition to Tem without further upregulation or may be regulated posttranscriptionally, eg, via phosphorylation.49
Our study indicates that metabolism is dynamic over the course of GVHD. Although we detected high rates of pyruvate-to-lactate conversion in the liver on day 14 via MRI, later time points showed no differences, pointing to further metabolic shifts upon disease progression. The early time frame in this model is characterized by migration of activated T cells from the spleen into the liver. Analogous observations were previously reported by Bäuerlein et al where increased expression of the gut and liver tissue homing receptor integrin α4β7 as well as maximum donor chimerism were reported in a similar time frame (day 10 to 15) in a minor-mismatch model of GVHD.50 Prior studies of T-cell metabolism in GVHD identified glycolysis as a critical metabolic pathway for T-cell activation and antigenic priming during disease initiation, but the reliance on glycolysis can change during later stages of T-cell activation and differentiation.51 Several other metabolic pathways pertinent to T-cell function in GVHD have already been identified.47,52,53 Sequencing data from the liver indicate that a significant proportion of activated CD4+ T cells display an exhausted transcriptional phenotype. Expression of programmed cell death protein-1 in T cells has been shown to inhibit glycolysis and promote fatty acid metabolism in a model of chronic antigen exposure.54,55 It is therefore possible that the initial increase in glycolysis is counteracted by inhibitory mechanisms such as programmed cell death protein-1 upregulation at later time points. Because a wide range of metabolites is amenable to 13C-metabolic tracing in vivo,56 further characterization of immune metabolism over the entire course of GVHD is prudent and may elucidate unique features of early, ongoing, and well-established GVHD.51
Whether increased glycolytic flux observed by metabolic MRI is solely attributable to T cells infiltrating the liver is not yet known. Other immune populations present in the liver, such as macrophages and dendritic cells, have been described to upregulate glycolysis in response to inflammatory stimuli,57,58 and nonhematopoietic cells, such as hepatocytes, could potentially experience a perturbed glucose metabolism in the setting of an immune attack.59 We did not observe a similar increase for HK2 and GAPDH in CD11b+ Ly6C+ cells, which include tissue-resident macrophages and infiltrating monocytes, in the liver on day 14. Nevertheless, we did detect an increase of GLUT1 in this cell population and cannot rule out a contribution of other immune cells to the overall pyruvate-to-lactate conversion. The day 14 pyruvate/lactate MRI peak coincides with the influx of CD4+ T cells into the liver. Similarly, high FDG-PET uptake was observed by Stelljes et al concurrent with influx of T cells into the target organ (colon) in a different GVHD model.60 Interestingly, our images of the gastrointestinal tract, another key GVHD target tissue infiltrated by alloreactive T cells on day 14,23 are suggestive of concomitant increased glycolytic activity, albeit the metabolic tracing was not feasible due to anatomical complexity of gut as a region of interest. Of note, the plasma lactate peak we detected on day 7 through serial post-HSCT sampling coincided with the peak number of CD4+ Tem in circulation. Although not directly linked, this could indicate increased lactate export in CD4+ Tem cells possibly contributing to the plasma lactate elevation. We did not detect increased glycolytic flux in the liver in the setting of syngeneic HSCT, in agreement with another syngeneic model demonstrating absence of FDG uptake in this setting and in the absence of T cells in the tissue.60 Finally, Bodet-Milin et al evaluated the predictive potential of FDG-PET to detect development of acute gastrointestinal GVHD and found that high FDG uptake in the gut often preceded imminent onset of symptoms and was helpful in guiding biopsy sampling.61
Our approach is safe to translate to the clinic because unlike FDG-PET it lacks exposure to ionizing radiation. Although generally regarded as safe, PET/computed tomography could pose a greater risk in the post-AHSCT setting where patients are generally heavily pretreated with chemo- and/or radiation therapy and are known to have a higher risk of secondary malignancies.62 The lack of radiation would permit serial imaging that could cover the initial diagnosis, flares, and potential evaluation of therapeutic responses. Wide clinical implementation of hyperpolarized metabolic imaging is currently limited by the logistics and expense of the equipment, but active clinical studies are ongoing and methodological modifications are currently being conducted to simplify the setup and lower costs, which should facilitate expanded use of metabolic MRI.30,63 Furthermore, recent improvements in data processing have enabled omission of hyperpolarization for metabolic imaging and could be tested in the setting of GVHD.64,65
Although metabolic imaging is safe, its clinical utility in the post-HSCT setting may be limited by the potential lack of specificity for GVHD. Infection, graft rejection, engraftment, relapse, and early GVHD may have similar radiographic features. However, using this imaging modality in combination with established routine clinical testing may help distinguish GVHD from the other above-mentioned immune-driven complications. In addition, serial plasma lactate sampling, which is relatively easy and inexpensive to collect and analyze, could be helpful in identifying an optimal time for performing metabolic imaging if similar patterns can be detected in patients. As mentioned previously, the observed plasma lactate peak in mice prior to target organ infiltration could be related to the high number of circulating activated T cells producing and exporting lactate.66 Expanded prospective single-cell RNAseq of PBMCs early post-HSCT may clarify pertinent metabolic shifts in the T-cell compartment prior to disease onset. We show preliminary transcriptomic evidence of increased T-cell activation in the PBMC sample of a patient who subsequently developed acute GVHD. The observed high expression of SLC2A3 (GLUT3) was also seen in our preclinical model and by others at early GVHD time points, indicating that further evaluation of glycolytic metabolism, including via metabolic imaging, may be useful in patients at risk for GVHD.47 Given the very limited sample size, no definitive conclusions can be drawn from our clinical samples. Nevertheless, a larger sample size and a time-course evaluation of the immunometabolic transcriptome in the post-HSCT setting are warranted given our findings.
Finally, therapeutic targeting of upregulated glycolysis is a promising strategy for modulating overactive immunity that characterizes GVHD and other T-cell–mediated conditions. Several steps in the glycolytic pathway have already been inhibited to augment T-cell function in auto- and alloimmune diseases,47,48,53,67,68 and 13C-pyruvate imaging can be used to detect responses to glycolytic inhibitors.69,70 Noninvasive and nonradioactive approaches to guide clinical decisions are needed, and this methodology offers a promising new tool for the post-HSCT setting. It has the potential to not only detect GVHD in a noninvasive manner but also illuminate in vivo metabolic shifts that are amenable to therapeutic targeting.
Mouse RNA sequencing data have been uploaded to the Gene Expression Omnibus database (GSE153591 for the scRNA seq of mouse syn and allo CD4 T cells, GSE147371 for the bulkRNA seq of allo CD4 T cell subsets). Patient sequencing data have been uploaded to dbGaP (phs002021.v1.p1 for the human scRNAseq of PBMCs).
The publication costs of this article were defrayed in part by page charge payment. Therefore, and solely to indicate this fact, this article is hereby marked “advertisement” in accordance with 18 USC section 1734.
The online version of this article contains a data supplement.
Acknowledgments
The authors are grateful to Devorah Gallardo for expert assistance during animal experiments, Catherine Bare for performing irradiation on animals, and they acknowledge Kevin Hu for helping with the collection of samples for the intracellular metabolomic profile. The authors are grateful to Veena Kapoor and William Telford of the Experimental Transplantation and Immunology Brand (ETIB) Flow Cytometry Core Facility for performing FACS purifications and to Jeremy Rose of ETIB Clinical Core for help with selecting clinical samples from NCT00520130. The authors thank the National Institutes of Health (NIH) Intramural Sequencing Center (NISC) and National Cancer Institute (NCI) Single Cell Analysis Facility (SCAF) for their technical support.
This work was supported by intramural funding from NIH/NCI, including the CCR Major Metabolic Opportunity Program. Support from CCR Single Cell Analysis Facility was funded by Frederick National Laboratory for Cancer Research (FNLCR) Contract HHSN261200800001E. Sequencing was performed with the CCR Genomics Core. This work used the computational resources of the NIH High-Performance Computing (HPC) Biowulf cluster (http://hpc.nih.gov). The graphical abstract was, in part, created with images adapted from Servier Medical Art by Servier with original images licensed under a Creative Commons Attribution 3.0 Unported License.
This article reflects the views of the authors and should not be construed to represent NIH or Food and Drug Administration views or policies. The funders had no role in study design, data collection and analysis, decision to publish, or preparation of the manuscript.
Authorship
Contribution: N.P.B. conceived, designed, and supervised the study; N.M., B.O., D.E.F., and N.P.B. collected samples for the intracellular metabolic screen; C.S., N.M., and N.P.B. carried out the metabolic flux assays; C.J.R., T.J.M., K.A.W., N.M., J.C.A., and N.P.B. generated and analyzed the RNAseq data; K.S. carried out the 13C-hyperpolarized MRI; K.A.W., J.C.A., and N.P.B. collected, and D.E.F. quantified, the plasma lactate levels; K.A.W. and J.C.A. performed the flow cytometric analyses; K.A.W., J.C.A., and N.P.B. generated samples for scRNAseq; J.C.A. analyzed the scRNAseq data; S.Z.P. provided the patient samples; M.C.K., W.M.L., and R.E.G. provided critical instruments and reagents; J.C.A. and N.P.B. wrote the manuscript; and all authors contributed to the editing and approved the final manuscript.
Conflict-of-interest disclosure: The authors declare no competing financial interests.
Correspondence: Nataliya P. Buxbaum, Experimental Transplantation and Immunotherapy Branch, National Cancer Institute, 10 Center Dr, Building 10-CRC, Room 3E3330, Bethesda, MD 20892-1203; e-mail: nbuxbaum@mail.nih.gov.

This feature is available to Subscribers Only
Sign In or Create an Account Close Modal