

Key Points
HTLV-1 infection-specific regional DNA hypermethylation reflects disease development and progression of adult T-cell leukemia-lymphoma.
OR-2100, a novel decitabine prodrug with enhanced oral bioavailability, exerts potent anti-ATL activity through DNA hypomethylation.

Abstract
Adult T-cell leukemia-lymphoma (ATL) is an aggressive hematological malignancy of CD4+ T cells transformed by human T-cell lymphotropic virus-1 (HTLV-1). Most HTLV-1–infected individuals are asymptomatic, and only 3% to 5% of carriers develop ATL. Here, we describe the contribution of aberrant DNA methylation to ATL leukemogenesis. HTLV-1–infected T-cells and their uninfected counterparts were separately isolated based on CADM1 and CD7 expression status, and differentially methylated positions (DMPs) specific to HTLV–infected T cells were identified through genome-wide DNA methylation profiling. Accumulation of DNA methylation at hypermethylated DMPs correlated strongly with ATL development and progression. In addition, we identified 22 genes downregulated because of promoter hypermethylation in HTLV-1–infected T cells, including THEMIS, LAIR1, and RNF130, which negatively regulate T-cell receptor (TCR) signaling. Phosphorylation of ZAP-70, a transducer of TCR signaling, was dysregulated in HTLV-1–infected cell lines but was normalized by reexpression of THEMIS. Therefore, we hypothesized that DNA hypermethylation contributes to growth advantages in HTLV-1–infected cells during ATL leukemogenesis. To test this idea, we investigated the anti-ATL activities of OR-1200 and OR-2100 (OR21), novel decitabine (DAC) prodrugs with enhanced oral bioavailability. Both DAC and OR21 inhibited cell growth, accompanied by global DNA hypomethylation, in xenograft tumors established by implantation of HTLV-1–infected cells. OR21 was less hematotoxic than DAC, whereas tumor growth inhibition was almost identical between the 2 compounds, making it suitable for long-term treatment of ATL patient-derived xenograft mice. Our results demonstrate that regional DNA hypermethylation is functionally important for ATL leukemogenesis and an effective therapeutic target.
Introduction
Adult T-cell leukemia-lymphoma (ATL) patients are concentrated in human T-cell lymphotropic virus-1 (HTLV-1) endemic areas, including Japan, South America, the Caribbean, intertropical Africa, and the Middle East. ATL was the first recognized retrovirus-induced human malignancy.1 Although ∼20 million people are infected with HTLV-1 worldwide, most HTLV-1–infected individuals are symptomless, and only 3% to 5% of HTLV-1–positive carriers develop ATL.2 Understanding how ATL leukemogenesis progresses could advance development of effective treatments for the ∼12% of human cancers caused by infections with oncoviruses because these cancers show common traits.3
Following HTLV-1 infection, it takes decades for carriers to develop ATL. There are 4 clinical subtypes of ATL: smoldering, chronic, acute, and lymphoma.4 Although smoldering and chronic ATL are relatively indolent (4-year overall survival rates, 52% and 36%, respectively4 ), about one-half progress to aggressive ATL subtypes (acute and lymphoma; 4-year overall survival rates, 11% and 16%, respectively4 ). HTLV-1–infected T cells undergo multistep leukemogenesis, with accumulation of genetic abnormalities, including activating alterations in T-cell receptor (TCR) signaling pathway5,6 and epigenetic abnormalities.5,7-9
Several genes, including CDKN2A,10 KLF4,8 and BMP6,11 among others, are abnormally methylated in peripheral blood mononuclear cells (PBMCs) from patients with ATL, and methylation at some of these loci reflects disease progression.5,9 Various factors, including aging, differentiation, and environmental stress, can alter DNA methylation patterns in mammalian cells, including T cells.12,13 To identify DNA methylation changes that occur specifically in HTLV-1–infected T cells at an early stage of multistep carcinogenesis, we carefully isolated HTLV-1–infected T cells and their uninfected counterparts, based on CADM1 and CD7 expression status, which reflect ATL disease development and progression.14-16 We found that regional DNA hypermethylation occurred specifically in HTLV-1–infected cells, and that its accumulation correlated with disease progression. To determine whether DNA hypermethylation confers growth advantages on HTLV-1–infected cells, and thus acts as a driver of ATL leukemogenesis, we investigated the efficacy of DNA demethylating agents, including the novel decitabine prodrugs, which have the potential to be orally available.
DNA demethylating agents, such as azacitidine (AZA) and decitabine (DAC), are used for the clinical treatment of acute myeloid leukemia and myelodysplastic syndrome. Because both drugs are rapidly degraded by cytidine deaminase (CDA), and hence not suitable for oral administration, a second-generation demethylating agent, SGI-110, a dinucleotide of DAC and deoxyguanosine, has been developed.17,18 Although SGI-110 is resistant to CDA, it is administered by subcutaneous injection. Because ATL leukemogenesis has a long latency period, orally bioavailable DNA demethylating agents have potentially great clinical benefit. To enable oral administration of DAC, combination drug treatment of patients with myelodysplastic syndrome and chronic myelomonocytic leukemia using decitabine and cedazuridine, a novel CDA inhibitor, administered orally as a fixed-dose combination (ASTX727), has recently succeeded in improving DAC bioavailability.19 Here, we examined the anti-ATL effects of the novel DNA demethylating agents, OR-1200 and OR-2100, which are next-generation DAC prodrugs, with enhanced bioavailability.20
Materials and methods
Human samples
All studies using human samples were performed in accordance with the guidelines set out in the Declaration of Helsinki and approved by the Saga University Institutional Review Board (2018-03-02). PBMCs were isolated from peripheral blood samples from healthy volunteers, HTLV-1 carriers, and patients with ATL by gradient centrifugation using lymphocyte separation medium (MP Biomedical). All HTLV-1 carriers and ATL patients provided written informed consent.
Mice
Animal studies were conducted in accordance with Saga University–approved animal protocols at Saga University (29-023-0), in accordance with German Animal Welfare Act. Immunodeficient Balb/c Rag-2−/−Jak3−/− mice, which lack mature T- and B-lymphocytes and natural killer cells,21 were provided by Seiji Okada (Kumamoto University, Kumamoto, Japan).
HTLV-1–infected human T-cell lines
Eleven different HTLV-1–infected human T-cell lines were used. MT-1, MT-2, and MT-4 were from the JCRB Cell Bank; ATN-1, ILT-Mat, and TL-Mor were from the RIKEN Bio Resource Center; MJ was from ATCC; ST-1, KOB, and KK-1 were provided by Yasuaki Yamada (Nagasaki University, Nagasaki, Japan); and TL-Om1 was provided by Masao Matsuoka (Kumamoto University). ST-1, MT-1, MT-2, MT-4, TL-Om1, TL-Mor, and MJ cells were cultured in RPMI-1640 (Sigma-Aldrich) containing 10% fetal bovine serum (FBS). ATN-1 cells were maintained in RPMI-1640 containing 10% FBS and 1% nonessential amino acids (Gibco). KOB, KK-1, and ILT-Mat cells were cultured in RPMI-1640 containing 10% FBS and 50 ng/mL recombinant human IL2 (R&D Systems).
Reagents, antibodies, and oligonucleotides
AZA and DAC were from Sigma-Aldrich. OR-1200 (OR12) and OR-2100 (OR21) were from OHARA Pharmaceutical Co. Antibodies and oligonucleotides are listed in supplemental Methods available on the Blood Web site.
Flow cytometry and sorting
Cells were stained at room temperature in PBS(−) (Wako) plus 2% FBS, and sorted using a FACSAriaII (BD Biosciences). Fix & Perm Medium A and B (Life Technologies) were used for staining the cytosolic protein, THEMIS, and phosphorylated ZAP-70. Flow cytometry data were analyzed with the FlowJo software (Becton Dickinson & Company).
Comprehensive DNA methylation analysis
Genomic DNA was extracted from sorted PBMCs and cell lines using a QIAamp DNA Mini Kit (Qiagen). DNA methylation was analyzed using the Infinium HumanMethylation450 BeadChip (Illumina) or the Infinium MethylationEPIC BeadChip (Illumina). The resulting raw data were analyzed using MACON, a bioinformatics tool for the Illumina Infinium Human DNA methylation BeadArray, as described previously.22,23 The methylation level of a CpG site was represented by a β value, which ranged from 0 (completely unmethylated) to 1 (completely methylated), and evaluated by comparison with the average β values for CpG sites. A differentially methylated position was considered hypermethylated when its β value in the N subpopulation was ≥0.2, and hypomethylated when its β value was ≤−0.2, compared with that of the P subpopulation.
Cluster analysis
Unsupervised hierarchical clustering analysis was performed using R v3.4.4. with the Heatplus package, as described previously.24 The Euclidean distance was used as the distance function both for samples and genes. Because of the limitations of the calculation algorithm for hierarchical clustering, a maximum of 20 000 CpG data points could be analyzed.
Cell growth assay
Cell growth of HTLV-1–infected human T-cell lines was measured using a Cell Counting Kit-8 (CCK-8) (Dojindo Molecular Technology) 4 days after cultivation in the presence of compounds; each compound was added every 2 days. Fifty percent inhibitory concentration values were calculated for each compound, as described previously.25
Bisulfite pyrosequencing
Bisulfite conversion of genomic DNA was performed using an EZ DNA Methylation Kit (Zymo Research). The methylation status of CpG sites in the promoter proximal region of LINE-1, THEMIS, LAIR1, and CD7 was determined using pyrosequencing-based analysis as described in detail in supplemental Methods.
Western blot analysis
Whole cell lysates were extracted using RIPA buffer (Santa Cruz Biotechnology). Total protein content was quantified using a protein assay (Bio-Rad). Equal amounts of each whole cell lysate were resolved in ν-polyacrylamide gel (Invitrogen) and transferred onto nitrocellulose membranes. Proteins were detected using the Odyssey imaging system (LI-COR Biosciences).
Quantitative real-time PCR
Cells were lysed in TRIzol (Invitrogen), and total RNA was purified using Direct-zol RNA MiniPrep Kits (Zymo Research). cDNA was produced using ReverTra Ace (TOYOBO), and quantitative real-time polymerase chain reaction (PCR) was performed using TaqMan Gene Expression Master Mix (Applied Biosystems). Gene expression level of ACTB was used as an internal control.
Lentivirus preparation and infection
Lentiviral particles for transduction of THEMIS cDNA (VB190514-1219adv, pLV[Exp]-Neo-EF1A>hTHEMIS[NM_001164685.1]:IRES:EGFP) and control GFP/mCherry lentiviral particles (VB160109-10005, pLV[Exp]-EGFP:T2A:Puro-EF1A>mCherry) were prepared by VectorBuilder. HTLV-1–infected cell lines were infected by lentiviral particles using RetroNectin (Takara). GFP+ cells were isolated on a FACSAriaII and used for subsequent experiments.
HTLV-1–infected T-cell xenograft mouse model
MT-2 cells were subcutaneously inoculated into 8-week-old female Balb/c Rag-2−/−Jak3−/− mice. Treatment of mice with compounds was initiated when the average xenograft tumor volume reached 100 mm3. A total of 1.25 mg/kg (5.5 µmol/kg) of DAC (n = 7), 1.34 mg/kg (5.5 µmol/kg) of AZA (n = 7), 3.39 mg/kg (9.9 µmol/kg) of OR21 (n = 7), or 10% HP-β-CD as a vehicle control (n = 7) was injected intraperitoneally twice per week. Tumor volumes, defined as (short axis)2 × (long axis)/2, were measured twice per week. All mice were euthanized 22 days after first treatment. Xenograft tumors isolated from each mouse were minced and genomic DNA was extracted using a QIAamp DNA Mini Kit (Qiagen). Cell counts in peripheral blood were determined using an MEK-6500 Celltacα (NIHON KOHDEN). Neutrophils were measured by staining PBMCs with anti-CD11b and anti-Ly-6G antibodies.
ATL patient-derived xenograft mouse model
PBMCs were isolated from a patient with chronic ATL and inoculated intraperitoneally into 7-week-old female Balb/c Rag-2−/−Jak3−/− mice. Treatment of mice with OR21 was initiated 5 days after inoculation. A total of 1.88 mg/kg (5.5 µmol/kg) of OR21 (n = 5) or 10% HP-β-CD as vehicle control (n = 4) was injected intraperitoneally twice per week. Moribund mice with body weight loss were sacrificed, and intraperitoneal tumor cells were minced and then subjected to flow cytometry analysis.
Statistics
Data are expressed as mean ± standard deviation (SD). Differences between groups were tested using the Tukey-Kramer method. Results were considered significant when a value of P < .05 was obtained by 2-sided test. All calculations were performed using R v.3.4.4 (The R Foundation for Statistical Computing, Vienna, Austria) or EZR (a graphical user interface for R26 ; Saitama Medical Center, Jichi Medical University, Saitama, Japan).
Results
Global DNA hypomethylation occurs in HTLV-1–infected T cells during early stage ATL leukemogenesis
To understand the importance of DNA methylation to ATL leukemogenesis, we isolated HTLV-1–infected cells and normal T cells from 3 young (31-37 years of age) and 6 older (63-85 years of age) healthy volunteers, asymptomatic HTLV-1 carriers (ACs), and patients with smoldering, chronic, and acute ATL (supplemental Table 1), based on CADM1 and CD7 expression status. HTLV-1–infected cells are highly enriched for CADM1+ cells,14,15 and the P (CADM1−/CD7+) subpopulation (normal T cells) progress into the N (CADM1+/CD7−) via the D (CADM1+/CD7dim+) subpopulation, according to HTLV-1 infection and disease progression (Figure 1A-B; supplemental Figure 1). Hierarchical clustering analysis of DNA methylation profiles distinguished between HTLV-1–infected cells (D and N subpopulations) and normal T cells (P subpopulation) (Figure 1C). Although our data clearly demonstrated that global DNA hypomethylation in HTLV-1–infected cells was initiated at the asymptomatic carrier stage, there were no significant differences between subpopulation D and N or ATL clinical subtypes in each subpopulation (Figure 1C-D), indicating that global DNA methylation profiles do not reflect ATL disease progression.

Global DNA hypomethylation occurs in cells infected with HTLV-1. (A) Representative flow cytometric analysis of PBMCs isolated from a patient with chronic ATL. P, CADM1−/CD7+ (blue); D, CADM1+/CD7dim+ (yellow); N, CADM1+/CD7− (red). (B) Proportion of each cell subpopulation (P, D, and N) in the CADM1 vs CD7 plots of healthy volunteers, asymptomatic carriers, and patients with smoldering, chronic, and acute ATL. (C) Unsupervised hierarchical clustering analysis of DNA methylation profiles of 20 000 CpG probes chosen at random from 470 870 probes, which were CpG sites on autosomes and not on the sex chromosomes, and non-CpG probes. yHC, young healthy volunteer; aHC, aged healthy volunteer; AC, asymptomatic carrier; S, smoldering ATL; C, chronic ATL; A, acute ATL. DNA methylation analysis of HTLV-1–infected cell lines (MT-2, ST-1, KOB, KK-1, and ATN-1) was performed without sorting because the CADM1/CD7 expression pattern indicated that they were single-cell populations. (D) Average β values of the 470 870 probes in each cell subpopulation from individuals and HTLV-1–infected T-cell lines. Differences between each subpopulation were tested using the Tukey-Kramer method. *P < .05.
Global DNA hypomethylation occurs in cells infected with HTLV-1. (A) Representative flow cytometric analysis of PBMCs isolated from a patient with chronic ATL. P, CADM1−/CD7+ (blue); D, CADM1+/CD7dim+ (yellow); N, CADM1+/CD7− (red). (B) Proportion of each cell subpopulation (P, D, and N) in the CADM1 vs CD7 plots of healthy volunteers, asymptomatic carriers, and patients with smoldering, chronic, and acute ATL. (C) Unsupervised hierarchical clustering analysis of DNA methylation profiles of 20 000 CpG probes chosen at random from 470 870 probes, which were CpG sites on autosomes and not on the sex chromosomes, and non-CpG probes. yHC, young healthy volunteer; aHC, aged healthy volunteer; AC, asymptomatic carrier; S, smoldering ATL; C, chronic ATL; A, acute ATL. DNA methylation analysis of HTLV-1–infected cell lines (MT-2, ST-1, KOB, KK-1, and ATN-1) was performed without sorting because the CADM1/CD7 expression pattern indicated that they were single-cell populations. (D) Average β values of the 470 870 probes in each cell subpopulation from individuals and HTLV-1–infected T-cell lines. Differences between each subpopulation were tested using the Tukey-Kramer method. *P < .05.
Regional DNA hypermethylation around transcription start sites reflects ATL disease progression
To identify differentially methylated positions (DMPs) reflecting ATL disease status, the DNA methylation profile of the P subpopulation was compared with that of the N subpopulation in patients with smoldering and chronic ATL. We identified 12 025 hypermethylated and 33 581 hypomethylated DMPs specific to the HTLV-1–infected subpopulation and common to all 7 ATL cases tested. According to unsupervised clustering analysis, based on the methylation profiles of the 12 025 hypermethylated and 33 581 hypomethylated DMPs, the methylation profiles of hypermethylated DMPs, but not those of hypomethylated DMPs, differed between aggressive and indolent ATL subtypes, and could be used to distinguish them (supplemental Figure 2A-D). Therefore, our further study focused on hypermethylated DMPs.
Because DNA methylation status around transcription start sites (TSSs) influences gene expression regulation, we extracted 1207 hypermethylated DMPs in CpG islands (CGIs) in regions from the TSS to −200 bp upstream thereof (TSS200). Analysis of these 1207 DMPs indicated that all P subpopulations grouped in the same cluster with the lowest methylation level, whereas changes from subpopulation P to D and from D to N, indicating ATL disease progression, were correlated with stepwise increases in methylation (Figure 2A-B). Methylation levels at these HTLV-1–specific hypermethylated DMPs in TSS200 CGI clearly distinguished N subpopulations in indolent ATLs from those in aggressive ATL. Next, serial changes in CD4+ cell subpopulations and abnormal lymphocytes were monitored in 2 ACs. The P subpopulation percentage gradually decreased, whereas those of subpopulation N and abnormal lymphocytes increased, during ATL development from AC to smoldering ATL (Figure 2C). Although global DNA methylation levels remained unchanged, TSS200 CGI DMP hypermethylation levels significantly increased in N subpopulations isolated after ATL onset (Figure 2D).
![Regional DNA hypermethylation reflects ATL disease development and progression. (A) Unsupervised hierarchical clustering analysis using DNA methylation profiles of 1207 hypermethylated DMPs common to all 7 indolent ATL cases. (B) Average β values of the 1207 probes in each cell subpopulation (P, CADM1−/CD7+ [blue]; D, CADM1+/CD7dim+ [yellow]; N, CADM1+/CD7− [red]) from individuals and HTLV-1–infected T-cell lines (black). Differences between each subpopulation were tested using the Tukey-Kramer method. **P < .005. (C) Serial changes in the proportions of each subpopulation (P, CADM1−/CD7+ [blue]; D, CADM1+/CD7dim+ [yellow]; N, CADM1+/CD7− [red]) in CADM1 vs CD7 plots, and percentages of abnormal lymphocytes (black) in 2 asymptomatic carriers (ACs). Cell sorting and DNA extraction were performed before and after ATL development, as indicated by the black arrows. (D) Average β value of 470 870 probes (global DNA methylation) and 1207 probes (extracted DMPs in panel A) in ACs before and after ATL onset.](https://ash.silverchair-cdn.com/ash/content_public/journal/blood/136/7/10.1182_blood.2019003084/3/m_bloodbld2019003084f2.png?Expires=1767801439&Signature=h38pZEHdiH-9CbJ1vYtpcsuKGIF2Mj8gmKY7n1PpsH1iy26ilekv5JIqsufz8cgyeSRFlXcW-hwEK50cUW~V2EmqSBRPiCuu2iF49t2ZxgFYXZcJ-a~NX9td5qz-XBpb6qLprWxSooMBkG4qjlwz~wKmyMfIfqJlyQDAjpoZrLLgnGH6bFiVoeN4qYPVllvNmu0TReNW-q5W1iUj2Lcs-qql3JTRY~quNmkpTap0FKeds3pZXuSobwwT3soTmiikqjJmOtnCZmCcWCDUzQ09AiDmSctCRKxmUPaJqK8PSE~qDTFt56-F5rio6GtYiT4NrgqcSq7gQFIFjF3aG53nog__&Key-Pair-Id=APKAIE5G5CRDK6RD3PGA)
Regional DNA hypermethylation reflects ATL disease development and progression. (A) Unsupervised hierarchical clustering analysis using DNA methylation profiles of 1207 hypermethylated DMPs common to all 7 indolent ATL cases. (B) Average β values of the 1207 probes in each cell subpopulation (P, CADM1−/CD7+ [blue]; D, CADM1+/CD7dim+ [yellow]; N, CADM1+/CD7− [red]) from individuals and HTLV-1–infected T-cell lines (black). Differences between each subpopulation were tested using the Tukey-Kramer method. **P < .005. (C) Serial changes in the proportions of each subpopulation (P, CADM1−/CD7+ [blue]; D, CADM1+/CD7dim+ [yellow]; N, CADM1+/CD7− [red]) in CADM1 vs CD7 plots, and percentages of abnormal lymphocytes (black) in 2 asymptomatic carriers (ACs). Cell sorting and DNA extraction were performed before and after ATL development, as indicated by the black arrows. (D) Average β value of 470 870 probes (global DNA methylation) and 1207 probes (extracted DMPs in panel A) in ACs before and after ATL onset.
Regional DNA hypermethylation reflects ATL disease development and progression. (A) Unsupervised hierarchical clustering analysis using DNA methylation profiles of 1207 hypermethylated DMPs common to all 7 indolent ATL cases. (B) Average β values of the 1207 probes in each cell subpopulation (P, CADM1−/CD7+ [blue]; D, CADM1+/CD7dim+ [yellow]; N, CADM1+/CD7− [red]) from individuals and HTLV-1–infected T-cell lines (black). Differences between each subpopulation were tested using the Tukey-Kramer method. **P < .005. (C) Serial changes in the proportions of each subpopulation (P, CADM1−/CD7+ [blue]; D, CADM1+/CD7dim+ [yellow]; N, CADM1+/CD7− [red]) in CADM1 vs CD7 plots, and percentages of abnormal lymphocytes (black) in 2 asymptomatic carriers (ACs). Cell sorting and DNA extraction were performed before and after ATL development, as indicated by the black arrows. (D) Average β value of 470 870 probes (global DNA methylation) and 1207 probes (extracted DMPs in panel A) in ACs before and after ATL onset.
Negative regulators of TCR signaling are downregulated in HTLV-1–infected cells through promoter DNA hypermethylation
To identify hypermethylated genes functionally implicated in the growth advantages of HTLV-1–infected cells, gene expression profiles, previously reported,15 and DNA methylation profiles from this study were compared. We identified 22 genes whose expression was downregulated concomitant with DMP hypermethylation (Figure 3A-C). Both DMP methylation and gene expression profiles revealed that D subpopulations from asymptomatic carriers and smoldering ATL patients clustered separately from the D subpopulation of chronic ATL patients, as well as from the N subpopulations (Figure 3B; supplemental Figure 3A). This suggested that promoter CpG methylation at the 22 genes differed substantially according to ATL disease status. However, the N subpopulation from 1 acute ATL patient clustered with N subpopulations from asymptomatic carriers and indolent ATL patients (Figure 3B). We believe that the N subpopulation of some HTLV-1–infected individuals at the early phase of ATL leukemogenesis already contain a specific subclone, which will subsequently expand, in which the promoter regions of these 22 genes are highly methylated. We focused on the genes, THEMIS,27,28 LAIR1,29 and RNF130,30,31 which may negatively regulate TCR signaling (supplemental Figure 3B) because a number of somatic alterations activating TCR-nuclear factor-κB signaling have been identified5 and the nuclear factor-κB pathway is a druggable target in ATL.32 THEMIS and LAIR1 protein levels decreased stepwise from the D and N subpopulations, relative to the P subpopulation, in PBMCs from patients with smoldering ATL (Figure 3D). The amount of PD-1 protein tended to be upregulated in D and N subpopulations, compared with P subpopulations (Figure 3D), indicating TCR signaling pathway activation33 in HTLV-1–infected cells. Downregulation of THEMIS, LAIR1, and RNF130 gene expression was also observed in HTLV-1–infected T-cell lines (supplemental Figure 3C). Thus, we propose that downregulation of TCR regulators through promoter hypermethylation occurs in response to HTLV-1 infection and dysregulates TCR signaling.
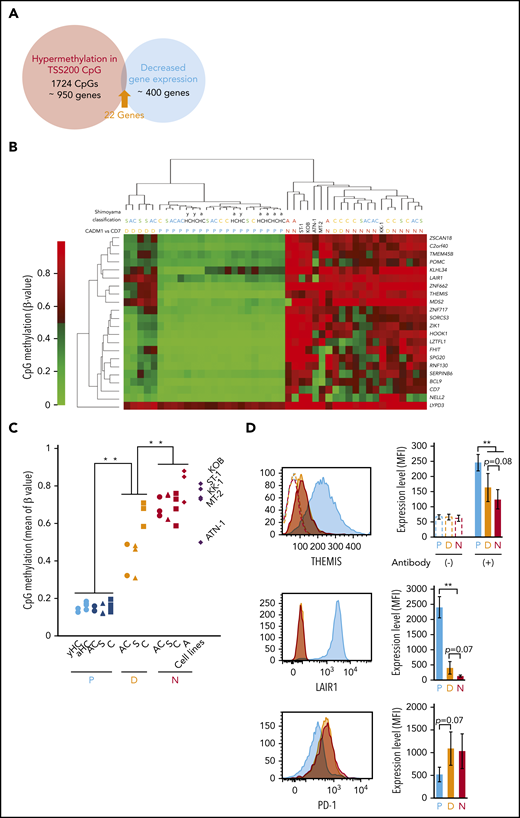
Inhibition of TCR signaling pathway negative regulators by DNA hypermethylation. (A) Venn diagram showing 22 genes that overlap between samples with HTLV-1–specific hypermethylated DMPs and those with expression decreased twofold or more in HTLV-1–infected cells in the gene expression data set, GSE55851. (B) Unsupervised hierarchical clustering analysis of the 22 extracted genes, using DNA methylation data (CpG probes used for unsupervised hierarchical clustering analysis are listed in supplemental Table 2). (C) Average β values of the 45 probes for the 22 extracted genes in each cell subpopulation from individuals and HTLV-1–infected T-cell lines. (D) Representative flow cytometric analysis of THEMIS, LAIR1, and PD-1, showing the amount of protein expression in P (blue), D (yellow), and N (red) cell subpopulations from a patient with smoldering ATL (left) and the average mean fluorescence intensity (MFI; right).
Inhibition of TCR signaling pathway negative regulators by DNA hypermethylation. (A) Venn diagram showing 22 genes that overlap between samples with HTLV-1–specific hypermethylated DMPs and those with expression decreased twofold or more in HTLV-1–infected cells in the gene expression data set, GSE55851. (B) Unsupervised hierarchical clustering analysis of the 22 extracted genes, using DNA methylation data (CpG probes used for unsupervised hierarchical clustering analysis are listed in supplemental Table 2). (C) Average β values of the 45 probes for the 22 extracted genes in each cell subpopulation from individuals and HTLV-1–infected T-cell lines. (D) Representative flow cytometric analysis of THEMIS, LAIR1, and PD-1, showing the amount of protein expression in P (blue), D (yellow), and N (red) cell subpopulations from a patient with smoldering ATL (left) and the average mean fluorescence intensity (MFI; right).
Rescue of THEMIS protein expression changes phosphorylation of ZAP-70, a transducer of TCR signaling
ZAP-70 is a protein tyrosine kinase that transduces TCR signaling. Phosphorylation of ZAP-70 is experimentally induced by treatment with hydrogen peroxide. Although phosphorylation was transiently induced in normal T cells (Figure 4A-B), it was weak and prolonged in HTLV-1–infected cell lines (supplemental Figure 4A). On the other hand, in the Jurkat cell line, which was derived from a T-cell acute lymphoblastic leukemia patient and normally expresses the THEMIS, LAIR1, and RNF130 genes (supplemental Figure 3C), we observed strong transient phosphorylation of ZAP-70 (supplemental Figure 4A-B).

Regulation of TCR signaling by THEMIS. (A) Phosphorylation of ZAP-70 induced by treatment with 20 mM hydrogen peroxide in CD4+ T cells, as determined by intracellular flow cytometry. (B) Average mean fluorescence intensity of phosphorylated ZAP-70 in CD4+ T cells, exhibiting transient phosphorylation after hydrogen peroxide treatment. Data are expressed as means of 3 independent individuals with SD. (C) Experimental protocol for establishment of HTLV-1–infected cell lines exogenously expressing THEMIS and induction of ZAP-70 phosphorylation. (D) Immunoblots showing changes in the phosphorylation pattern of ZAP-70. TL-Om1 cells exogenously expressing THEMIS were isolated and treated with hydrogen peroxide for the indicated times. (E) Immunoblots showing downregulation of phosphorylation of PLCγ1 in MT-2 cells by exogenously expressed THEMIS under normal growth conditions.
Regulation of TCR signaling by THEMIS. (A) Phosphorylation of ZAP-70 induced by treatment with 20 mM hydrogen peroxide in CD4+ T cells, as determined by intracellular flow cytometry. (B) Average mean fluorescence intensity of phosphorylated ZAP-70 in CD4+ T cells, exhibiting transient phosphorylation after hydrogen peroxide treatment. Data are expressed as means of 3 independent individuals with SD. (C) Experimental protocol for establishment of HTLV-1–infected cell lines exogenously expressing THEMIS and induction of ZAP-70 phosphorylation. (D) Immunoblots showing changes in the phosphorylation pattern of ZAP-70. TL-Om1 cells exogenously expressing THEMIS were isolated and treated with hydrogen peroxide for the indicated times. (E) Immunoblots showing downregulation of phosphorylation of PLCγ1 in MT-2 cells by exogenously expressed THEMIS under normal growth conditions.
We transduced the TL-Om1 cell line, derived from a patient with acute ATL, with a lentiviral vector expressing the THEMIS gene (Figure 4C). TL-Om1 cells infected with vector control lentivirus exhibited prolonged phosphorylation of ZAP-70 after treatment with hydrogen peroxide, whereas TL-Om1 cells exogenously expressing THEMIS protein exhibited a transient induction of ZAP70 phosphorylation, as did normal T cells (Figure 4D). Phosphorylation of PLCγ1, a downstream effector of ZAP-70, was constitutively activated in another HTLV-1–infected cell line, MT-2, but reexpression of THEMIS decreased PLCγ1 phosphorylation (Figure 4E).
Treatment of ATL cells lines with DNA demethylating agents inhibits cell growth accompanied by decreased DNA methylation
Based on these results, we propose that regional DNA hypermethylation associated with ATL disease development and progression (supplemental Figure 5) contributes to growth of HTLV-1–infected cells, and that DNA demethylation efficiently suppresses tumor cell growth. However, the DNA demethylating agents currently available in the clinic, such as AZA and DAC, can only be administered by injection.34 Hence, we compared the anti-ATL activities of AZA and DAC with those of 2 novel, orally bioavailable DNA demethylating agents, OR-2100 (OR21) and OR-1200 (OR12), which were identified using a high-throughput assay based on DNA demethylating activity.20
OR12 and OR21 release DAC 5′-monophosphate and DAC, respectively (Figure 5A). DAC and OR21 suppressed the growth of HTLV-1–infected T-cell lines more effectively than OR12 and AZA (Figure 5B). Although DAC was less efficacious in MT-1 than in the other cell lines, longer term treatment still strongly suppressed the growth of MT-1 cells (data not shown). To measure DNA demethylating activity, DNA methylation at long interspersed nuclear element-1 (LINE-1), a surrogate marker for global DNA methylation status,35 was determined (supplemental Figure 6A). Although the efficacy of DAC and OR21 was not correlated with basal LINE-1 methylation levels (supplemental Figure 6B), treatment with DAC and OR21 markedly decreased LINE-1 methylation levels and amounts of DNMT1 protein (Figure 5C-D). As expected, DAC and OR21 treatment significantly rescued expression of 6 among 22 genes with levels downregulated concomitant with DMP hypermethylation (Figure 5E). Promoter DNA hypermethylation and enhanced gene expression induced by DNA demethylation of THEMIS were confirmed in HTLV-1–infected cell lines (supplemental Figure 7A-D). Treatment of MT-2 cells with DAC and OR21 also resulted in demethylation of the promoter CpGs of LAIR1 and CD7, and increased the protein expression of LAIR1 (supplemental Figure 8A-B). Notably in this regard, phosphorylation of PLCγ1 was suppressed by treatment with DAC and OR21 because it was by reexpression of THEMIS protein, as shown in Figure 4E (supplemental Figure 8C).
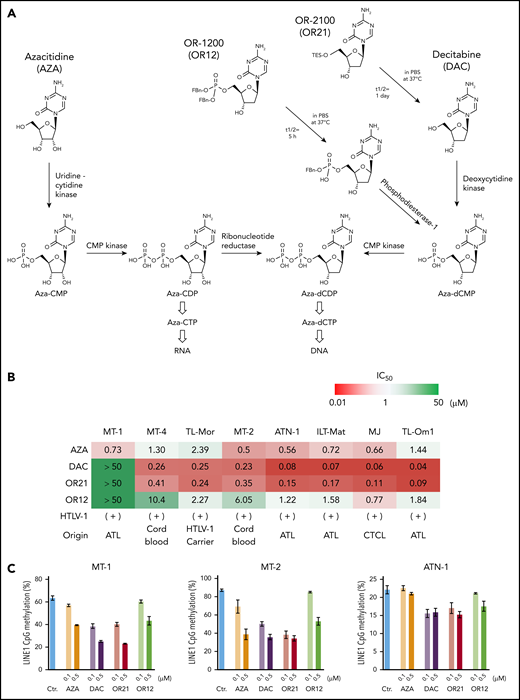
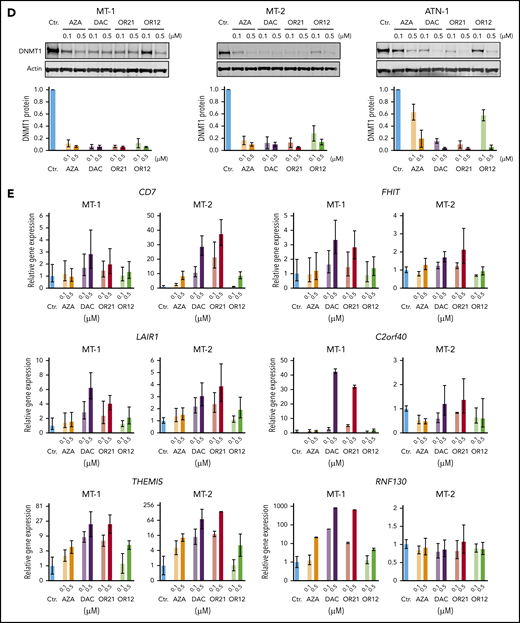
Anti-ATL effects of DNA demethylating agents in vitro. (A) Chemical structures and metabolic pathways of AZA, DAC, OR-1200 (OR12), and OR-2100 (OR21). (B) Fifty percent inhibitory concentration values of each compound in HTLV-1–infected T-cell lines treated with them for 4 days, determined by CCK-8 assay. Data are expressed as means of 3 independent experiments. (C) DNA methylation levels in LINE-1 regions determined by bisulfite pyrosequencing of HTLV-1–infected T-cell lines treated with the indicated compounds for 4 days. Data are expressed as means of 3 independent experiments with SD. (D) Immunoblots showing the levels of DNMT1 protein reduction in HTLV-1–infected T-cell lines after treatment with the indicated compounds for 4 days. Graphs show the mean fold-decrease (± SD) in DNMT1 protein compared with untreated cells, based on data from 3 independent experiments. (E) Gene expression levels of CD7, FHIT, C2orf40, THEMIS, LAIR1, and RNF130 in MT-1 and MT-2 cells after treatment with the indicated compounds.
Anti-ATL effects of DNA demethylating agents in vitro. (A) Chemical structures and metabolic pathways of AZA, DAC, OR-1200 (OR12), and OR-2100 (OR21). (B) Fifty percent inhibitory concentration values of each compound in HTLV-1–infected T-cell lines treated with them for 4 days, determined by CCK-8 assay. Data are expressed as means of 3 independent experiments. (C) DNA methylation levels in LINE-1 regions determined by bisulfite pyrosequencing of HTLV-1–infected T-cell lines treated with the indicated compounds for 4 days. Data are expressed as means of 3 independent experiments with SD. (D) Immunoblots showing the levels of DNMT1 protein reduction in HTLV-1–infected T-cell lines after treatment with the indicated compounds for 4 days. Graphs show the mean fold-decrease (± SD) in DNMT1 protein compared with untreated cells, based on data from 3 independent experiments. (E) Gene expression levels of CD7, FHIT, C2orf40, THEMIS, LAIR1, and RNF130 in MT-1 and MT-2 cells after treatment with the indicated compounds.
OR21 suppresses tumor cell growth in a xenograft mouse model with reduced myelosuppression
OR21 was designed with enhanced stability and exhibited 20-fold higher migration in blood than DAC in a pharmacokinetic study of duodenal administration using macaques (supplemental Figure 9A-B). Promoter DNA demethylation in the hemoglobin subunit γ gene was also observed in PBMCs from OR21-treated macaques (data not shown). MT-2 cells were inoculated subcutaneously into immunodeficient Balb/c Rag-2−/−Jak3−/− mice21 and AZA, DAC, and OR21 were injected intraperitoneally because they are rapidly degraded in the acidic stomach environment and could not be administered orally in the mouse model (Figure 6A). The area under the curve value for total DAC after an intraperitoneal injection of OR21 was almost one-half of that observed when equimolar amounts of DAC were injected.20 Area under the curve–guided dosing of OR21 (3.38 mg/kg) suppressed tumor growth to a similar extent as 1.25 mg/kg of DAC (Figure 6B-C). Although equimolar amounts of AZA (1.34 mg/kg) also induced comparable tumor growth inhibition, DNA methylation levels were higher in xenograft tissue from mice treated with AZA than in tissue from DAC- or OR21-treated mice (Figure 6B-D). Importantly, OR21 exhibited lower levels of hematotoxicity than DAC (Figure 6E; supplemental Figure 10A-B). Therefore, OR21 was used for longer term treatment of ATL patient-derived xenograft model mice, which became moribund approximately 50 days after intraperitoneal inoculation of PBMCs from a patient with chronic ATL, to generate large intraperitoneal xenografts containing human CD45+/CADM1+ cells (Figure 6F). Treatment with OR21 suppressed body weight loss and increased survival (Figure 6G-H).


Anti-ATL effects of DAC and OR21 in an in vivo xenograft mouse model. (A) Experimental protocol for establishment of the MT-2 xenograft mouse model and treatment with DNA demethylating compounds. (B) Mean tumor volume in Balb/c Rag-2−/− Jak3−/− mice inoculated with MT-2 cells treated with vehicle (blue; n = 7); 1.25 mg/kg (5.5 µmol/kg) DAC (green; n = 7); 3.39 mg/kg (9.9 µmol/kg) OR21 (red; n = 7); or 1.34 mg/kg (5.5 µmol/kg) AZA (yellow; n = 7). Each compound and vehicle were injected intraperitoneally twice per week, as indicated by the black arrowheads. (C) Tumor weight and (D) DNA methylation levels at THEMIS promoter regions of xenograft tumors dissected from Balb/c Rag-2−/−Jak3−/− mice 22 days after first administration of compounds. Data are expressed as means with SDs (n = 7 per experimental group). Differences between subpopulations were evaluated using the Tukey-Kramer method (*P < .05). (E) Concentration of hemoglobin (HGB), complete blood counts, including white blood cells (WBC), red blood cells (RBC), platelets (PLT), and neutrophils, from BALB/c Rag2−/−Jak3−/− mice 22 days after first administration of compounds. (F) Experimental protocol for establishment of the patient-derived xenograft (PDX) and treatment with OR21. An ATL PDX mouse model was established by intraperitoneal inoculation of PBMCs from a patient with chronic ATL. PBMCs isolated from a patient with chronic ATL contained a much greater proportion of N subpopulation cells (77% of CD3+/CD4+ lymphocytes) than P subpopulation cells (6.5% of CD3+/CD4+ lymphocytes) determined by flow cytometric analysis. Balb/c Rag-2−/− Jak3−/− mice were intraperitoneally (IP) inoculated with PBMCs treated with either vehicle or 1.88 mg/kg OR21 twice per week. A relatively larger IP tumor containing human CD45+/mouseCD45−/CADM1+ cells (HTLV-1–infected human T cells) was formed in vehicle-treated mice ∼50 days after inoculation. (G) Body weights of individual mice and (H) Kaplan-Meier survival curves for the vehicle control (blue; n = 4) and 1.88 mg/kg OR21 (5.5 µmol/kg) (red; n = 5) treated groups. OR21 or vehicle was injected IP twice per week, as indicated by black arrowheads. Statistical significance was assessed using a 2-sided log-rank test.
Anti-ATL effects of DAC and OR21 in an in vivo xenograft mouse model. (A) Experimental protocol for establishment of the MT-2 xenograft mouse model and treatment with DNA demethylating compounds. (B) Mean tumor volume in Balb/c Rag-2−/− Jak3−/− mice inoculated with MT-2 cells treated with vehicle (blue; n = 7); 1.25 mg/kg (5.5 µmol/kg) DAC (green; n = 7); 3.39 mg/kg (9.9 µmol/kg) OR21 (red; n = 7); or 1.34 mg/kg (5.5 µmol/kg) AZA (yellow; n = 7). Each compound and vehicle were injected intraperitoneally twice per week, as indicated by the black arrowheads. (C) Tumor weight and (D) DNA methylation levels at THEMIS promoter regions of xenograft tumors dissected from Balb/c Rag-2−/−Jak3−/− mice 22 days after first administration of compounds. Data are expressed as means with SDs (n = 7 per experimental group). Differences between subpopulations were evaluated using the Tukey-Kramer method (*P < .05). (E) Concentration of hemoglobin (HGB), complete blood counts, including white blood cells (WBC), red blood cells (RBC), platelets (PLT), and neutrophils, from BALB/c Rag2−/−Jak3−/− mice 22 days after first administration of compounds. (F) Experimental protocol for establishment of the patient-derived xenograft (PDX) and treatment with OR21. An ATL PDX mouse model was established by intraperitoneal inoculation of PBMCs from a patient with chronic ATL. PBMCs isolated from a patient with chronic ATL contained a much greater proportion of N subpopulation cells (77% of CD3+/CD4+ lymphocytes) than P subpopulation cells (6.5% of CD3+/CD4+ lymphocytes) determined by flow cytometric analysis. Balb/c Rag-2−/− Jak3−/− mice were intraperitoneally (IP) inoculated with PBMCs treated with either vehicle or 1.88 mg/kg OR21 twice per week. A relatively larger IP tumor containing human CD45+/mouseCD45−/CADM1+ cells (HTLV-1–infected human T cells) was formed in vehicle-treated mice ∼50 days after inoculation. (G) Body weights of individual mice and (H) Kaplan-Meier survival curves for the vehicle control (blue; n = 4) and 1.88 mg/kg OR21 (5.5 µmol/kg) (red; n = 5) treated groups. OR21 or vehicle was injected IP twice per week, as indicated by black arrowheads. Statistical significance was assessed using a 2-sided log-rank test.
Discussion
Here, we demonstrated that HTLV-1 infection-specific hypermethylated DMP methylation profiles reflected ATL disease progression (supplemental Figure 2C; Figure 2A). Although relatively few cases were examined, accumulation of promoter DNA methylation at HTLV-1–specific DMPs was clearly observed in only N subpopulation cells after ATL disease onset (Figure 2D), suggesting that some HTLV-1–infected clones, with aberrant promoter DNA hypermethylation at functionally important genes, may selectively expand during ATL leukemogenesis.
TCR signaling is established as a key driver of ATL leukemogenesis.5 We identified THEMIS, LAIR1, and RNF130 as downregulated with concomitant increased promoter DNA methylation in HTLV-1–infected cells (Figure 3B; supplemental Figure 3A). The molecules encoded by these genes negatively regulate TCR signaling as follows: THEMIS forms a complex with Grb2 and SHP-1/2 and dephosphorylates ZAP-70 and CD3ζ27 ; LAIR1 is highly expressed in naïve T cells and inhibits TCR-mediated activation29,36 ; and RNF130 is an E3 ubiquitin ligase RING finger protein30 with high levels of similarity to human GRAIL protein, which degrades CD3ζ in response to TCR activation.31 Importantly, HTLV-1 bZIP factor, which is constitutively expressed in HTLV-1–infected cells and promotes proliferation of T cells, downregulates LAIR1 gene expression and inhibits THEMIS function via direct interaction, resulting in proliferation of HTLV-1–infected T cells.28 Although comprehensive genomic profiling for ATL revealed an intronic mutation in LAIR1 and 1 missense mutation (848A>C, K283T) in RNF130,5 it remains unknown whether either mutation affects the quality or quantity of protein. Moreover, mutations in THEMIS have not previously been reported. Because accumulation of promoter DNA methylation was detected at the THEMIS and LAIR1 loci in D subpopulation cells from carriers and patients with smoldering ATL (Figure 3B), we suspected that downregulation of THEMIS and LAIR1 via promoter DNA hypermethylation was initiated in HTLV-1–infected cells at an early stage of leukemogenesis, and that those cells were responsible for dysregulation of TCR signaling. We tested ACs whose D+N subpopulations were about 40% of CD3/CD4+ T cells. HTLV-1 proviral load (PVL) is correlated with the D+N ratio.37 Therefore, we believe that the ACs tested in this study were high-risk carriers with high PVL and could not be considered as general ACs with low PVL. Accordingly, it is important to reveal whether the DNA methylation status of these TCR regulators is lower in ACs with smaller D+N subpopulations. Given that THEMIS acts as a positive regulator of TCR signaling in peripheral CD8+ T cells,38 future studies should investigate the molecular mechanisms by which THEMIS regulates TCR signaling and contributes to ATL leukemogenesis.
Our results indicate that aberrant regional DNA hypermethylation is an ATL driver event and a potent therapeutic target. As expected, both DAC and its derivative, OR21, showed potent efficacy against HTLV-1–infected cell lines, concomitant with DNA demethylation in vitro (Figure 5B-C) and in vivo (Figure 6B,D). Because only a small fraction of AZA (10%-20%) is incorporated into DNA after being incorporated into a cell, the DNA demethylation activity of 0.5 μM AZA was almost identical to that of 0.1 μM DAC and OR21 (Figure 5B). Because the HTLV-1–infected cell lines had different sensitivities to AZA vs DAC and OR21 (Figure 5B), it is likely that the tumor growth inhibition by AZA was induced via a different mechanism, possibly through incorporation into RNA.39-41
Recently, treatment with DAC was shown to result in selective-tumor suppressive activities in EP300-mutated ATL cells.42 Although we did not use the same ATL cell lines in this study, we could not find any cellular characteristics indicating DAC sensitivity. DNA methylation status in the LINE-1 promoter region (supplemental Figure 6B) and the magnitude of DNA demethylation (Figure 5C) were not associated with DAC sensitivity in HTLV-1–infected cell lines. DAC suppresses tumor cell growth through several different mechanisms, including G2/M arrest,43,44 DNA damage response,43,44 cellular senescence,45 and reprogramming of gene expression through DNA demethylation. Therefore, to achieve an optimal clinical response, it is necessary to determine which mode of action is predominantly responsible for the anti-ATL effects.
LogP value is widely used to evaluate the lipophilicity of molecules and drugs, with logP values of 0 to 3 indicating good potential for absorption via oral administration.46 The logP value of OR21 is 2.14, and it has CDA-resistant characteristics through silylation of DAC,20 resulting in superior oral bioavailability in monkeys (supplemental Figure 9). Notably, OR21 exhibited antitumor activities with lower levels of hematotoxicity than DAC in mice (Figure 6E), likely because the OR21 agent allows sustained release of DAC. A wide DAC concentration time profile (low maximum serum concentration, long amount of time drug is present at the maximum concentration in serum) has been reported to be suitable for noncytotoxic DNMT1 depletion, with lower grade hematotoxicity.47 The maximum serum concentration and time drug is present at the maximum concentration in serum values for total DAC after an intraperitoneal injection of OR21 were almost one-third and twofold, respectively, compared with those observed when equimolar amounts of DAC were injected.20
Other types of carcinogenesis in humans associated with oncovirus, including human papillomavirus-associated head and neck squamous cell carcinoma and Epstein-Barr virus-positive gastric cancer, also exhibit aberrant DNA hypermethylation status and susceptibility to DNA demethylating agents.48-51 Thus, OR21 may be useful for treatment of oncovirus-related malignancies. After evaluating the efficacy and safety of OR21 in patients with acute and lymphoma ATL as a first clinical trial, a long-term chemo-preventive approach for high-risk HTLV-1 carriers and patients with indolent ATL would be tested.
In summary, aberrant regional DNA hypermethylation, initiated by infection with HTLV-1, contributes functionally to ATL leukemogenesis and is a promising therapeutic target for ATL.
DNA methylation data have been deposited in the Gene Expression Omnibus database under the accession number GSE136189.
The online version of this article contains a data supplement.
The publication costs of this article were defrayed in part by page charge payment. Therefore, and solely to indicate this fact, this article is hereby marked “advertisement” in accordance with 18 USC section 1734.
Acknowledgments
The authors thank Masao Matsuoka (Kumamoto University) and Yasuaki Yamada (Nagasaki University Graduate School of Biomedical Sciences) for providing HTLV-1–infected human T-cell lines. Flow cytometric analyses, pyrosequencing, and real-time PCR were conducted at the Analytical Research Center for Experimental Sciences, Saga University.
This work was supported by grants from Japan Society for the Promotion of Science Grants-in-Aid for Scientific Research (JSPS KAKENHI; JP17H06956, JP16K09850) and OHARA Pharmaceutical Co. provided partial financial support for this work.
Authorship
Contribution: T.W., K. Kojima, N.S.-A., S.K., and E.S. designed, and T.W. conducted, most experiments; S.Y. and T.U. performed comprehensive DNA methylation analysis; N.H. contributed to the selection of OR compounds; T.W., H.U., K. Kamachi, Y.K., N.H., Y.F.-K., and N.Y. contributed to animal experiments and a part of in vitro experiments; T.W., H.N., and A.S. performed some experiments using human clinical samples; S.O. contributed the immunodeficient mouse model; T.W., A.K., S.Y., and T.U. performed bioinformatics analyses; T.W. and E.S. obtained funding for this work; and T.W., S.K., and E.S. wrote the paper, with input from all authors.
Conflict-of-interest disclosure: Y.K. and Y.F.-K. are full-time employees of OHARA Pharmaceutical Co. The remaining authors declare no competing financial interests.
Correspondence: Shinya Kimura, 5-1-1 Nabeshima, Saga University, Saga 849-8501, Japan; e-mail: shkimu@cc.saga-u.ac.jp; and Eisaburo Sueoka, 5-1-1 Nabeshima, Saga University, Saga 849-8501, Japan; e-mail: sueokae@cc.saga-u.ac.jp.

This feature is available to Subscribers Only
Sign In or Create an Account Close Modal