

TO THE EDITOR:
COVID-19 has spread to >210 countries and territories worldwide.1-4 Although some agents are under investigation, there are no targeted drugs that could effectively eliminate or treat the novel virus.5,6 Treatments for patients with COVID-19 are urgently needed, especially for severe or critical cases. COVID-19 convalescent plasma (CCP) therapy involves the administration of plasma from patients who have recovered from severe acute respiratory syndrome coronavirus 2 (SARS-CoV-2) viral infections.7,8 Although several case series and an open-label trial regarding CCP for patients with COVID-19 were previously reported,9-12 the effectiveness and safety of CCP have still not been comprehensively evaluated in large retrospective cohorts or randomized blinded trials. Herein, we present the results of 1568 patients with severe or critical COVID-19, including 1430 patients who received standard treatment only and 138 patients who also received ABO-compatible CCP, in Wuhan Huoshenshan Hospital (China), admitted from 4 February 2020 to 30 March 2020.
The clinical characteristics of patients were compared between the CCP group and the standard treatment group (Table 1). According to the clinical status and body weight of each recipient, 200 to 1200 mL of CCP was transfused (supplemental Methods, available on the Blood Web site; supplemental Figure 1). A 6-category scale score (SCSS) was used to evaluate the clinical status. Despite the higher severity level, only 3 patients (2.2%) died in the CCP group up to April 20, reducing ∼50% of the mortality rate compared with that in the standard treatment group (4.1%). Notably, for the 126 non-ICU patients before CCP therapy, 3 patients (2.4%) were admitted to the ICU, compared with 72 (5.1%) of 1403 ICU admissions in the standard treatment group.
Comparison of clinical characteristics between the CCP and the standard treatment group of patients with severe/critical COVID-19
| Characteristic | Total (N = 1568) | CCP (n = 138) | Standard treatment (n = 1430) | P |
|---|---|---|---|---|
| Age, median (IQR), y | 63 (54-71) | 65 (57-73) | 63 (53-71) | .008 |
| Sex, no. (%) | .3 | |||
| Female | 771 (49.2) | 61 (44.2) | 710 (49.7) | — |
| Male | 797 (50.8) | 77 (55.8) | 720 (50.3) | — |
| Comorbidity, no. (%) | ||||
| Hypertension | 565 (36.0) | 53 (38.4) | 508 (35.5) | .5 |
| Diabetes | 252 (16.1) | 31 (22.5) | 218 (15.2) | .04 |
| Cardiovascular disease | 239 (15.2) | 27 (19.6) | 210 (14.7) | .1 |
| Cerebrovascular disease | 89 (5.7) | 12 (8.7) | 75 (5.2) | .1 |
| Malignancy | 61 (3.9) | 4 (2.9) | 53 (3.7) | .8 |
| Chronic obstructive pulmonary disease | 105 (6.7) | 12 (8.7) | 91 (6.4) | .3 |
| Chronic renal disease | 37 (2.4) | 4 (2.8) | 33 (2.3) | .6 |
| Chronic liver disease | 44 (2.8) | 4 (2.9) | 39 (2.7) | .8 |
| Immunodeficiency | 6 (0.4) | 2 (1.4) | 4 (0.28) | .09 |
| Symptoms, no. (%) | ||||
| Fatigue | 625 (39.9) | 57 (41.3) | 564 (39.4) | .7 |
| Fever | 1080 (68.9) | 93 (67.4) | 984 (68.8) | .8 |
| Cough | 952 (60.7) | 83 (60.1) | 863 (60.3) | 1 |
| Shortness of breath | 181 (11.5) | 28 (20.3) | 150 (10.5) | .001 |
| Chest congestion | 200 (12.8) | 24 (17.4) | 175 (12.2) | .1 |
| Nausea or vomiting | 16 (1.0) | 2 (1.4) | 13 (0.9) | .4 |
| Diarrhea | 43 (2.7) | 4 (2.9) | 39 (2.7) | .8 |
| Highest temperature, median (IQR), °C | 37.1 (36.9-37.4) | 37.2 (37.0-37.4) | 37.1 (36.9-37.3) | .008 |
| Days from symptoms onset to admission, median (IQR) | 25 (14-35) | 35 (18-40) | 25 (14-35) | <.001 |
| Days from admission to discharge, median (IQR) | 14 (8-22) | 22 (16-30) | 14 (8-21) | <.001 |
| Days from symptoms onset to CCP therapy, median (IQR) | — | 45 (39-54) | — | – |
| Degree of severity, no. (%) | .009 | |||
| Severe | 1420 (90.6) | 116 (84.1) | 1304 (91.2) | |
| Critical | 148 (9.4) | 22 (15.9) | 126 (8.8) | |
| Highest SCSS during hospitalization, no. (%) | .04 | |||
| 2: Hospitalized, not requiring oxygen | 730 (46.6) | 55 (39.9) | 675 (50.4) | — |
| 3: Low-flow oxygen therapy | 519 (33.1) | 50 (36.2) | 469 (35.0) | — |
| 4: High-flow oxygen therapy or noninvasive mechanical ventilation | 252 (16.1) | 28 (20.3) | 224 (16.7) | — |
| 5: ECMO or invasive mechanical ventilation | 5 (0.3) | 2 (1.4) | 3 (0.2) | — |
| ICU admission, no. (%) | 75 (4.9) | 3 (2.4) | 72 (5.1) | .2 |
| Clinical outcomes, no. (%) | <.001 | |||
| Discharge from hospital | 1487 (94.8) | 121 (87.7) | 1366 (95.5) | — |
| Death | 62 (4.0) | 3 (2.2) | 59 (4.1) | — |
| Hospitalization | 19 (1.2) | 14 (10.1) | 5 (0.3) | — |
P values marked in bold indicate the significant differences between CCP and standard treatment groups.
ECMO, extracorporeal membrane oxygenation; IQR, interquartile range.
We analyzed the dynamic changes in the SARS-CoV-2 viral load of nasopharyngeal swabs, anti–SARS-CoV-2 antibody levels, and various types of laboratory and radiologic parameters before and after CCP therapy. Within 14 days following CCP therapy, 20 (80%) of the 25 patients who were positive for SARS-CoV-2 became virus free (Figure 1A). The levels of the spike (S)- and receptor binding domain (RBD)-specific immunoglobulin G (IgG) increased within 3 days, which then slightly decreased within 3 to 7 days after CCP therapy. However, nucleoprotein (N)-specific antibody levels did not increase after CCP therapy (Figure 1B). According to a previous study, S- and RBD-specific IgGs play an important role in neutralizing viruses,13 indicating that the immediate increase in S- and RBD-specific IgG was one of the reasons for CCP efficacy. Moreover, antibody levels in the CCP units positively correlated with the antibody changes in recipients (r = 0.4; P = .02) (supplemental Figure 2A). In addition, the percentage of lymphocytes significantly increased within 3 days (P = .0009) and was maintained at a relatively high level within 21 days after CCP therapy, whereas the neutrophil percentage significantly decreased. The concentration of C-reactive protein decreased after CCP therapy (Figure 1C-F), indicating the anti-inflammatory effect of CCP.14 Moreover, 77.9% of cases represented lung lesion absorption within 14 days after CCP therapy (Figure 1G).
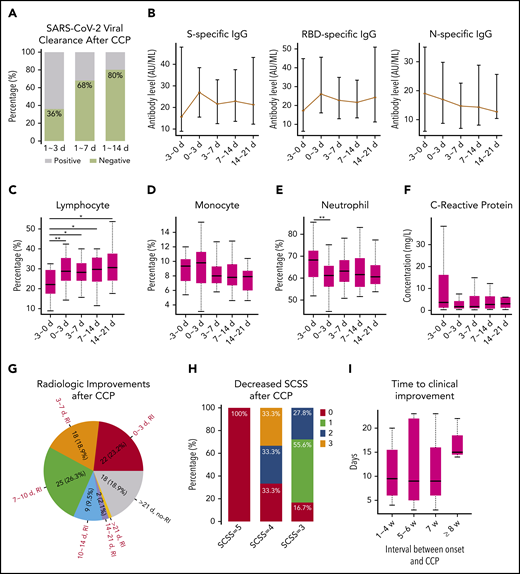
Laboratory, radiologic, and clinical changes after COVID-19 CCP therapy. (A) Proportion of patients who became virus free after 1 to 3 days, 1 to 7 days, and 1 to 14 days of CCP therapy. (B) Dynamic changes in S-, RBD-, and N-specific IgG levels before and after CCP therapy. (C-E) Dynamic changes in lymphocyte, monocyte, and neutrophil percentages before and after CCP therapy. *P < .05; **P < .01. (F) Dynamic changes in C-reactive protein concentrations before and after CCP therapy. (G) Number and proportion of patients with radiologic improvement after 1 to 3 days, 3 to 7 days, 7 to 10 days, 10 to 14 days, and 14 to 21 days after CCP therapy. RI indicates there were radiologic improvements, and no-RI indicates that no radiologic improvements were observed after CCP therapy. (H) Proportion of patients with an SCSS that decreased within 1 week after CCP therapy. (I) Time to clinical improvement after CCP therapy in patients with different therapy timings. The x-axis represents the number of weeks from symptom onset to CCP therapy. The y-axis represents the number of days from CCP therapy to a 2-point decrease in SCSS. The number of patients at 1 to 4 weeks, 5 to 6 weeks, 7 weeks, and ≥8 weeks was 18, 40, 26, and 50, respectively.
Laboratory, radiologic, and clinical changes after COVID-19 CCP therapy. (A) Proportion of patients who became virus free after 1 to 3 days, 1 to 7 days, and 1 to 14 days of CCP therapy. (B) Dynamic changes in S-, RBD-, and N-specific IgG levels before and after CCP therapy. (C-E) Dynamic changes in lymphocyte, monocyte, and neutrophil percentages before and after CCP therapy. *P < .05; **P < .01. (F) Dynamic changes in C-reactive protein concentrations before and after CCP therapy. (G) Number and proportion of patients with radiologic improvement after 1 to 3 days, 3 to 7 days, 7 to 10 days, 10 to 14 days, and 14 to 21 days after CCP therapy. RI indicates there were radiologic improvements, and no-RI indicates that no radiologic improvements were observed after CCP therapy. (H) Proportion of patients with an SCSS that decreased within 1 week after CCP therapy. (I) Time to clinical improvement after CCP therapy in patients with different therapy timings. The x-axis represents the number of weeks from symptom onset to CCP therapy. The y-axis represents the number of days from CCP therapy to a 2-point decrease in SCSS. The number of patients at 1 to 4 weeks, 5 to 6 weeks, 7 weeks, and ≥8 weeks was 18, 40, 26, and 50, respectively.
To investigate the safety of CCP, cardiac, liver, and renal functions were assessed by analyzing the results of routine blood and biochemistry examinations (supplemental Table 1). None of these indexes showed significant differences before and after CCP therapy, except for the decrease in total bilirubin levels. In addition, levels of cytokines such as tumor necrosis factor-α, interleukin-10, and interleukin-6 were compared before and after CCP therapy. The results showed that all of these cytokines remained at the original level. In addition, 3 patients had minor allergic reactions (pruritus or erythema) during the transfusion, but no severe transfusion reactions such as transfusion-associated circulatory overload, transfusion-related acute lung injury, or severe allergic reactions were observed. Along with results of recent reports,15 the low rate of serious adverse events is reassuring.
We classified patients treated with CCP as responders, partial responders, and nonresponders according to the SCSS (supplemental Methods) and investigated the differences in various laboratory parameters between these groups before CCP therapy (supplemental Table 2). The lymphocyte percentage was significantly higher in responders (20.1%, 11.9%, and 6.8% in responders, partial responders, and nonresponders, respectively; P < .001), whereas the neutrophil percentage was significantly lower in responders before CCP therapy (P < .01). The level of C-reactive protein was significantly higher in nonresponders (5.2, 25.9, and 73.1 mg/L in responders, partial responders, and nonresponders; P < .01), indicating that the strong inflammatory reaction was associated with an insensitive response to CCP. In addition, the levels of lactate dehydrogenase, B-type natriuretic peptide, urea nitrogen, procalcitonin, and glucose were markedly higher in nonresponders than in responders before CCP therapy (P < .05), suggesting that abnormal metabolic functions had an effect on CCP response. Although not significant, the antibody levels in CCP units, which were transfused into rapid responders, were higher than those in moderate responders (supplemental Figure 2B). These preliminary results suggest that CCP units with high antibody levels could confer immediate immunity to recipients, and the efficacy of CCP for responders depends on the antibody levels of the donor plasma.
Patients with an SCSS of 5 before therapy showed no improvements after CCP therapy. However, within 7 days after CCP therapy, 66.7% and 83.4% of patients with an SCSS of 4 or 3, respectively, exhibited various degrees of clinical improvement (Figure 1H). This result indicates that CCP could effectively improve the respiratory symptoms of patients with severe disease and help them in being weaned from oxygen support. However, patients who were extremely critically ill could not benefit from CCP, which is consistent with the findings of studies by Li et al12 and Liu et al,16 which showed that intubated or patients with life-threatening COVID-19 were not likely to benefit from CCP.
Experience from SARS-CoV-1 shows that convalescent plasma is most effective when administered shortly after symptom onset, typically within 2 weeks.7,14,17 The study by Liu et al16 showed that the effect of CCP was similar in an interval of 3 weeks’ duration of symptoms. We compared the time to clinical improvement in patients with different therapy timings in our cohort, including 1 to 4 weeks, 5 to 6 weeks, 7 weeks, and ≥8 weeks after symptom onset. The results showed that the median time to clinical improvement was ∼10 days in the 1 to 4 weeks’, 5 to 6 weeks’, and 7 weeks’ groups. However, the time to clinical improvement was significantly prolonged in the ≥8 weeks’ group (Figure 1I).
In summary, we analyzed a large cohort of patients with COVID-19 who received CCP and provide detailed evidence regarding their clinical improvement. Although the homogeneous data obtained from a single center may reduce some biases, there could inevitably be some confounding factors (eg, biased patient assignments) in this retrospective study. In addition, complete data on neutralizing antibody titers in CCP units were not available, limiting the power of evaluating the correlation between the quality of donor plasma and efficacy. Moreover, a stratified analysis of cases of severe and critical patients could not be performed due to the low proportion of critical patients. This analysis differs from existing studies in that its dynamic laboratory observations using large-scale data make it possible to analyze the potential therapeutic mechanism of CCP, recognize the characteristics of responders and nonresponders, and identify the indications and timing of therapy.18 Our results suggest that CCP, transfused even after 2 weeks (median of 45 days in our cohort) of symptom onset, could improve the symptoms and mortality in patients with severe or critical cases of COVID-19. We anticipate that this study could shed new light in clinical practice and monoclonal antibody development for COVID-19.
For original data, please contact Qianghu Wang, wangqh@njmu.edu.cn.
The online version of this article contains a data supplement.
Acknowledgments
This study was supported by the National Natural Science Foundation of China (grants 81572893, 81972358, and 81959113), the Key Foundation of Wuhan Huoshenshan Hospital (grant 2020[18]), the Key Research & Development Program of Jiangsu Province (grants BE2017733 and BE2018713), the Medical Innovation Project of Logistics Service (grant 18JS005), and the Basic Research Program of Jiangsu Province (grant BK20180036).
Authorship
Contribution: Q.W., C.W., and X. Xu had full access to all of the data in the study, take responsibility for the integrity of the data and the accuracy of the data analysis, and were responsible for concept and design; X. Xia, Zhihua Wang, A.Z., X.L., T.L., Z.G., G.C., and Y.P. performed data collection; K.L., L.W., M.Z., B.H., J.L., Ziyu Wang, W.W., L.L., Y.C., M.W., W.L., C.L., and K.Z. contributed to data analysis and interpretation; and K.L., L.W., and B.B. drafted the manuscript.
Conflict-of-interest disclosure: The authors declare no competing financial interests.
Correspondence: Xiaoli Xu, Jinling Hospital, Nanjing University School of Medicine, 305 East Zhongshan Rd, Nanjing 210002, China, e-mail: xxl2019kt@sina.com; Changjun Wang, Center for Disease Control and Prevention of PLA, 20 Dongdajie St, Beijing 100071, China, e-mail: science@hotmail.com; and Qianghu Wang, Center for Global Health, School of Public Health, Nanjing Medical University, 818 Tianyuan East Rd, Nanjing 211100, China; e-mail: wangqh@njmu.edu.cn.
