

Key Points
Within days after anti-PD1 treatment, HRSCs disappear from the tissue, and the TME is altered.
In contrast to solid tumors, no cytotoxic T-cell immune response is detectable.

Abstract
Classic Hodgkin lymphoma (cHL) is the cancer type most susceptible to antibodies targeting programmed cell death protein 1 (PD1) and is characterized by scarce Hodgkin and Reed-Sternberg cells (HRSCs), perpetuating a unique tumor microenvironment (TME). Although anti-PD1 effects appear to be largely mediated by cytotoxic CD8+ T cells in solid tumors, HRSCs frequently lack major histocompatibility complex expression, and the mechanism of anti-PD1 efficacy in cHL is unclear. Rapid clinical responses and high interim complete response rates to anti-PD1 based first-line treatment were recently reported for patients with early-stage unfavorable cHL treated in the German Hodgkin Study Group phase 2 NIVAHL trial. To investigate the mechanisms underlying this very early response to anti-PD1 treatment, we analyzed paired biopsies and blood samples obtained from NIVAHL patients before and during the first days of nivolumab first-line cHL therapy. Mirroring the rapid clinical response, HRSCs had disappeared from the tissue within days after the first nivolumab application. The TME already shows a reduction in type 1 regulatory T cells and PD-L1+ tumor-associated macrophages at this early time point of treatment. Interestingly, a cytotoxic immune response and a clonal T-cell expansion were not observed in the tumors or peripheral blood. These early changes in the TME were distinct from alterations found in a separate set of cHL biopsies at relapse during anti-PD1 therapy. We identify a unique very early histologic response pattern to anti-PD1 therapy in cHL that is suggestive of withdrawal of prosurvival factors, rather than induction of an adaptive antitumor immune response, as the main mechanism of action.
Introduction
Classical Hodgkin lymphoma (cHL) is a B-cell lymphoma with unique features. Neoplastic Hodgkin and Reed-Sternberg cells (HRSCs) represent <5% of cells in the lymphomatous tissue.1 The vast majority of cells forming the tumor mass belong to the nonneoplastic tumor microenvironment (TME), which is primarily composed of T cells, tumor-associated macrophages (TAMs), eosinophils, and mesenchymal stromal cells.2 Thus, the cHL TME has a significant effect on disease symptoms by being the main contributing factor to mass formation. Moreover, the TME seems indispensable for survival of neoplastic HRSCs and, hence, presents a rational target for immune-checkpoint blockade in cHL.3 The vast majority of HRSCs overexpress programmed death-ligand 1 (PD-L1) as a result of genetic alterations4 ; in fact, cHL is the tumor that is most sensitive to antibodies targeting programmed cell death protein 1 (PD1).5,6 To date, most clinical experience was generated in the approved indication of relapsed/refractory (r/r) cHL, and complete or durable remissions with anti-PD1 monotherapy are rarely observed in this setting.7 Very recently, anti-PD1–based first-line treatment with nivolumab plus doxorubicin, vinblastine, and dacarbazine (AVD) chemotherapy showed remarkable efficacy in early-stage unfavorable cHL in the German Hodgkin Study Group (GHSG) phase 2 NIVAHL trial.8 Nevertheless, the mechanism of action of anti-PD1 antibodies in cHL treatment has not been elucidated. Increasing evidence suggests that a cytotoxic immune response, known to be a major contributor of anti-PD1 efficiency in solid tumors, seems less likely to be involved in cHL.9-11 However, studies mechanistically addressing anti-PD1 treatment in cHL are limited to primary biopsies obtained before any treatment and analysis of r/r cHL.4,9 Yet, understanding the mechanism of anti-PD1 therapy is crucial to developing future strategies for rationally combining and/or sequencing anti-PD1 drugs and ultimately improving cHL first-line therapies. Additionally, deciphering mechanisms of anti-PD1 inhibition in the setting of major histocompatibility complex-class I (MHC-I)–deficient tumors, such as HRSCs, yields therapeutic relevance beyond cHL.
Methods
Patients and tissue
Adult early-stage unfavorable cHL patients were randomized within the investigator-initiated GHSG phase 2 NIVAHL trial (NCT03004833) to 4 cycles of the anti-PD1 antibody nivolumab and doxorubicin, vinblastine, and dacarbazine (4x N-AVD), with nivolumab administered on days 1 and 15 of each AVD cycle (arm A) or sequential treatment with 4 doses of nivolumab, 2 cycles of N-AVD, and 2 cycles of AVD at standard doses (arm B); each treatment was followed by 30-Gy involved-site radiotherapy (IS-RT) in all patients.8 We collected paired pretreatment and on-treatment biopsies, with the additional biopsies after start of treatment (SOT) obtained only after separate written informed consent. All rebiopsies were taken from initially involved sites by image-guided procedures within the first days after initiation of nivolumab first-line treatment solely for scientific purposes, irrespective of clinical course. The primary analysis of the NIVAHL clinical trial was published previously.8
Additionally, tumor specimens from patients with r/r cHL who developed progressive disease/relapse during anti-PD1 therapy were reanalyzed and have been described, in part.12 These patients all developed r/r cHL after ≥1 line of conventional chemotherapy and eventually received the anti-PD1 antibody pembrolizumab. These r/r cHL biopsies were obtained at relapse after conventional therapy prior to pembrolizumab treatment, and rebiopsies were obtained as clinically indicated to confirm progression or relapse during ongoing anti-PD1 therapy.12 As healthy controls, lymph node tissues with unspecific hyperplasia/lymphadenitis were obtained from the files of the Lymph Node Registry Kiel, according to the guidelines of the ethics advisory board of the Medical Faculty of the University of Kiel (D447/10). All tissue specimens were fixed in formalin and embedded in paraffin and used for scientific studies after completion of eventually required diagnostic tests.
Immunohistochemistry and digital whole-slide image analysis
Formalin-fixed paraffin-embedded specimens were processed for immunohistochemistry and digital whole-slide image (WSI) analysis, as previously published.1 The histological subtype of cHL and the immunophenotype of HRSCs were analyzed by visual inspection by an experienced pathologist. To analyze the composition of the microenvironment by immunohistochemistry, we used 2 independent methods. The cells in the immediate proximity of HRSCs were quantified by manual counting, and the whole tissue composition was analyzed by digital image analysis of WSIs. To analyze the close proximity of HRSCs, ≥1 unambiguously identified HRSC was placed in the center of the microscopic field of view at 400× magnification (∼550 µm in diameter), and the number of positive cells among 100 total cells was manually counted in a circular area around the HRSC. The area assessed around a HRSC is <100 µm in diameter. Distant areas were ≥550 µm away from the HRSC. The average value of 2 independent fields of view was calculated as previously described.13 Expression of β2-microglobulin and HLA-DP was scored by counting the number of HRSCs in the high-power field with membrane or cytosolic staining, as previously described.2 Samples were defined as positive if the majority of HRSCs had membrane staining, they were defined as negative if no HRSC had membrane staining, they were defined as partially positive if only a few HRSCs had membrane staining, and they were defined as cytoplasmic only if only cytoplasmic staining was observed.14
WSIs were generated by Hamamatsu Nanozoomer (Hamamatsu Photonics, Ammersee, Germany), and digital image analysis was performed using Tissue Studio 64 (Definiens, Munich, Germany). The magnification was defined using the metadata of the image (original magnification ×40, pixel resolution [micrometer per pixel] ≈ 0.2270). Parameters were adjusted according to immunohistochemical staining and cell type to obtain optimal assessment of cell counts. Tissue-background separation and defining regions of interest ensured exclusive analysis of areas containing tissue. Using manual adjustments in the program, areas with insufficient staining, overstaining, or folding were excluded. For CD8, PD1, and FoxP3, positively stained cells were counted, and results were expressed as a percentage of stained cells among all cells. The amount of CD30, CD68, and PD-L1 immunostaining was measured as positively stained area (in µm2), and the data are reported as a percentage of the stained area out of the total area analyzed. Details have been published previously.1,15
A list of the antibodies used and the fluorescence in situ hybridization (FISH) procedures for PD-L1 are described in supplemental Methods (available on the Blood Web site).
Gene expression profiling
RNA extraction and gene expression profiling were performed, as previously described,16 using NanoString technology and the PanCancer Immune Profiling Panel, consisting of 730 genes associated with the immune system (nCounter; NanoString, Seattle, WA), including 40 housekeeping genes. Data were processed using nSolver software, as recommended by the manufacturer.
T-cell receptor repertoire in lymphoma tissue
Amplicon TRB-VJ next-generation sequencing of lymphoma tissue was performed as described previously.17 Each sample was spiked with a known copy number of reference sequences to enable correction of sequencing reads to cell copies.18 The amount of analyzed DNA differed among samples (2 µL of DNA was analyzed from each sample, resulting into 2-108 ng per sample); this has been taken into account when normalization to cell copies was performed. Samples were sequenced on the Illumina MiSeq employing 2×250 v2 sequencing kit with a mean coverage of 12 563 reads (range, 7789-123 355). Samples from a single patient were never sequenced within the same sequencing run to prevent contamination. Lymphoma specimen data were analyzed with the ARResT/Interrogate immunoprofiler (arrest.tools/interrogate).19
Analyses of peripheral blood
Details regarding flow cytometry, including the antibody panel and quantitative analysis of serum proteins, are described in supplemental Methods. Peripheral blood mononuclear cells were analyzed by Adaptive Biotechnologies (Adaptive Biotechnologies, Seattle, WA) for the T-cell receptor (TCR) β chain and data evaluation was done with the tools provided by the company in Adaptive immunoSEQ Analyzer.
Statistical analysis
Statistical analyses are described in the supplemental Methods.
Results
Rapid clinical and histological response
Four of 14 biopsies obtained after SOT from initially involved sites showed connective tissue without unequivocal evidence of a lymph node (supplemental Figure 1). To avoid any bias, these potentially noninformative specimens were excluded from further analysis. Biopsy characteristics, including copy number aberrations of the PD-L1 locus of the 10 cases with informative rebiopsies, are summarized in Table 1. Within the first days after SOT, all 10 patients had rapid improvement of symptoms and rapidly regressing lymphadenopathy (supplemental Figure 2). In line with the overall trial cohort, a massive reduction in tumor volume and a complete response (CR) rate of 80% were observed at the first interim restaging after 2xN-AVD or 4xnivolumab, respectively (Table 2).20
Characteristics of biopsies, histology, HRSC phenotype, and FISH
| Patient no. | Histology information | HRSC phenotype by immunohistochemistry | FISH | |||||||||||
|---|---|---|---|---|---|---|---|---|---|---|---|---|---|---|
| Time of rebiopsy (day after SOT) | Biopsy | HRSC detectable | Subtype | EBV (LMP1) | CD30 | CD3 | CD15 | CD20 | PD-L1 | HLA-II (HLA-DR) | HLA-I (β2M) | PD-L1 copy number | Classification according to Roemer et al9 | |
| 1 | 3 | Primary | Yes | Nodular sclerosis | Neg | Pos | Neg | Neg | Pos | Pos | Partially pos | Neg | n.a. | n.a. |
| Rebiopsy | No | n.e. | n.a. | n.a. | n.a. | n.a. | n.a. | n.a. | n.a. | n.a. | n.a. | n.a. | ||
| 2 | 6 | Primary | Yes | Mixed cell | Pos | Pos | Neg | Neg | Pos | Pos | Pos | Pos | 4.14 | Gain |
| Rebiopsy | No | n.e. | n.a. | n.a. | n.a. | n.a. | n.a. | n.a. | n.a. | n.a. | n.a. | n.a. | ||
| 3 | 9 | Primary | Yes | Nodular sclerosis | Neg | Pos | Pos | Neg | Neg | Pos | Pos | Pos | 3.48 | Gain |
| Rebiopsy | Yes | n.e. | n.a. | Pos | n.a. | Neg | n.a. | Partially pos | n.a. | n.a. | n.a. | n.a. | ||
| 4 | 6 | Primary | Yes | Nodular sclerosis | Pos | Pos | Neg | Partially pos | Neg | Pos | Pos | n.a. | 3.82 | Gain |
| Rebiopsy | Yes | n.e. | n.a. | Pos | n.a. | Neg | Neg | n.a. | n.a. | n.a. | n.a. | n.a. | ||
| 5 | 7 | Primary | Yes | Mixed cell | Neg | Pos | Pos | Partially pos | Neg | Pos | Pos | Partially pos | 4.70 | Amp |
| Rebiopsy | No | n.e. | n.a. | n.a. | n.a. | n.a. | n.a. | n.a. | n.a. | n.a. | n.a. | n.a. | ||
| 9 | 4 | Primary | Yes | Mixed cell | Pos | Pos | Neg | Pos | Neg | Pos | Neg | Neg | 5.10 | Gain |
| Rebiopsy | No | n.e. | n.a. | n.a. | n.a. | n.a. | n.a. | n.a. | n.a. | n.a. | n.a. | n.a. | ||
| 10 | 15 | Primary | Yes | Nodular sclerosis | Neg | Pos | n.a. | Pos | Neg | Pos | Partially pos | Neg | 6.88 | Gain |
| Rebiopsy | No | n.e. | n.a. | n.a. | n.a. | n.a. | n.a. | n.a. | n.a. | n.a. | n.a. | n.a. | ||
| 11 | 1 | Primary | Yes | Nodular sclerosis | Neg | Pos | Neg | Pos | Neg | Pos | Cytoplasmic only | Cytoplasmic only | 5.20 | Amp |
| Rebiopsy | Yes | n.e. | n.a. | Pos | Neg | Neg | Neg | Pos | Pos | Pos | n.a. | n.a. | ||
| 13 | 7 | Primary | Yes | Nodular sclerosis | Neg | Pos | Neg | Pos | Neg | Pos | Pos | Cytoplasmic only | 3.30 | Gain |
| Rebiopsy | Yes | n.e. | n.a. | Pos | n.a. | Neg | Pos | Partially pos | Pos | n.a. | n.a. | n.a. | ||
| 14 | 2 | Primary | Yes | Mixed cell | Neg | Pos | Partially pos | Neg | Neg | Pos | Partially pos | Cytoplasmic only | 3.36 | Gain |
| Rebiopsy | Yes | n.e. | n.a. | Pos | Neg | Neg | n.a. | Partially pos | Pos | Partially pos | n.a. | n.a. | ||
Amp, amplification; EBV, Epstein-Barr virus; n.a., not available; Neg, negative; n.e., not evaluable; Pos, positive; β2M, β2-microglobulin.
FISH results are shown as the mean number of PD-L1 copies in 50 counted cells per case.
Characteristics and efficacy outcomes in patients with informative rebiopsy
| Patient no. | Arm | Stage | Remission status at first interim restaging* | SPD reduction at first interim restaging (%) | DS at first nterim restaging | Final remission status | Observation time without PFS event† |
|---|---|---|---|---|---|---|---|
| 1 | B | IIB | CR | −97.34 | 3 | CR | 20.5 |
| 2 | B | IIB | PR | −72.31 | 4 | CR | 22.3 |
| 3 | A | IIA | CR | −100 | 1 | CR | 9.7 |
| 4 | B | IIA | CR | −72.14 | 3 | CR | 12.7 |
| 5 | A | IIAE | CR | −84.59 | 2 | CR | 21.0 |
| 9 | A | IIB | PR | −77.13 | 4 | CR | 19.0 |
| 10 | B | IIA | CR | −89.49 | 3 | CR | 9.0 |
| 11 | A | IIA | CR | −75.64 | 1 | CR | 15.1 |
| 13 | A | IIB | CR | −78.64 | 2 | CR | 13.8 |
| 14 | A | IIB | CR | −87.72 | 3 | CR | 8.2 |
Treatment arm A received 4xN-AVD + 30-Gy IS-RT. Treatment arm B received 4xnivolumab + 2xN-AVD + 2xAVD + 30-Gy IS-RT.
DS, Deauville score; PFS, progression-free survival; PR, partial response; SPD, sum of product of greatest diameter, as measured by computed tomography scan.
Centrally reviewed first interim restaging after 2xN-AVD or 4xnivolumab in treatment groups A and B, respectively.
No patient experienced disease progression or relapse so far (data cutoff for PFS calculations was 25 October 2019).
Strikingly, 5 of 10 (50%) rebiopsies were devoid of HRSCs and only contained lymphatic tissue (Figure 1A-D). The other half still harbored HRSCs by visual inspection in hematoxylin and eosin (H&E)-stained and CD30-stained slides (Figure 1E-H). Mirroring the striking clinical response, WSI and gene expression analysis of CD30 confirmed a reduction in HRSCs in all cases, independent of histologically detectable HRSCs (Figure 1I-L). As opposed to solid tumors,21 neither necrosis nor an increase in apoptotic bodies was observed in rebiopsies (Figure 1A-H).
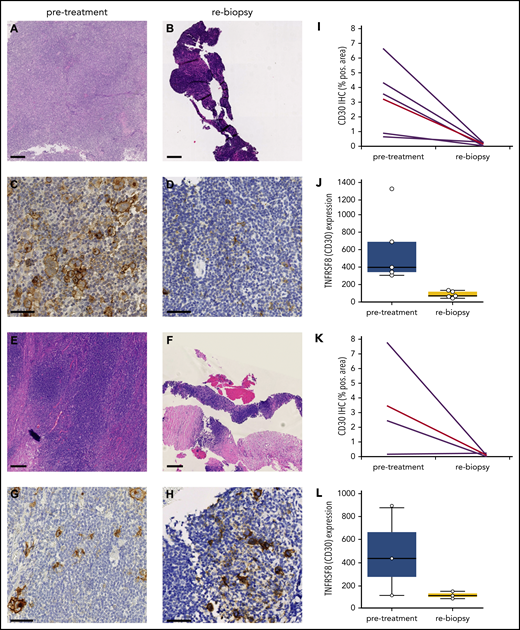
Rapid and (near) complete reduction in HRSCs during anti-PD1 treatment. (A-D) Patient with absence of HRSCs in rebiopsy (A-B, H&E stain; C-D, CD30 stain). (D) At rebiopsy after the start of anti-PD1 therapy, high-magnification images show scattered CD30+ cells resembling small activated immune cells in the tissue but no large HRSCs. (E-H) Patient with maintenance of HRSCs in rebiopsy (E-F, H&E stain; G-H, CD30 stain). Scale bars, 250 µm for H&E staining; 50 µm for CD30 staining. (I-L) WSI and gene expression of CD30 in paired samples. Patients with absence of HRSCs in rebiopsy (I-J) and patients with HRSCs detectable in rebiopsy (K-L). (J,L) Gene expression of TNFRSF8 (CD30) in normalized counts using NanoString technology (P = .0049 for entire cohort, Student t test). (I,K) CD30 immunohistochemically stained area as a percentage of WSI by digital image analysis (P = .0156 for entire cohort, 2-tailed paired Student t test). Red line, mean value.
Rapid and (near) complete reduction in HRSCs during anti-PD1 treatment. (A-D) Patient with absence of HRSCs in rebiopsy (A-B, H&E stain; C-D, CD30 stain). (D) At rebiopsy after the start of anti-PD1 therapy, high-magnification images show scattered CD30+ cells resembling small activated immune cells in the tissue but no large HRSCs. (E-H) Patient with maintenance of HRSCs in rebiopsy (E-F, H&E stain; G-H, CD30 stain). Scale bars, 250 µm for H&E staining; 50 µm for CD30 staining. (I-L) WSI and gene expression of CD30 in paired samples. Patients with absence of HRSCs in rebiopsy (I-J) and patients with HRSCs detectable in rebiopsy (K-L). (J,L) Gene expression of TNFRSF8 (CD30) in normalized counts using NanoString technology (P = .0049 for entire cohort, Student t test). (I,K) CD30 immunohistochemically stained area as a percentage of WSI by digital image analysis (P = .0156 for entire cohort, 2-tailed paired Student t test). Red line, mean value.
In r/r cHL, an association between MHC-II expression on HRSCs, as well as copy number gains of PD-L1, and superior response to anti-PD1 treatment was described.9 In our treatment-naive cohort, MHC-I and MHC-II expression and PD-L1/2 copy number gains and translocations did not correlate with the very early histologic response pattern (Table 1). In fact, all patients described herein completed the study therapy as planned and achieved a sustained currently ongoing CR, independently of the differences observed in the early on-treatment rebiopsy (Table 2).8 Of note, MHC-I was expressed at least partially in 3 of 9 (33%) evaluable cases, and MHC-II was expressed at least partially in 8 of 10 (80%) evaluable cases (Table 1).
Most of the evaluable specimens obtained during anti-PD1 treatment still harbored scattered T cells with weak reactivity for PD1 by immunohistochemistry (supplemental Figure 3), even though anti-PD1 therapy with nivolumab blocked binding of the PD1 antibody used for immunohistochemistry on lymphocytes of the peripheral blood (supplemental Figure 4).
Absence of cytotoxic immune response to anti-PD1 treatment
To understand whether anti-PD1 treatment is capable of inducing a T-cell immune response, we analyzed the tumoral TCR repertoire and the expression of genes associated with a cytotoxic response. Our TCR repertoire analysis indicates significantly lower clonality and a lower ratio of the 10 most abundant clones in untreated cHL compared with solid tumors (supplemental Figure 5), suggesting a low pretreatment T-cell immune response against HRSCs. Furthermore, the analysis of intratumoral CD8+ T-cell content by WSI was also different from that observed in solid tumors,11 showing no increase in CD8+ T cells during anti-PD1–based first-line treatment (Figure 2A). Similar findings were observed in paired r/r cHL. Gene expression of T-cell–specific genes (CD8A, CD8B, and FoxP3) did not show any increase between pretreatment tissue and the relapsed tumor tissue (supplemental Figure 6). Accordingly, we did not observe any increase in the expression of cytotoxicity genes following treatment, with granzyme B even experiencing a decreased expression (Figure 2B). In line with this observation, TCR repertoire analysis did not reveal any increase in clonality or expansion of clonotypes after SOT (Figure 2C-E). Therefore, an adaptive cytotoxic immune response appears unlikely to contribute to the disappearance of HRSCs observed in the rebiopsies. Next, we analyzed peripheral blood samples of the patients also collected within the first days after SOT, at the time point of the rebiopsy. Flow cytometry analysis of immune cell populations revealed a decrease in natural killer cells and CD8+ T cells and an increase in CD4+ T cells (Figure 3A). Confirming an absence of a cytotoxic immune response, we also did not find an increase in clonality or clonal TCR repertoire expansion in PBMCs before or early after SOT (supplemental Figure 7). However, we observed an increase in naive cells within the group of CD8+ T cells 1 week after SOT (Figure 3B). Finally, cytokines reflecting an activation of cytotoxic T cells, such as interleukin-18 (IL-18), IL-10, or interferon-γ, were unchanged at this early time point (supplemental Figure 8). We found a reduction in MDC (CCL22) and IL-9 compatible with the tissue findings of decreased HRSCs as the major source of these cytokines (supplemental Figure 8). Thus, anti-PD1 in cHL patients seems to induce peripheral and intratumoral T-cell dynamics distinct from those observed in solid tumors.22
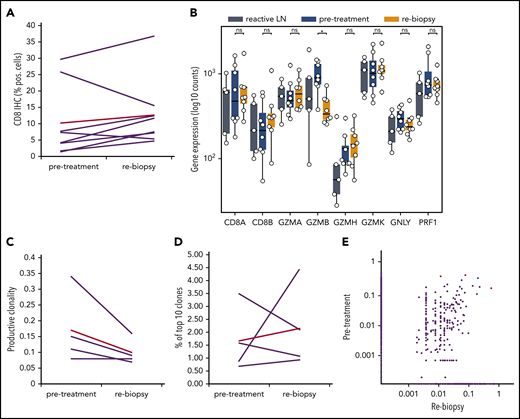
Gene-expression profile and TCR repertoire development during anti-PD1 treatment. (A) WSI of CD8 in paired samples (ns, 2-tailed paired Student t test). Red line, mean value. (B) Gene expression for cytotoxicity. *P < .05, Student t test. (C-E) TCR repertoire analysis of paired samples from 4 patients. (C) Productive clonality (1 minus normalized Shannon’s entropy) in paired samples (P value = ns, 2-tailed paired Student t test). (D) Percentage of the 10 most frequent clones in the total repertoire in each sample. (E) Scatterplot of productive TCR rearrangement in 5 paired biopsies. A total of 238 of 12 442 TCRs were shared between the time points. Shared TCRs that differ significantly between both time points (P < .05, Fisher’s test) are colored red. LN, lymph node; ns, not significant.
Gene-expression profile and TCR repertoire development during anti-PD1 treatment. (A) WSI of CD8 in paired samples (ns, 2-tailed paired Student t test). Red line, mean value. (B) Gene expression for cytotoxicity. *P < .05, Student t test. (C-E) TCR repertoire analysis of paired samples from 4 patients. (C) Productive clonality (1 minus normalized Shannon’s entropy) in paired samples (P value = ns, 2-tailed paired Student t test). (D) Percentage of the 10 most frequent clones in the total repertoire in each sample. (E) Scatterplot of productive TCR rearrangement in 5 paired biopsies. A total of 238 of 12 442 TCRs were shared between the time points. Shared TCRs that differ significantly between both time points (P < .05, Fisher’s test) are colored red. LN, lymph node; ns, not significant.
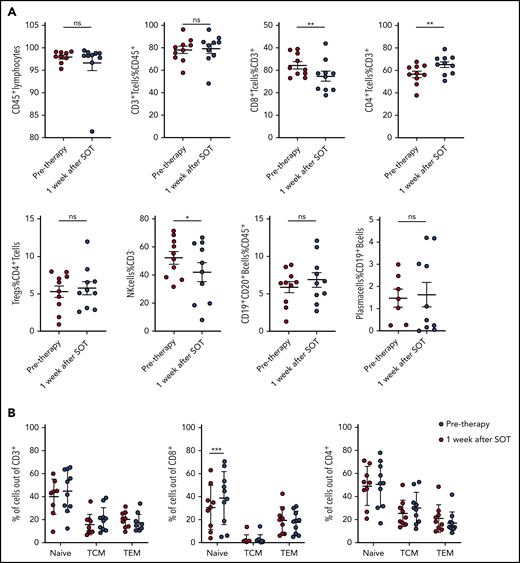
Kinetics of main lymphocyte subsets in the peripheral blood. (A) Frequency of main lymphocyte subsets by flow cytometry in peripheral blood of cHL patients before and 1 week after SOT. *P ≤ .05, **P ≤ .01, 2-tailed paired Student t test. (B) Increase in peripheral blood naive CD8+ T cells 1 week after nivolumab SOT. ***P = .0005, Sidak’s multiple-comparisons test. ns, not significant; TCM, central memory T cells; TEM, effector memory T cells.
Kinetics of main lymphocyte subsets in the peripheral blood. (A) Frequency of main lymphocyte subsets by flow cytometry in peripheral blood of cHL patients before and 1 week after SOT. *P ≤ .05, **P ≤ .01, 2-tailed paired Student t test. (B) Increase in peripheral blood naive CD8+ T cells 1 week after nivolumab SOT. ***P = .0005, Sidak’s multiple-comparisons test. ns, not significant; TCM, central memory T cells; TEM, effector memory T cells.
Reduction in Tr1 T cells and PD-L1+ TAMs
To unravel the early microenvironmental dynamics during anti-PD1 treatment, we used NanoString gene expression profiling of immune-related genes. Compared with pretreatment samples, we primarily detected downregulation of HRSC-associated genes in the rebiopsies, likely reflecting the disappearance of HRSCs (Figure 4A-B).23 However, there was also a striking downregulation of genes typically expressed by type 1 regulatory (Tr1) T cells (LAG3, TNFRSF8, IL2RA/CD25, BATF; Figure 4C). Tr1 T cells exert their immunosuppressive function without expressing FoxP3. Accordingly, gene expression and WSI analyses did not show any change in FoxP3 expression during treatment, despite the observed decrease in Tr1 T cells (Figure 4C; supplemental Figure 3D). Notably, Tr1 T cells have recently been described as crucial components of cHL’s TME. Being CTLA4+, but PD1−, Tr1 T cells are probably not directly targeted by the anti-PD1 therapy.24 In our study, PD1 expression by WSI analysis and gene expression were not altered early after SOT, suggesting that the PD1+ population of FoxP3+ regulatory T cells (Tregs) is quantitatively not affected by the treatment (supplemental Figure 3C). Additionally, we found a strong downregulation of PD-L1 under therapy, whereas the total macrophage content measured by CD68 was not significantly altered (Figure 4C-D). Interestingly, however, anti-PD1 therapy induced a strong reduction in PD-L1 expression on TAMs spatially associated with HRSCs, whereas TAMs more distant from HRSCs appeared less affected (supplemental Figure 9). These data suggest that HRSCs induce a change in phenotype on the closely spaced associated cell populations of PD-L1+ TAMs and LAG3+ Tr1 T cells in vivo, and the composition of the microenvironment collapses with the disappearance of the neoplastic cells. Of note, FoxP3+ Tregs, an abundant population and proposed target of anti-PD1 therapy in the microenvironment of cHL,25 appear to be unaffected at this early time point.
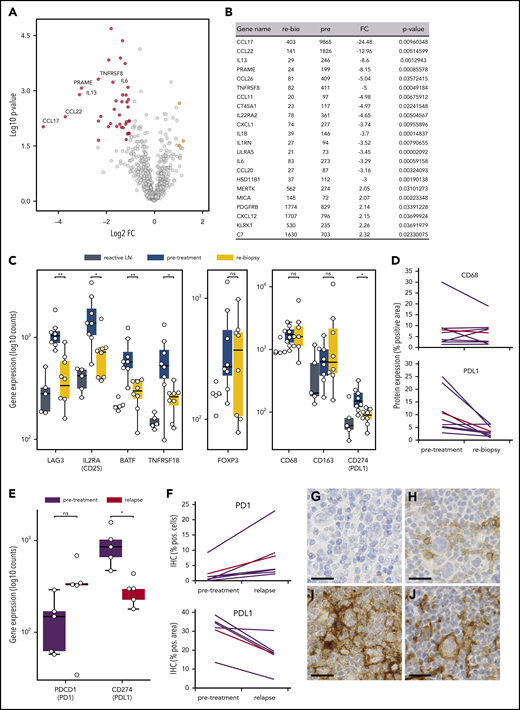
Microenvironmental dynamics during anti-PD1 therapy. (A) Volcano plot showing the most significant changes in gene expression comparing rebiopsies with pretreatment Hodgkin lymphoma (HL) samples, using the NanoString PanCancer Immune Profiling Panel. The fold change of gene expression (FC) is plotted against the P value. Genes highlighted in red have an FC < −2 and a P value < .05, whereas genes highlighted in yellow have an FC > 2 and a P value < .05. The graph also shows the expression changes of a group of known HRSC genes. (B) Most significant differentially expressed genes comparing rebiopsies with pretreatment samples. (C) Analysis of gene-expression changes for a group of genes associated with the Tr1 phenotype (left panel), for FoxP3 as a marker for Tregs (middle panel), and for macrophage genes (right panel) in samples from reactive lymph nodes (LN), HL pretreatment samples, and the relative rebiopsies. *P < .05, **P < .005, Student t test. (D) WSI analysis of CD68 and PD-L1 in HL pretreatment samples and the relative rebiopsies. The difference in CD68 expression was not significant, whereas PD-L1 showed a significant reduction in expression (P = .0276, 2-tailed paired Student t test). Red lines represent the mean values. (E) Analysis of gene-expression changes for PDCD1 (PD1) and CD274 (PD-L1) in paired samples from a r/r cHL cohort with progressive disease/relapse during anti-PD1 therapy. *P < .05, Student t test. (F) Immunohistochemical image analysis of PD1 and PD-L1 in samples from the same cohort as in (E). Increase in PD1+ staining was analyzed by WSI and was not significant (P = .0667, 2-tailed paired Student t test). PD-L1 was analyzed on image sections by manually removing HRSCs in the program before analysis, and measuring of PD-L1 staining was only done on macrophages. The decrease in PD-L1 staining was significant (P = .0184, 2-tailed paired Student t test). Red lines are mean values. Representative images of HRSCs and surrounding TME in r/r cHL samples with progressive disease/relapse during anti-PD1 therapy stained with an anti-PD1 (G-H) or an anti–PD-L1 (I-J) antibody. (G,I) r/r cHL prior to anti-PD1 treatment. (H,J) Relapse during anti-PD1 treatment. Scale bars, 25 µm. ns, not significant.
Microenvironmental dynamics during anti-PD1 therapy. (A) Volcano plot showing the most significant changes in gene expression comparing rebiopsies with pretreatment Hodgkin lymphoma (HL) samples, using the NanoString PanCancer Immune Profiling Panel. The fold change of gene expression (FC) is plotted against the P value. Genes highlighted in red have an FC < −2 and a P value < .05, whereas genes highlighted in yellow have an FC > 2 and a P value < .05. The graph also shows the expression changes of a group of known HRSC genes. (B) Most significant differentially expressed genes comparing rebiopsies with pretreatment samples. (C) Analysis of gene-expression changes for a group of genes associated with the Tr1 phenotype (left panel), for FoxP3 as a marker for Tregs (middle panel), and for macrophage genes (right panel) in samples from reactive lymph nodes (LN), HL pretreatment samples, and the relative rebiopsies. *P < .05, **P < .005, Student t test. (D) WSI analysis of CD68 and PD-L1 in HL pretreatment samples and the relative rebiopsies. The difference in CD68 expression was not significant, whereas PD-L1 showed a significant reduction in expression (P = .0276, 2-tailed paired Student t test). Red lines represent the mean values. (E) Analysis of gene-expression changes for PDCD1 (PD1) and CD274 (PD-L1) in paired samples from a r/r cHL cohort with progressive disease/relapse during anti-PD1 therapy. *P < .05, Student t test. (F) Immunohistochemical image analysis of PD1 and PD-L1 in samples from the same cohort as in (E). Increase in PD1+ staining was analyzed by WSI and was not significant (P = .0667, 2-tailed paired Student t test). PD-L1 was analyzed on image sections by manually removing HRSCs in the program before analysis, and measuring of PD-L1 staining was only done on macrophages. The decrease in PD-L1 staining was significant (P = .0184, 2-tailed paired Student t test). Red lines are mean values. Representative images of HRSCs and surrounding TME in r/r cHL samples with progressive disease/relapse during anti-PD1 therapy stained with an anti-PD1 (G-H) or an anti–PD-L1 (I-J) antibody. (G,I) r/r cHL prior to anti-PD1 treatment. (H,J) Relapse during anti-PD1 treatment. Scale bars, 25 µm. ns, not significant.
Altered PD1/PD-L1 axis at relapse during anti-PD1 treatment
To understand which alterations in gene expression observed early after SOT are caused by the disappearance of HRSCs and which are related to direct effects of anti-PD1 antibodies on the cHL microenvironment, we reanalyzed 5 pairs of a previously compiled independent series of paired r/r cHL biopsies obtained prior to and at relapse during anti-PD1 treatment.12 These on-treatment biopsies were obtained during or shortly after anti-PD1 treatment and at r/r cHL progression. The gene expression profile of the r/r cHL samples also reflects the influence of anti-PD1 therapy on the microenvironment; however, in contrast to the cHL first-line NIVAHL cohort described above, HRSCs outgrowing during checkpoint inhibition are present. The cohort of r/r cHL patients exhibited high numbers of HRSCs prior to anti-PD1 treatment (Figure 5B), which fell to levels similar to previously untreated cHL at progression during anti-PD1 therapy (Figure 5B). The high level of CD30 expression/HRSC content was characteristic of the r/r cHL cohort under anti-PD1 treatment but was not a general feature of cHL relapse after first-line conventional therapy (Figure 5B). Given the different numbers of HRSCs in pretreatment and relapse r/r cHL under anti-PD1 treatment, differential expression of HRSC-related genes, such as CCL22 and CCL17, was also observed (Figure 5A). Of note, the B-cell content reflected by expression of multiple genes, such as CD20, CD19, CD22, and CD79A/B, was higher in r/r cHL at progression under anti-PD1 treatment compared with pretreatment or untreated cHL (Figure 5A). Interestingly, PD-L1 expression on TAMs was strongly downregulated at progression of r/r cHL during anti-PD1 therapy, despite the presence of HRSCs (Figure 4E-J). In contrast to the rebiopsies during response to first-line anti-PD1 treatment at progression of r/r cHL, PD1 expression is upregulated on intratumoral T cells by gene expression and WSI analysis (Figure 4E-J). Thus, HRSCs at progression/relapse during anti-PD1 therapy grow in a microenvironment different from treatment-naive cHL with respect to the PD1/PD-L1 axis, suggesting that these relapses might represent outgrowth of HRSC subclones with a different capacity to remodel the microenvironment or a lesser dependence on such a microenvironment.
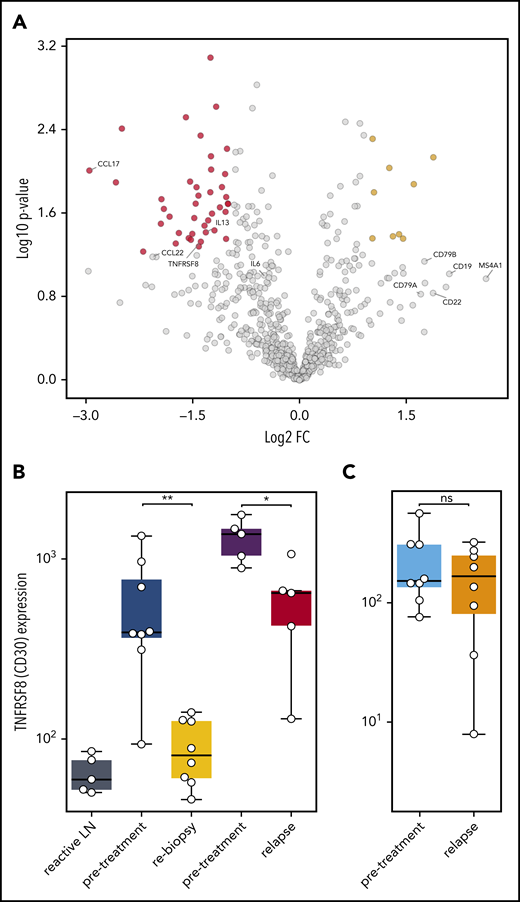
Gene expression in r/r cHL compared with treatment-naive patients. (A) Volcano plot showing the most significant changes in gene expression comparing r/r cHL before and after anti-PD1 treatment, using the NanoString PanCancer Immune Profiling Panel. The fold change in gene expression (FC) is plotted against the P value. Genes highlighted in red have an FC < −2 and a P value < .05, whereas genes highlighted in yellow have an FC higher > 2 and a P value < .05. The graph also shows the expression changes in a group of known HRSC genes (MS4A1 = CD20B). (B) Analysis of TNFRSF8 (CD30) gene expression in samples from reactive lymph nodes (LN), first-line cHL pretreatment samples (blue), on-treatment rebiopsies (yellow), and in pretreatment (violet) and relapse (red) samples from a r/r cHL cohort.12 (C) The same analysis, as in (B), in samples from a cHL cohort that relapsed under conventional therapy (pretreatment: light blue, relapse: orange).13 *P < .05, **P < .005, Student t test. ns, not significant.
Gene expression in r/r cHL compared with treatment-naive patients. (A) Volcano plot showing the most significant changes in gene expression comparing r/r cHL before and after anti-PD1 treatment, using the NanoString PanCancer Immune Profiling Panel. The fold change in gene expression (FC) is plotted against the P value. Genes highlighted in red have an FC < −2 and a P value < .05, whereas genes highlighted in yellow have an FC higher > 2 and a P value < .05. The graph also shows the expression changes in a group of known HRSC genes (MS4A1 = CD20B). (B) Analysis of TNFRSF8 (CD30) gene expression in samples from reactive lymph nodes (LN), first-line cHL pretreatment samples (blue), on-treatment rebiopsies (yellow), and in pretreatment (violet) and relapse (red) samples from a r/r cHL cohort.12 (C) The same analysis, as in (B), in samples from a cHL cohort that relapsed under conventional therapy (pretreatment: light blue, relapse: orange).13 *P < .05, **P < .005, Student t test. ns, not significant.
Discussion
To the best of our knowledge, we present the first analysis of rebiopsies and correlating blood samples taken within days after initiation of anti-PD1 first-line treatment of cHL. We show that the rapid clinical response is accompanied by the disappearance of HRSCs from the tissue a few days after SOT. Hence, a single dose of anti-PD1 treatment as monotherapy or in combination with AVD chemotherapy is capable of eliminating all neoplastic cells within days. Because the clinical response occurred faster than anticipated when the study protocol and rebiopsy program were designed, some rebiopsies failed to reveal any lymphomatous tissue. To the best of our knowledge, such a rapid response to anti-PD1 therapy has not been reported in any other malignancy and appears distinct from the setting of r/r cHL.
In tumors of various origins, the expression of PD-L1 on neoplastic cells is assumed to prevent activation of primed T cells infiltrating the tumor tissue by inhibitory signaling via PD1. Immune checkpoint blockade by anti-PD1 is believed to remove the inhibitory signal and allow activation, proliferation, and cytotoxic activity of T cells. These T cells are at least partially directed against tumor (neo)antigens presented by MHC molecules on tumor cells.26 However, based on our data, the antitumor mechanism of immune checkpoint blockade in cHL and solid tumors seems to differ in this respect. At the time of early clinical, and often already complete, histological response, we did not detect expansion of cytotoxic T cells in the tumor or in blood. Although we cannot definitely exclude a contribution by the few preexisting intratumoral cytotoxic cells to the disappearance of HRSCs during therapy, a relevant expansion or recruitment of cytotoxic T cells does not seem to be required for the striking early therapeutic efficacy. These data contrast with previous observations made in various solid tumors.10,11
The status of PD1+ T cells in the TME remains uncertain, because we do not have sufficient material available for multistaining experiments. Previous studies of pretreatment cHL reported that the highest levels of PD1 expression occurred on Th1 lymphocyte subtypes, such as effector memory T cells reexpressing CD45RA and Tregs.25 It remains uncertain whether markers of exhaustion other than PD1 are expressed on these cells. Extending these studies to cHL under initial treatment or at relapse after anti-PD1 treatment will be a major challenge because of the requirement of vital cells or large lymphoma tissues that allow the application of multiplexing technology.
Nevertheless, our data are in line with previous findings showing that HRSCs are frequently deficient in antigen presentation by MHC-I and, hence, might not represent a target for CD8+ T cells.14 Because r/r cHL patients with potentially functional MHC-II expression on HRSCs responded better to anti-PD1 treatment, an antitumor effect mediated by CD4+ cells has been suggested.9 In fact, most patients in our study had MHC-II expression on HRSCs; however, correlating MHC expression status or PD-L1 amplifications with response to anti-PD1 treatment is not possible at this time, because all patients went into sustained complete remission after study treatment. Although the overall excellent treatment effect in our cohort is based on all treatment modalities applied, it will be interesting to study the association between MHC deficiency and treatment outcomes during the extended follow-up of the NIVAHL trial and in patients ultimately experiencing relapse.
In contrast to what was found in r/r cHL patients, our data on intratumoral and peripheral TCR dynamics from treatment-naive patients argue against a CD4+ T-cell–mediated immune response. In fact, our data suggest that, in cHL, no relevant anti-HRSC T-cell response is primed early after initiation of systemic treatment with concomitant N-AVD or nivolumab monotherapy. Whether a T-cell immune response is induced at later time points of the treatment is beyond the scope of this study, and analyses of such a potential phenomenon are limited by the fast and CR of the disease that precluded biopsies at later stages of treatment. Very recently, peripheral cellular dynamics characterized by TCR repertoire development and cytometry by time-of-flight analyses were reported in patients with r/r cHL at multiple time points throughout anti-PD1 treatment. The investigators observed an increase in TCR diversity under anti-PD1 therapy, in addition to an increase in the expansion of singleton clones that was most pronounced in patients responding well to the therapy. Additionally, an increase in activated natural killer cells and abundance of the CD3−CD68+CD4+GrB+ subtype were associated with achieving a CR with nivolumab.27 In contrast to our study, Cader et al analyzed blood obtained at later time points after the start of anti-PD1 therapy in predominantly heavily pretreated r/r cHL patients. Furthermore, the detection of clonal expansion by Cader et al was documented by expansion of TCR sequences that were either not present or occurred only once in pretreatment samples and that occur >2 times at later time points. It is important to note that this method to define clonal expansion requires high efficiency of TCR sequencing. Hence, it needs to be distinctly established for tissue specimens in which reduced amplification efficiency usually is observed compared with blood samples. Taken together, the study of r/r cHL samples by Cader et al highlights differences between newly diagnosed cHL in terms of preexisting antitumor immunity and T-cell exhaustion. It seems likely that immunological effects differ between the early ones reported in our study and the later ones observed in peripheral blood.27
A likely explanation for the striking efficacy of anti-PD1 agents in first-line cHL treatment might involve the withdrawal of critical survival factors rather than induction of an immune response. Reverse signaling via PD-L1 was recently postulated as a survival signal for HRSCs in an in vitro model of cHL.28 Obviously, the levels of PD1 required on T cells is low, because the majority of cells remain negative for PD1 by conventional immunohistochemistry12,29 but show expression by more sensitive techniques.25 Therefore, the further investigation of whether reverse signaling via PD-L1 plays a role in HRSC survival may require biopsies taken even earlier after anti-PD1 first-line SOT. HRSCs are the source of multiple cytokines that are essential to build and perpetuate a protective microenvironment.23 Our observations provide experimental evidence for the therapeutic relevance of this disease characteristic by showing a massive remodeling of the microenvironment accompanying the disappearance of HRSCs. Two populations of cells, which have recently been described to be abundant in cHL, were predominantly affected early after the start of anti-PD first-line treatment: PD-L1+ TAMs30 and Tr1 T cells.24 Both populations were reduced significantly in the on-treatment first-line biopsies in our study. PD-L1 expression on macrophages has recently been shown to be induced by soluble factors in an in vitro model of cHL.31 Similarly, LAG3 expression, a feature of the Tr1 T-cell phenotype, is induced by soluble factors derived from HRSCs.24 Importantly, our analyses of paired r/r cHL samples suggest a diverse microenvironmental dependency of HRSCs outgrowing anti-PD1 treatment, because PD-L1+ TAMs were still reduced when HRSCs reappeared at disease progression. Of note, the alteration in PD1/PD-L1 expression in the tumor microenvironment seems to be specific for relapses under anti-PD1 treatment and has not been observed in relapses after conventional therapy.13,29,32 It remains unknown whether the observed disturbance in the microenvironment with respect to PD1/PD-L1 reflects HRSCs being less competent in modeling the microenvironment or less dependent on the specific microenvironmental composition.
Although limited by the tissue specimens available, by comprehensively characterizing on-treatment rebiopsies and paired blood samples, our study provides novel insights into early response kinetics to anti-PD1 treatment in cHL. With an increasing number of patients being treated with anti-PD1 drugs, sequential and, ideally, even earlier collection of viable cells from tissues and blood will be of crucial importance to gain further insights into the mechanisms of checkpoint inhibition beyond T-cell–mediated cytotoxicity. Single-cell analysis and longitudinal tracking of individual T-cell clones in tissue and blood will be necessary to ultimately understand whether a T-cell immune response against HRSCs can be induced and plays any role in anti-PD1 efficacy in cHL. So far, our data suggest mostly anergy of HRSCs with a tumor microenvironment that is not primed for a T-cell–mediated response when checkpoint blockade is administered. The striking very early clinical activity and histological remissions, as well as the microenvironmental changes, observed in our study argue for an initial mechanism of action of anti-PD1 distinct from adaptive T-cell–mediated cytotoxicity. Thus, when checkpoint blockade is given to naive patients as a neoadjuvant or debulking treatment, its mechanism of action is likely to be different than in solid tumors or if administered in pretreated disease.10 Taken together, our results may guide future research aimed at optimizing the use of checkpoint inhibition, potentially beyond anti-PD1 blockade in cHL.
TCR data are stored at Adaptive Biotechnologies under numbers University Hospital Schleswig-Holstein- Klapper- P01-01, UnivHosS-H_00107258_R-01 and UnivHosS-H_00090372_R00-02.
Pseudonymized original data will be made available on request to Wolfram Klapper (wolfram.klapper@uksh.de).
The online version of this article contains a data supplement.
The publication costs of this article were defrayed in part by page charge payment. Therefore, and solely to indicate this fact, this article is hereby marked “advertisement” in accordance with 18 USC section 1734.
Acknowledgments
The authors thank all patients enrolled in the GHSG clinical trials, all clinicians and pathologists supporting the clinical trials, and the translational research program of the GHSG. They thank Charlotte Botz-von Drathen, Dana Germer, Lorena Valles Uriarte, and Tabea Steinmüller for excellent technical support and Nikos Darzentas for supporting the TCR analyses.
This work was supported by a grant from German Cancer Aid (Deutsche Krebshilfe No. 70112502). Bristol Myers Squibb financially supported the NIVAHL trial and provided the DAKO PD-L1 antibody and Autostainer Link 48. Scanning and image analysis technology was supported by the Kinderkrebsinitiative Buchholz, Holm-Seppensen.
Authorship
Contribution: P.J.B., H.S., A.E., and W.K. conceived and designed the overall studies; P.J.B. and A.E. led the clinical trial; S.R., P.J.B., I.I., M.G.-M., S.B., F.J., M.K., M. Brüggemann, K.P., E.H., and C.K. generated and analyzed data; S.S., M.S., S.M., U.K., M. Bormann, A.Z., and M.v.B.-B. provided essential biopsy material; J.R., M.F., B.v.T., P.B., H.S., M.v.B.-B., A.R., A.E., and W.K. analyzed data; S.R., P.J.B., and W.K. wrote the manuscript; and all authors approved the final version of the manuscript.
Conflict-of-interest disclosures: P.J.B. reports grants from Bristol Myers Squibb (BMS) during the conduct of the study; grants from Merck Sharp & Dohme (MSD) and Affimed Therapeutics; and grants, personal fees, and nonfinancial support from BMS and Takeda outside of the submitted work. U.K. reports personal fees and travel support, support in an advisory role, and speaker’s honoraria from BMS during the conduct of the study, as well as personal fees from BMS outside of the submitted work. A.Z reports personal fees and nonfinancial support from Takeda and nonfinancial support from Pfizer, Novartis, Gilead Sciences, Roche, BMS, Astellas, and MSD outside of the submitted work. M.F. reports grants from BMS during the conduct of the study and personal fees from Takeda, Amgen, Celgene, and BMS outside of the submitted work. B.v.T. reports grants and nonfinancial support from BMS during the conduct of the study; personal fees from Amgen, Pfizer, Gilead Sciences, and Roche; grants, personal fees, and nonfinancial support from MSD and Takeda; and grants and nonfinancial support from Novartis outside of the submitted work. W.K. institutional grant support from Roche, Amgen, Takeda, and Regeneron outside of the submitted work. P.B. reports grants from BMS during the conduct of the study. A.E. reports grants and nonfinancial support from BMS during the conduct of the study and personal fees from Takeda, BMS, and MSD outside of the submitted work. The remaining authors report no competing financial interests.
Correspondence: Wolfram Klapper, University Hospital Schleswig-Holstein, Campus Kiel, Department of Pathology, Hematopathology Section and Lymph Node Registry, Arnold-Heller-Str. 3, U33, 24105 Kiel, Germany; e-mail: wolfram.klapper@uksh.de.
